If you’re a fan of Dan Brown and read The da Vinci Code, then you have already heard of the Fibonacci sequence of numbers. The numbers in the Fibonacci sequence can be quickly created by adding a subsequent number from the sum of the 2 previous numbers. It usually begins with 1 and 1 and then continues 1, 1, 2, 3, 5, 8, 13, 21, … to infinity.
Introduction to Fibonacci’s Work
The earliest references to this sequence were found in India, but Fibonacci’s use of it brought more attention to a seemingly random occurrence. This is because he could use the number to determine how the rabbit population would grow over some time accurately, something that seems unpredictable.
More attention was drawn 2 centuries after Fibonacci by Leonardo da Vinci’s Vitruvian Man which showed that the human body’s proportions occurred according to some Golden Ratio of 1.618. The golden ratio was then found to occur everywhere in nature from plants to animals, and it is now used in computer algorithms and mathematical computations.
Use of the Fibonacci sequence in Forex trading
In case you were wondering, yes, this is a website about Forex trading, and I apologize if you already knew all this background information. The point is, that the Fibonacci sequence can be used by forex traders the same way it is used by mathematicians to solve equations and many other uses. Since it occurs naturally in many areas, it could also be used to predict with relative accuracy how and where market swings occur.
Being a very popular technical analysis tool, all Forex trading platforms should have the tool in the menu bar. To add the indicator, you have to select 2 points within which the Fibonacci levels will span across. To determine which points to select, you look for the previous longest trend. If this trend was an uptrend, then the Fibonacci retracement should be drawn from the bottom-up and vice versa.
Below is a forex chart with the AUD/USD pair on a daily timeframe. The Fibonacci retracement has been drawn from the lowest point on the 18th of January 2016 to the highest point at the end of April of that same year. On this chart, this uptrend was the longest trend before market prices at that time. The Fibonacci levels will ascend as you count them downwards from 0% to 100%. These are all you will need most of the time, although they continue past 100% to infinity.
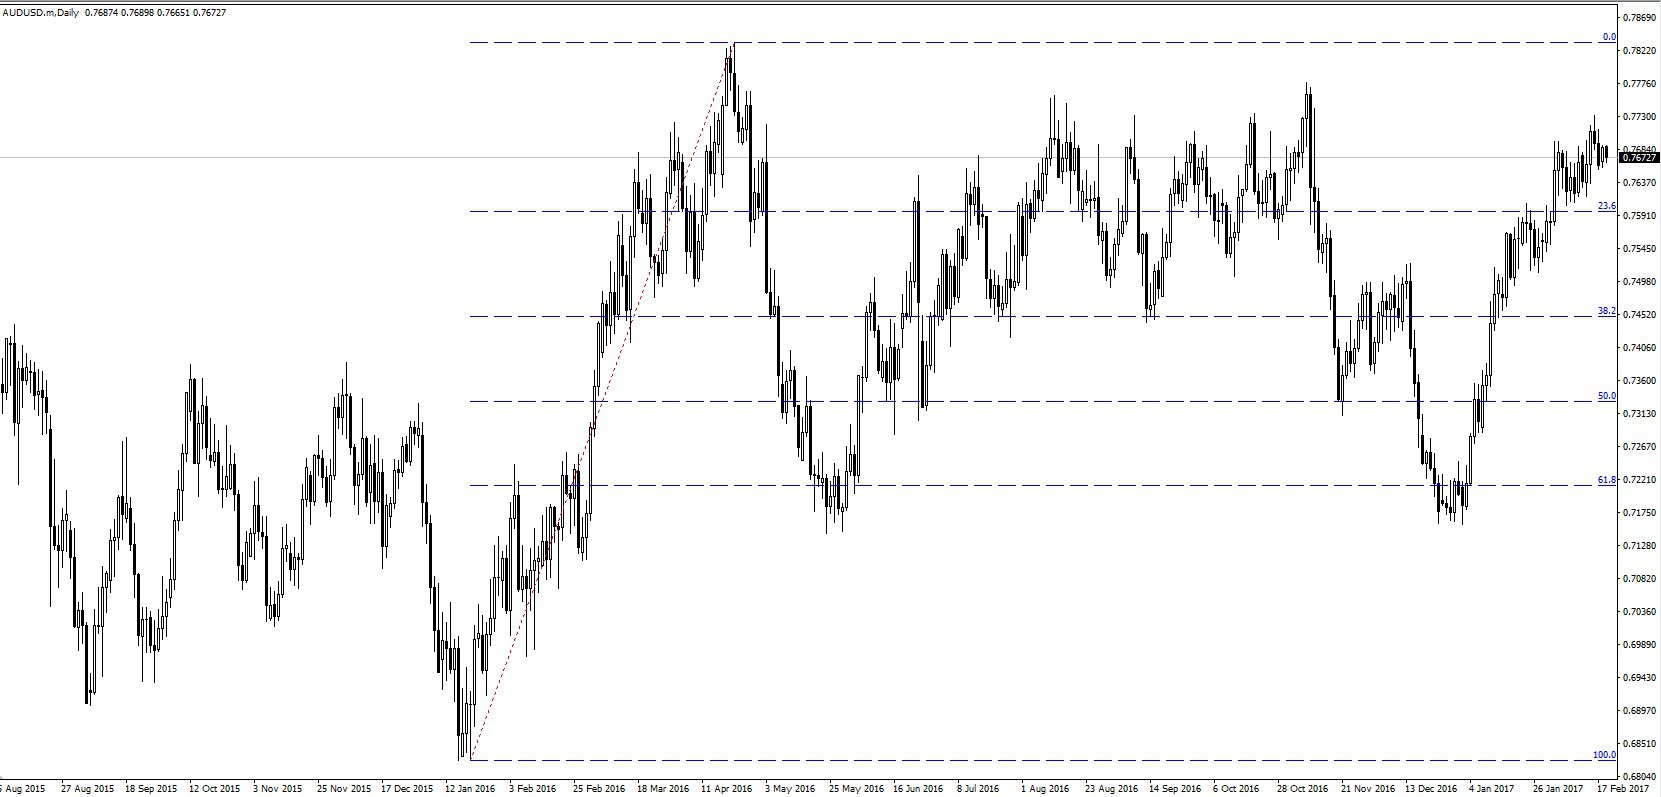
On a downtrend, the Fibonacci levels will be arranged in descending order, although the levels are all you will need to know.
Notice how the Fibonacci levels are creating points of resistance? These levels are creating pivot points, support, and resistance levels around where price action is affected. Furthermore, you can see that these levels keep holding for a long time afterward. A Fibonacci retracement can stay active for a long time until another major trend is formed that breaks the previous one on which the retracement was established. That’s how powerful the Fibonacci retracement is. (All you need to know about pivot points)
Uses of the Fibonacci retracement
Just like Fibonacci used this sequence to predict the population of rabbits on a farm, we as traders can also find a use for it. Some of the most crucial uses include:
Establishing support and resistance levels
Anyone who prefers to use technical analysis over fundamental analysis needs to be able to establish the support and resistance levels of a specific currency pair. However, as we saw before in a previous post about pivot points, (See: using a pivot points strategy) it can be difficult to establish accurate pivot points.
The problem will be that every trader will come up with pivot points based on their interpretation of real-time Forex charts. The figures will vary depending on the timeline, understanding of markets, etc., but the Fibonacci retracement can overcome most of these shortfalls. We’ve seen how easy creating a Fibonacci retracement is already, which leaves only little room for discrepancy.
About timelines, the same retracement can work in various timelines without having to make any changes.
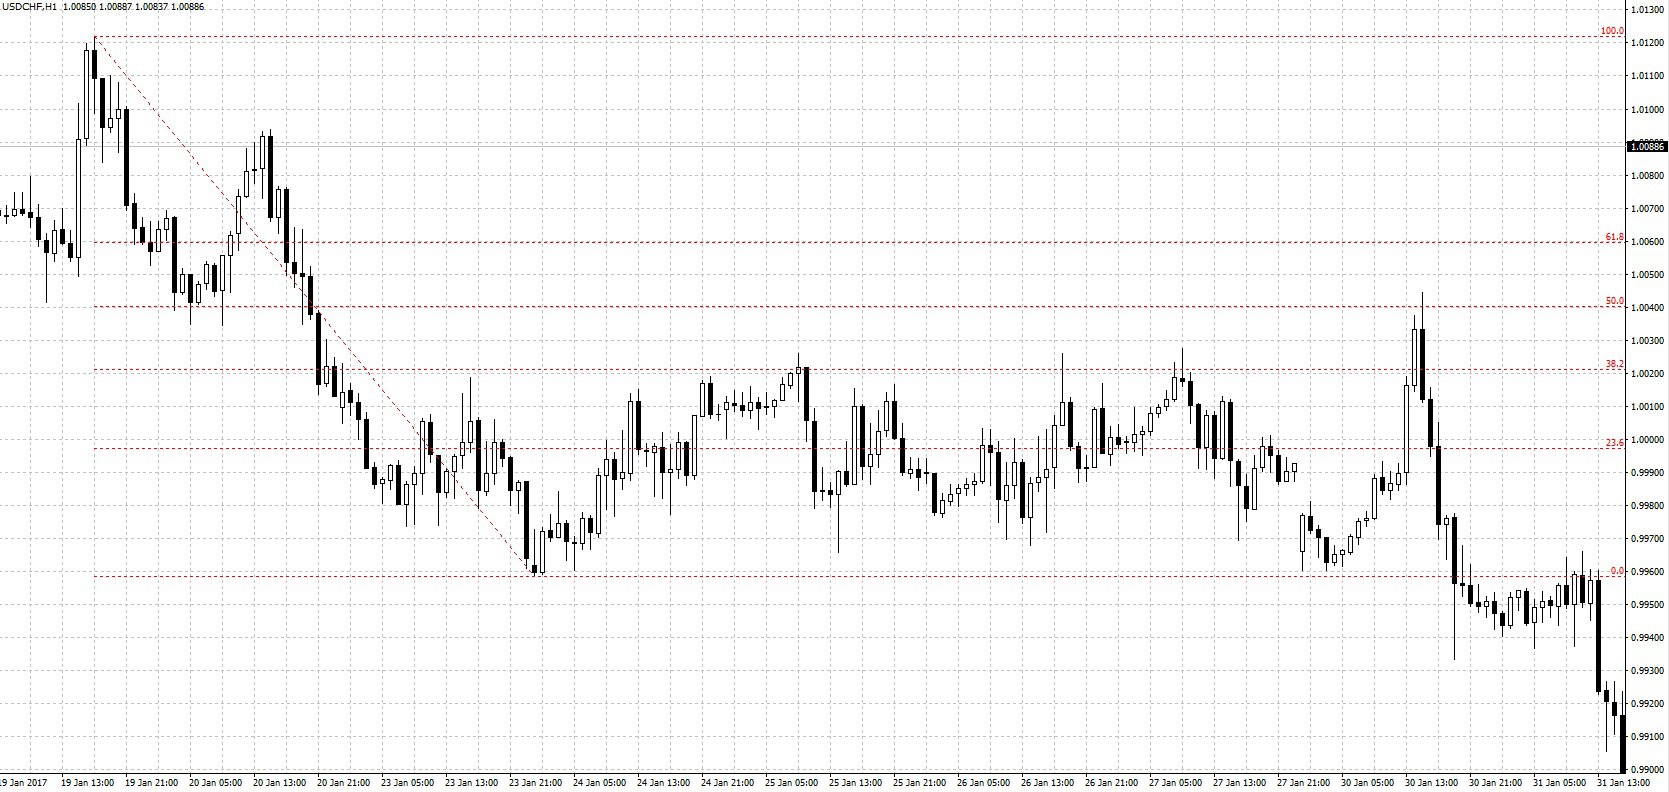
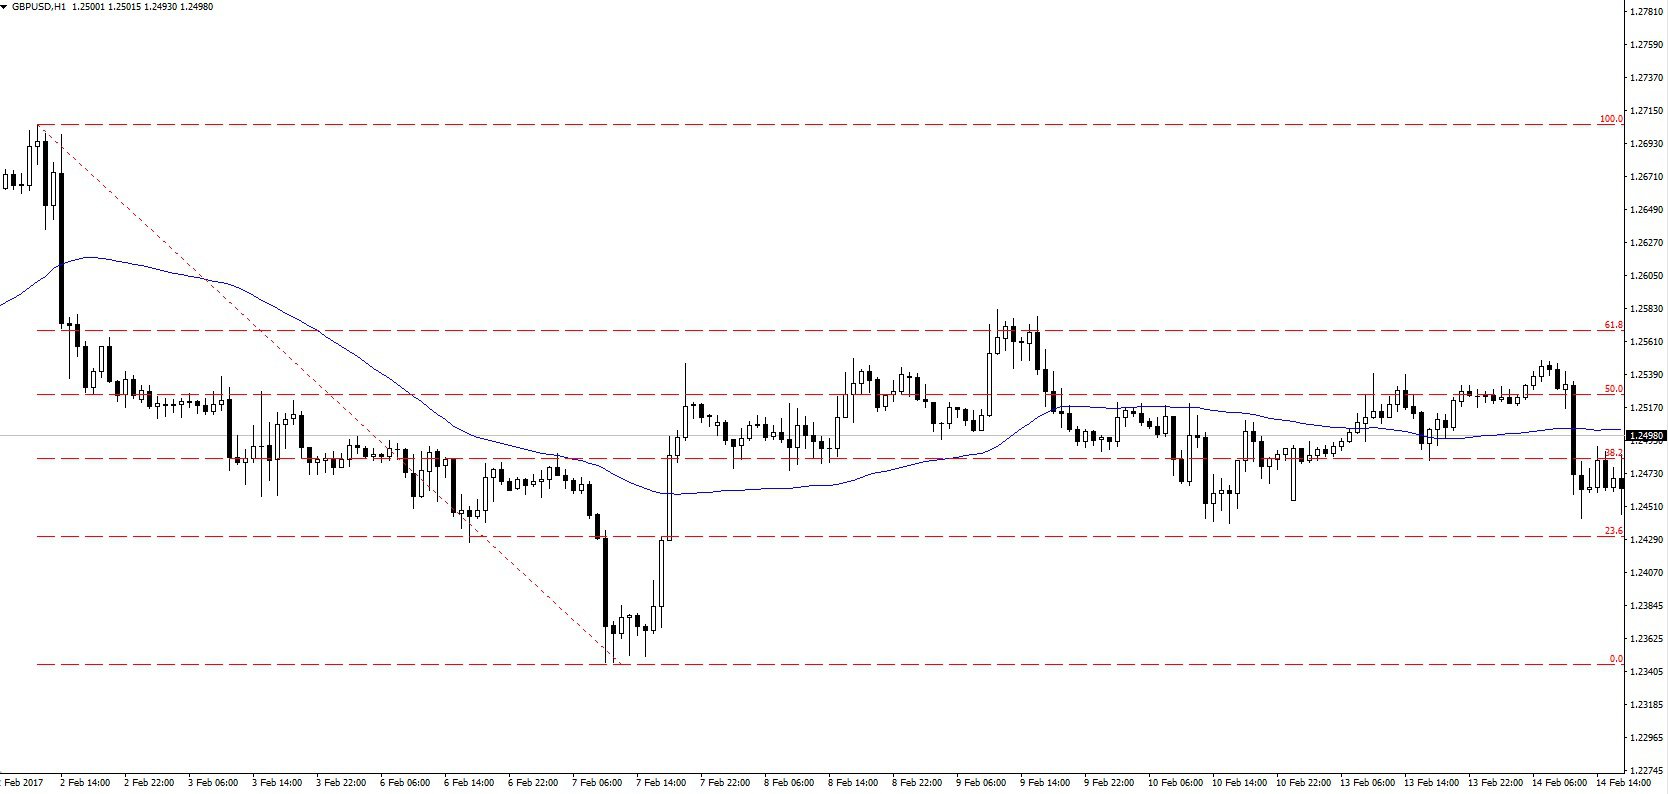
In the above screenshot of a chart, the Fibonacci retracement has been drawn on the H1 chart from the 19th of January 2016 to the 24th of January 2016. Below, the same retracement still holds fast despite switching to an H4 chart, and the indicated pivot points are still strong.
Therefore, the Fibonacci retracement indicator is a much more effective tool for indicating the potential support and resistance levels of a market. Its ease and universality will also provide an added benefit which we’ll see in the final section below.
Indicating suitable entry and exit points
If we keep coming back to this point, that’s because it’s a very crucial one for every trader to learn and achieve. Naturally, you want to be out of a position when the trend is just about to change, and you also want to enter a trade at the very beginning yet avoid false trend reversals. Here’s how the Fibonacci retracement can help with that:
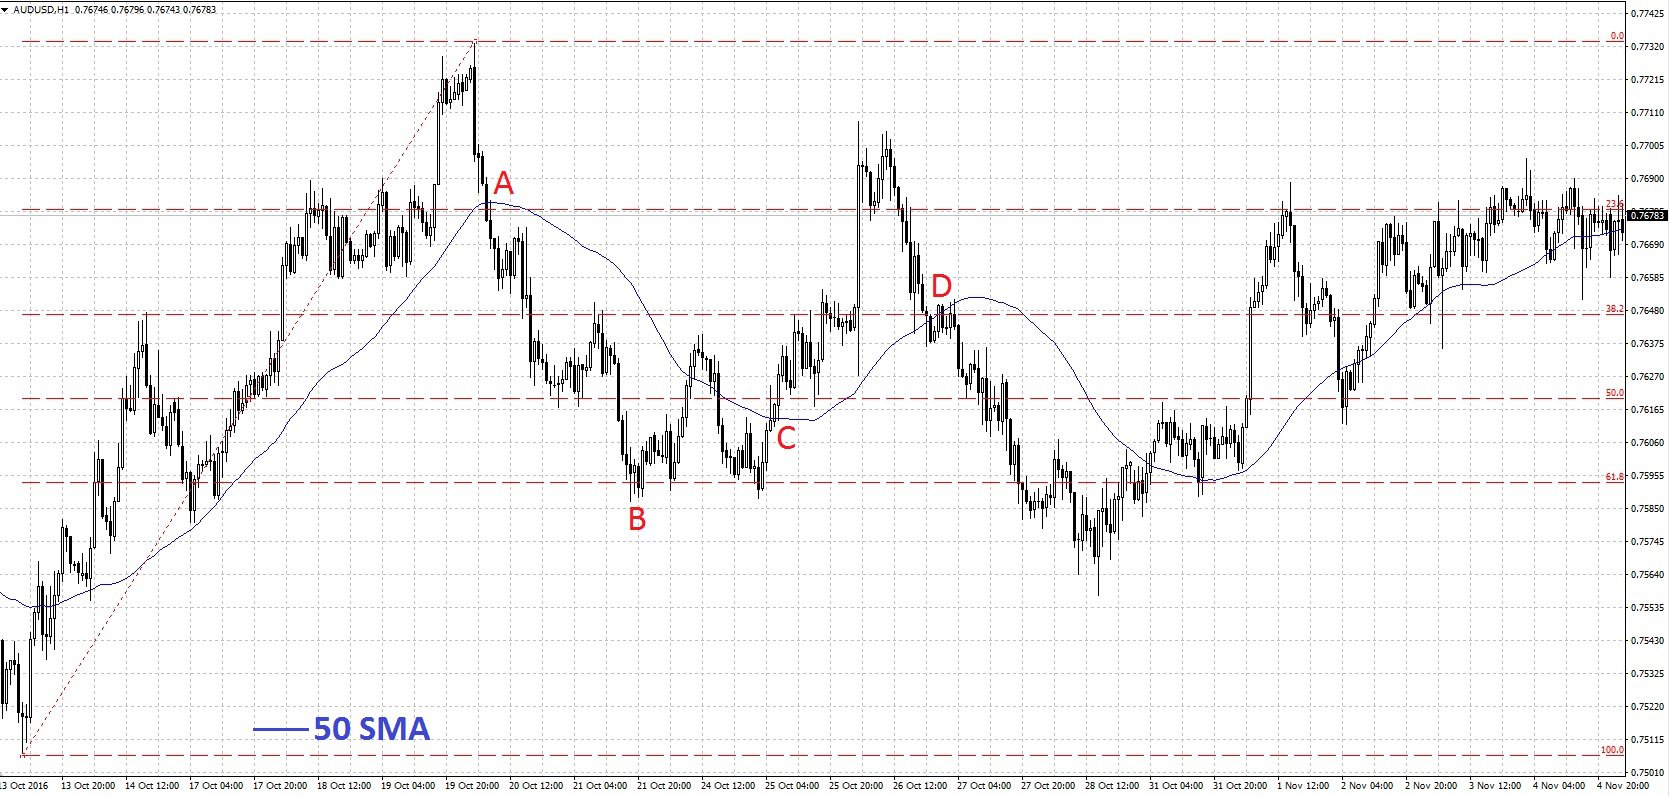
The above chart shows the AUD/USD pair on a very steep uptrend in October 2016, but the trend seems to be changing direction. The Fibonacci retracement is drawn from the lowest to the highest point, and the 50-period SMA is added for good measure. The 2 most important levels of the Fibonacci retracement are the 23.6% level and the 61.8% level.
When the price fails to break the 23.6% level, it is an indication of a market correction and the previous trend will resume. In the case above, the price breaks this level and heads down. As usual, we advise caution, and the simple moving average confirms the trend reversal. This wasn’t a market correction and you can see the price continue to drop. At point A, when the price crossed the 23.6% level, this was the ideal entry position because a major support level was a broker.
To determine when to exit the trade, set your sights on the 61.8% level because this is usually the next stop after breaking the 23.6% level. There was a lot of resistance at the 50% level, as you can see, and the trend even reversed slightly only to be resisted at 38.2%. After this resistance, the downtrend continued up to the 61.8% level at point B which held firm for the following weeks. As I mentioned, this level is usually very strong and it is usually a good place to exit the trade.
The Fibonacci levels can be seen providing clues on where to enter a trade several other times including points C and D when the price closed above the moving average and broke through the set levels.
What to remember when using the Fibonacci retracement
Nothing’s ever perfect, despite being so good, and this analytical tool is no different. When using it, there are several things to keep in mind:
Confirm using other indicators
It is important to be sure before committing yourself to a trade. Fibonacci levels only indicate pivot point levels, which are areas of uncertainty, meaning that you can’t know whether markets will break through or reverse at these points. Of course, you could wait and see, but you might miss out on a portion of the trend, you could also confirm which direction the markets will take using other technical indicators.
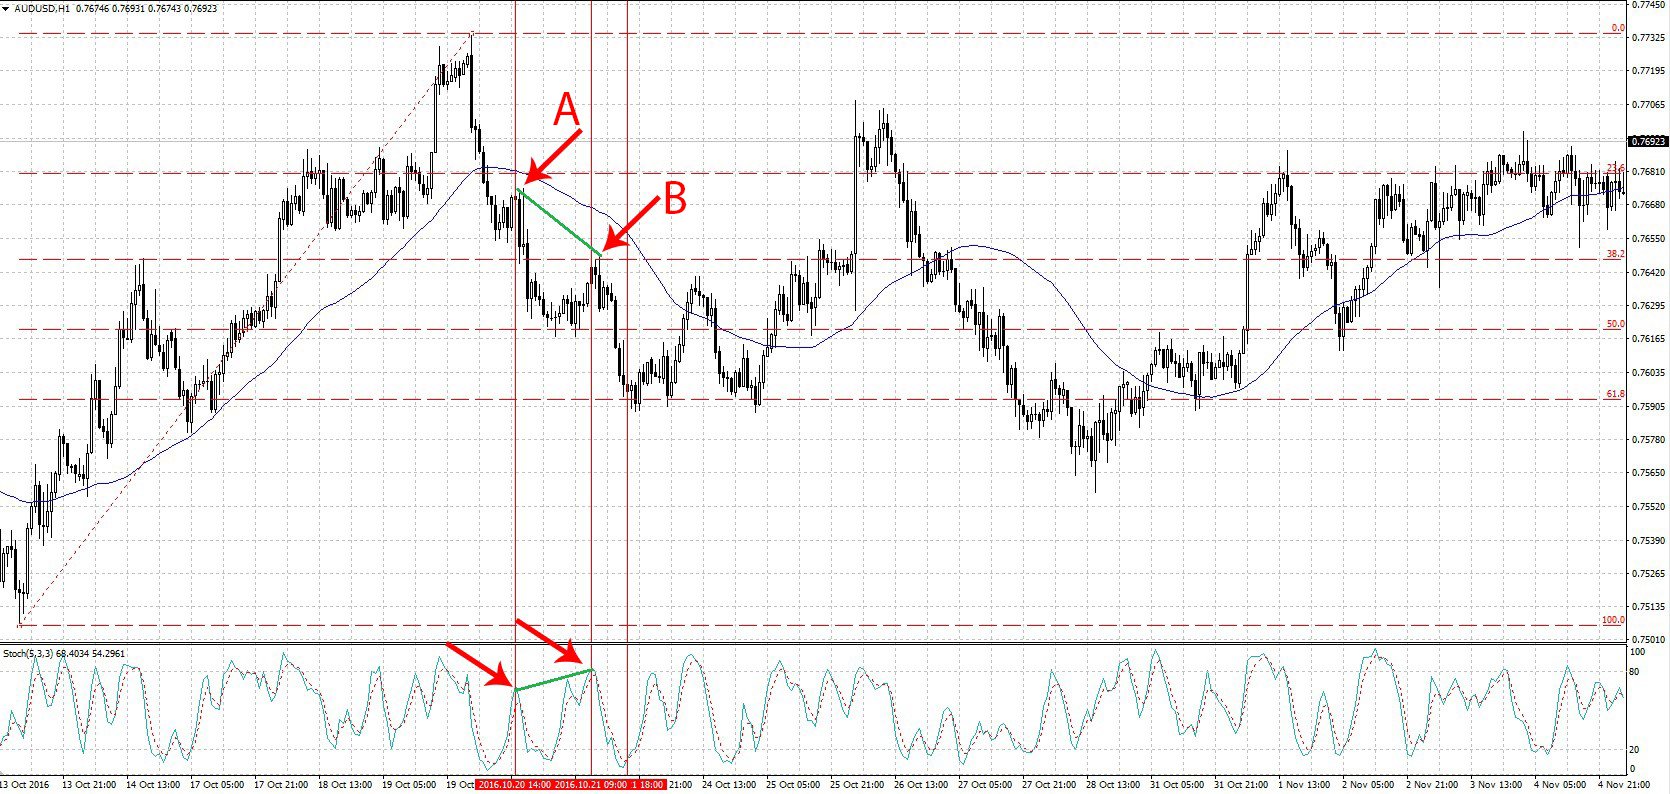
In the chart above, it would have been tempting to exit the position at point A, but the stochastic indicator showed that the market was overbought. Holding a short position would therefore have been a better move. Later, at point B, it would again seem that the 50% Fibonacci level was holding, but our knowledge of divergence would have shown otherwise. (Remember the 5 secrets of Divergence in Forex?)
As you can see, without the technical indicators to confirm the direction of the trend, it would have been more difficult to know how the trend was moving.
The Fibonacci levels are only guidelines
You should not assume that the Fibonacci levels are exact levels at which trends reverse, they are only guidelines. This means that they provide a hint about which area there might be a change, but not the exact price. So, when using the Fibonacci retracement, give the markets time to react to the pivot points until you get confirmation of the direction of the trend.
Remember, the strength of the Fibonacci indicator comes from the traders who are using it, including you and me. Because it is such a popular tool, the Fibonacci levels become a self-fulfilling prophecy as many traders open or close positions around these points. This is why there’s usually a lot of volatility in these areas.
If you can master using the Fibonacci retracement, you will be at a great advantage, so here’s a video with more instructions and insight: