 Alpari
 XM
XMDivergence in Forex trading is a very simple trading strategy when you learn how it works. For those who understand the principles of divergence, it can be a very powerful tool in your trading arsenal, but you won’t profit from it unless you know some secrets about using it.
What is divergence?
Before we get into the secrets of divergence, let’s first look at what constitutes a divergence in Forex. A divergence occurs when there is a mismatch between information on the Forex charts online and the technical indicators. When looking for divergence, oscillating indicators are the ones most commonly used because they are supposed to match the trend created by price action. (Find out which are the Best technical indicators and how to use them)
It doesn’t matter which oscillating indicator you choose, as they all match price action like in the screenshot below.
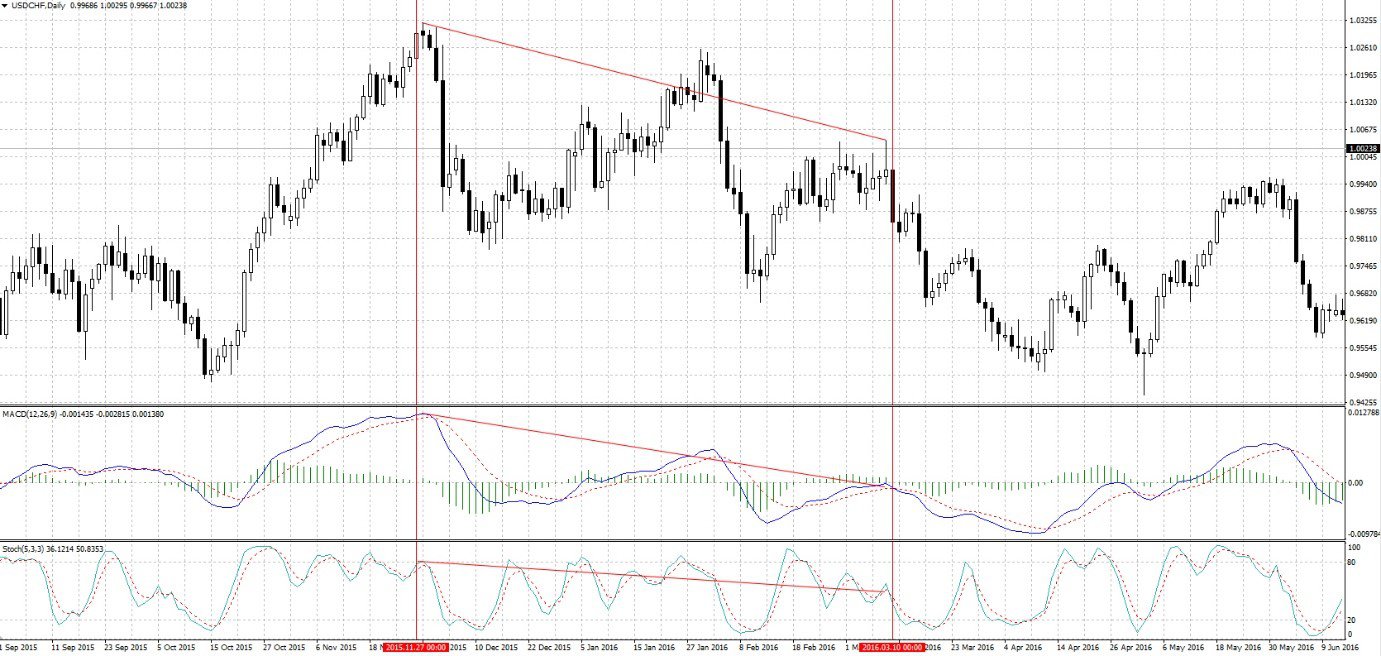
You will notice that as the trend was going down, creating lower highs at each crest, so were the MACD and stochastic indicators. This is what a normal market looks like when there is no divergence. Now look at the next screenshot:
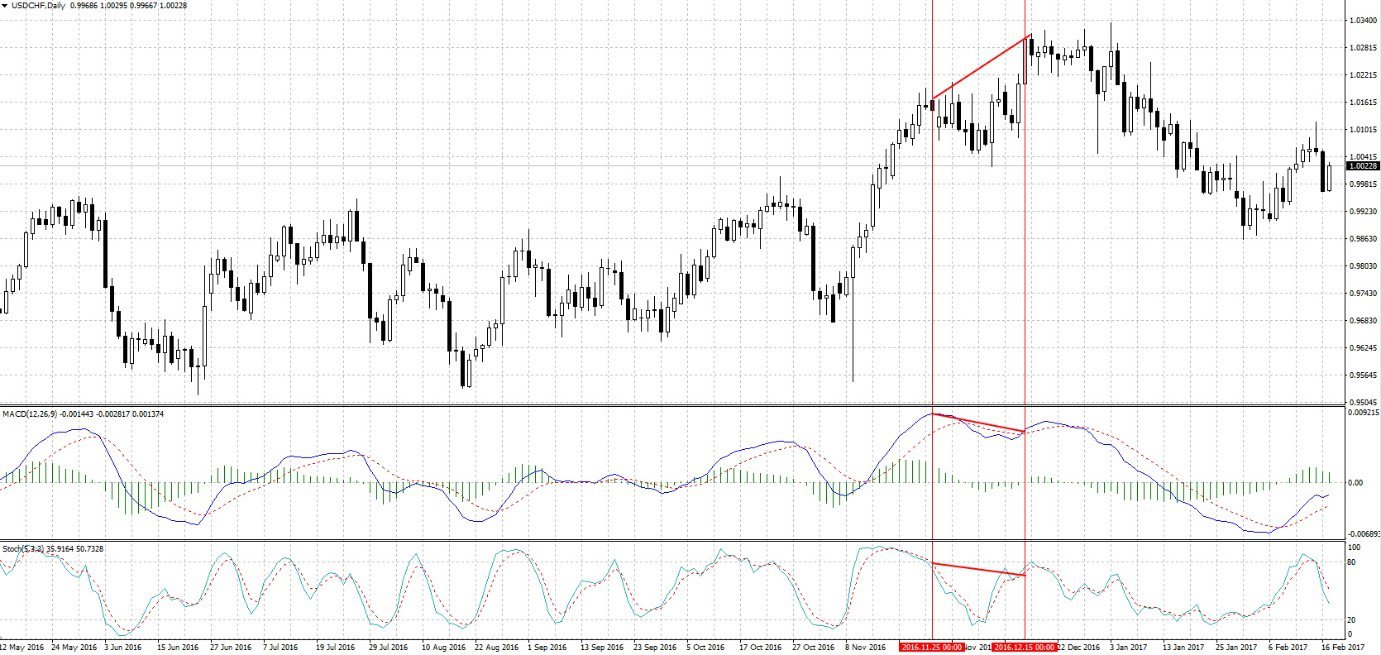
In this case, the price of the USD/CHF pair is going up, creating a higher high, but the indicators are going in the opposite direction. Both the stochastic indicator and the MACD are creating lower highs every time there’s a higher high on the main chart. This is a divergence because price action and the indicators are giving a different story.
You will also notice that soon afterward the uptrend reversed, going sharply downwards, and the indicators followed the downward trend. So as you can now tell, a divergence is spotted when there is a discrepancy between the information indicated by the indicators and the price action on the main window. It can happen in both downtrends and uptrends, the only thing to check is whether the data is matching.
What are the 5 secrets?
So, what are these ‘secrets’ anyway? Always remember these whenever you want to use divergence in your trading:
Make sure the trend is present
We mentioned this earlier but you have to confirm whether there is a dominant trend. A dominant upward trend is recognized by higher highs while a dominant downward trend is recognized by lower lows. If there is no clear indication of either a dominant bullish or bearish trend, the divergence strategy won’t work. Here are 2 examples of a clear dominant trend and a horizontal trend:
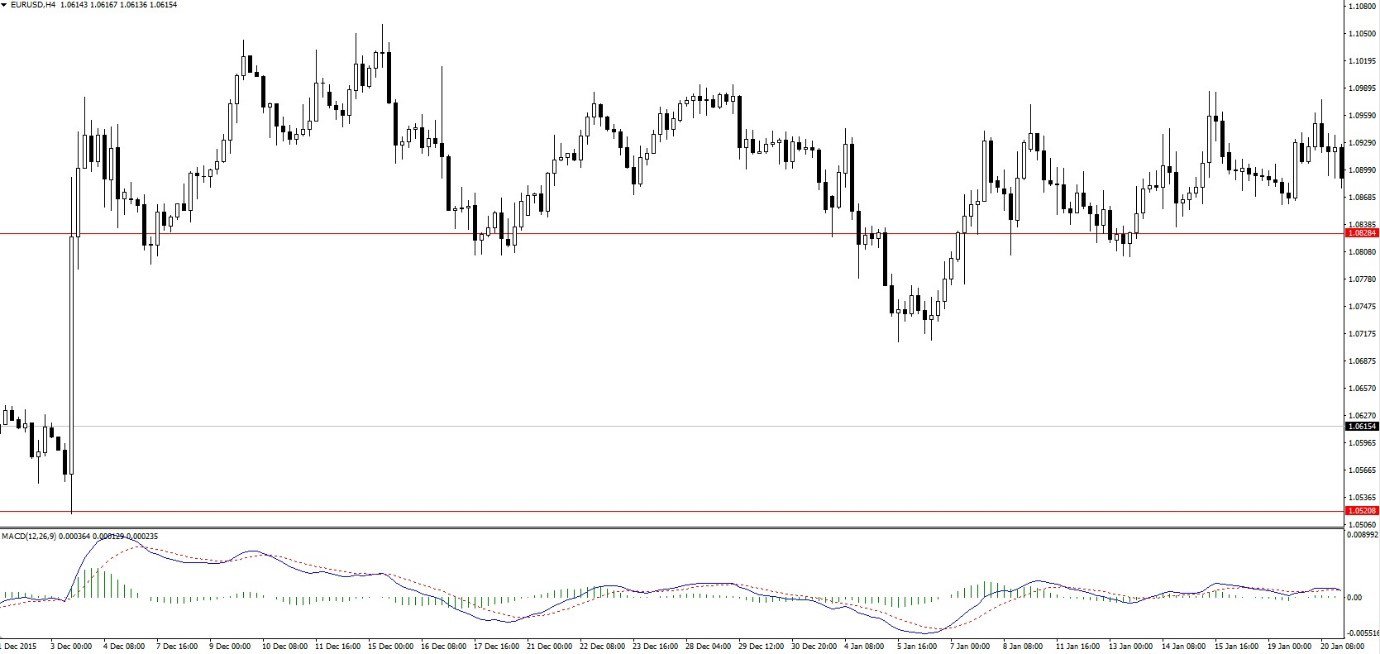
Here, there’s no clear market sentiment and the markets are just oscillating around the primary pivot point. If you see this, just move to another chart because the divergence strategy won’t work.
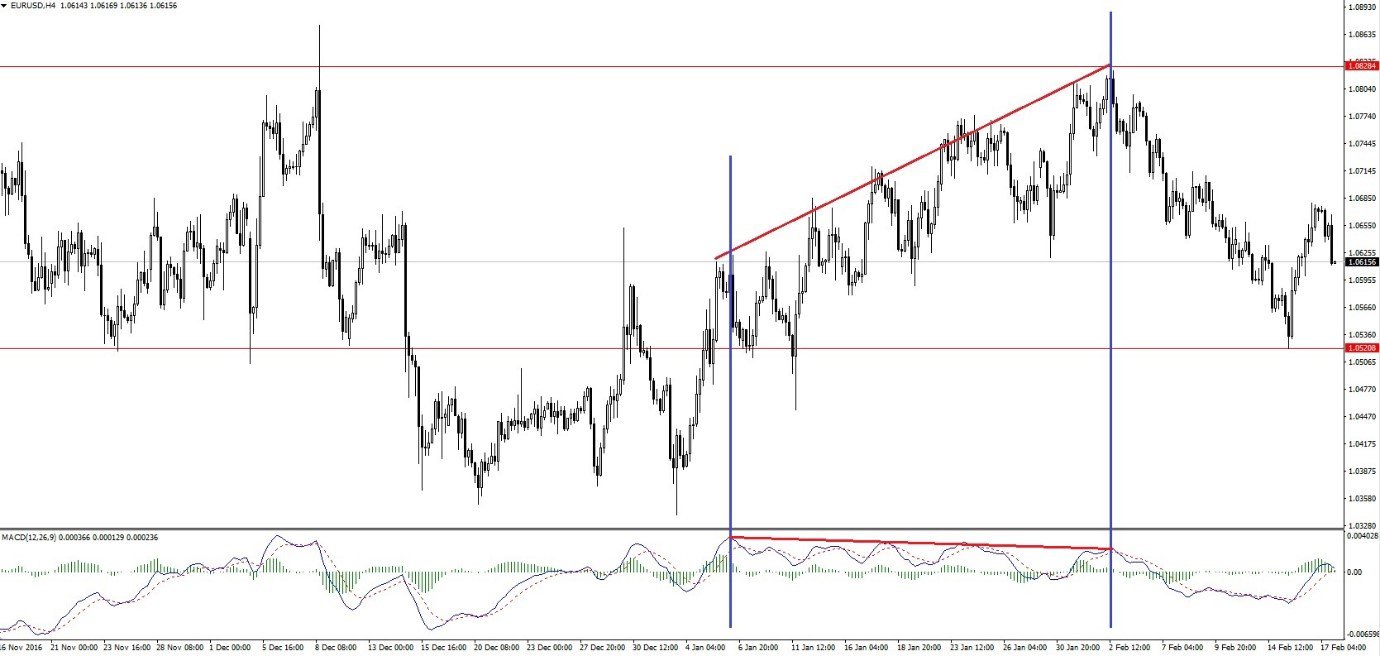
Now, here, there’s no doubt the bulls are flexing their muscle as you can see the price making higher highs every time. This is the only acceptable situation where market divergence can apply. Always draw lines on your Forex trading platforms to confirm that the lines are heading in the opposite direction. If the lines are parallel, then you know there’s no divergence. The lines are only a visual aid to help you identify the trend, after you get used to using divergence, you won’t have to draw the lines to notice a divergence. (Check out our Admiral Markets Trading Broker Insights)
Something else to remember is to confirm whether the crests of the oscillating indicator match that of the price on the main window. You can do this using vertical lines as I’ve done in the above screenshots. It might seem like it isn’t a big deal, but misalignment is not favorable to a divergence.
The secret here is accuracy. Most of those who claim that divergence doesn’t work have probably forgotten about precision – finance, and money are about precision. So, to recap, here are the conditions that have to be met to confirm divergence:
- higher highs in a bullish market
- lower lows in a bearish market
- matching crests between the indicator and price on the main window
Confirm the divergence using other clues
Never make a trade unless you’re completely sure about the information you’re getting, and this is done by finding a second opinion. For a trader, the second opinion should be a supporting piece of data, especially candlestick patterns.
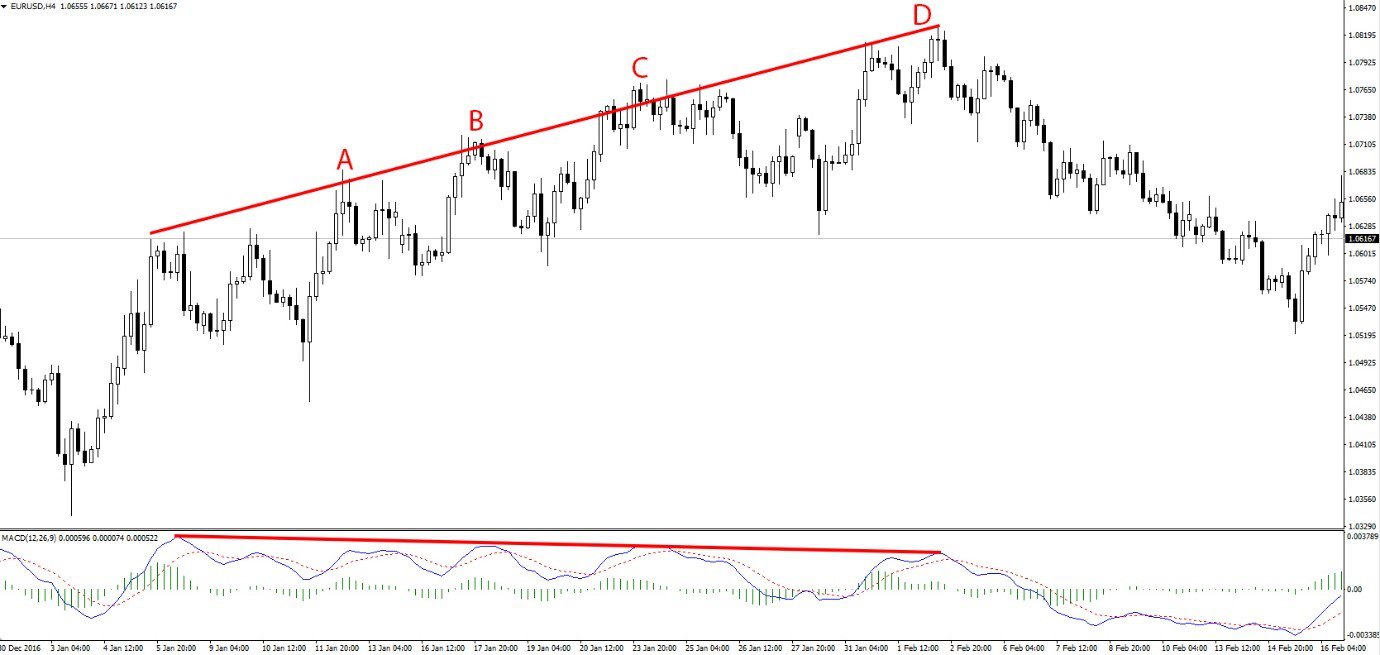
Above is a pair that has been on an uptrend for quite some time, consistently forming higher highs with every dip. On the other hand, the MACD indicator is showing the opposite, crests on the MACD have been forming lower lows every time, indicating the market is bearish. So, the problem becomes when to short the pair. (Check out: User Feedback on Exness Forex Trading Services)
If you had shorted the pair after the first sign of divergence, say, at point A, or even if you were a little patient to wait for points B or C, the uptrend would have stopped you. Markets do not move in a consistent upward trend, but with dips where market correction occurs. Then look at point D; you will notice a doji candlestick at the top of the crest in the main window. A doji candlestick is one of the most powerful candlestick patterns because it signals the exhaustion of the current market sentiment. (Look at Forex market sentiment indicators)
In this case, it shows that the bulls are over-extended and the market is overbought, this is where you short the pair. If you had waited, you would have caught at least a thousand pips, even 3000 pips if you were a long-term trader. So, the secret here is to wait for confirmation of the trend reversal. It’s not enough that there is a divergence because, as we have seen in the above example, a divergence can go on for days before the trend reverses. (Long-term vs. short-term trading)
Be patient
Some traders tend to become anxious when they realize they’ve just missed a divergence and try to enter a trade later than the divergence required. Sometimes, they get a smaller portion of the profits, and other times they end up making a loss as the newly formed trend also changes.
The secret is therefore to remain patient and wait for the right moment when the divergence forms. If you notice a divergence only after the trend reversal has occurred, move on to another chart and accept you missed that one. Besides, there are many other currency pairs to look at, so you should not try to force a trade or fall into despair.
Trading is all about patience, just like Warren Buffet advises:

Patience as a key component of the 10 steps of successful traders since back in the early 20th century by some legends like Jesse Livermore who said:

Do not feel like you have to place a trade every day or every hour, sit tight just like Livermore advises. Sometimes you can spend the entire day without placing a trade, but when you finally do the next day, it will be worth it.
Look for hidden divergence
Sometimes, divergence won’t pop out at you like in the examples above, it can be very subtle and hidden amidst the trend. In these cases, it can be used as a guide that the trend is still holding and not reversing. Take a look at this:
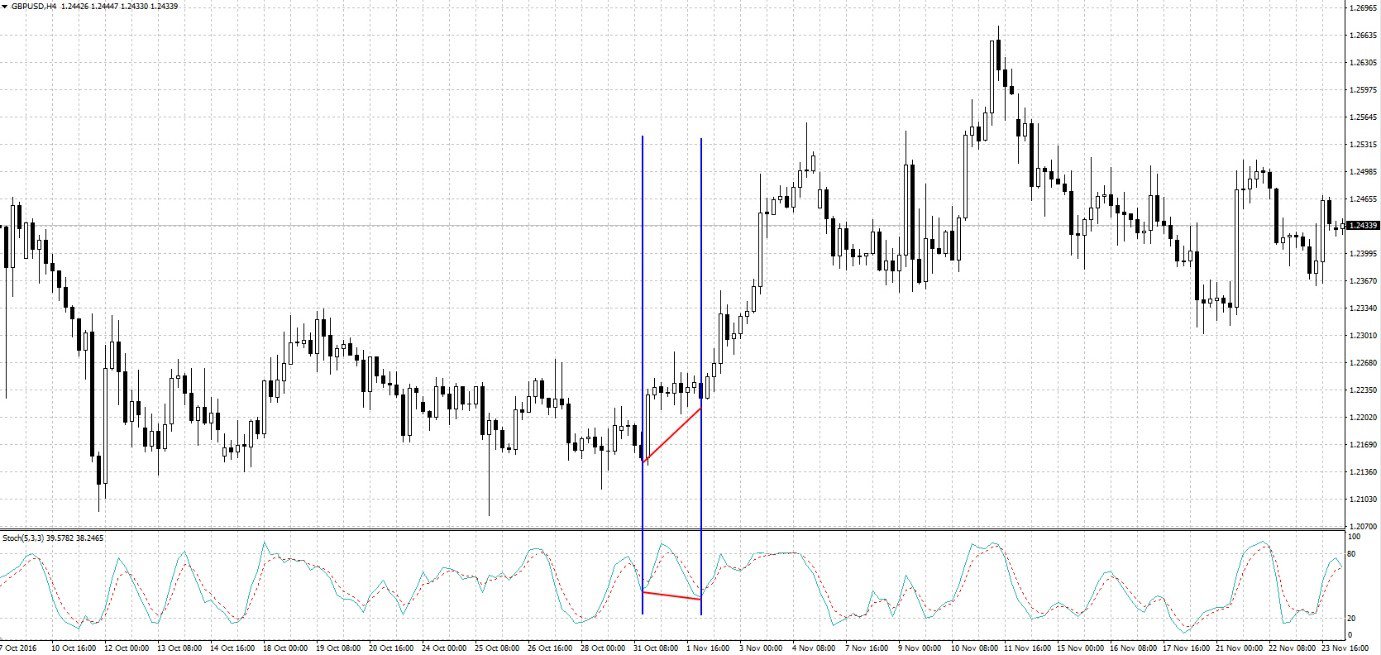
Here, there is a divergence because even though the price on the main window is forming a higher low, the stochastic indicator is showing a lower low. Normally, if the trend is about to turn, the indicator should be at the same level as the price. In the above situation, if the uptrend was about to turn into a downtrend, the oscillator should have moved higher to show the market was overbought. Instead, it moved lower, signaling that it is oversold, signaling a bullish sentiment. Surely, soon afterward the uptrend continued, even stronger than before.
It may take some time to catch these hidden divergences if you’re new to this trading strategy, but when you do, there will be a lot more opportunities to trade. Unlike the clear divergences discussed earlier, these hidden divergences are much more common and can be used to open numerous trades. (Learn how to create a trading strategy)
Furthermore, you can use these hidden divergences to determine where you are going to place your stop-loss orders and when to close the trade. Suppose you had an open long position in the above scenario, without the divergence, the horizontal movement of the markets would get you worried and you would have closed your trade. Use divergence therefore to confirm where you ought to close open positions because they can be used to confirm the end of a trend.
Practice
Like all other trading strategies, you have to practice how to use them on a demo account first before applying them to your live account. Divergences are especially tricky to catch because several factors have to come into place, and the only way to master these factors is to practice. There are also various types of accounts offered by Forex trading brokers you can use to practice beyond the usual demo account, and these will give you the actual feel of live trading. (Find out more about the various types of Forex trading accounts)
For more Top Brokers make sure you check out our XM Forex Broker Review and IC Markets Forex Broker Review.