The ‘holy grail’ system, just like any other indicator in Forex trading does not guarantee 100% profits, but it does make your trading career a lot more profitable. You should never expect a market where millions of traders participate to be predictable since every one of those traders has an independent view of the market. However, with a good trading strategy, it is possible to make lots of money.
This particular indicator was developed by a trader in Bengal who goes by the pseudonym of ‘Nihilist’, a day trader who has been very successful and is an active participant in various Forex forums and Forex broker real traders' reviews websites. We, too, have tried the system and found it to be profitable, which is why we’re even mentioning it on our website. Nevertheless, you will have to be very careful with the instructions and follow the steps if you want them to work for you. Afterward, you can make your changes to the system if you wish, but for now, here are the basics:
How the system works
The holy grail system is used to notify a trader of a possible trend reversal. Without the indicator, one would have to analyze all the previous candles to determine the pivot points, and then factor in candlestick patterns and whatnot, but this system does all that for you. It uses a ‘fractals’ system, which is an analysis of candlestick patterns to establish a likelihood of a trend reversal.
Indicators
The main indicator is found below the candlestick section and is represented graphically using vertical bars which are colored differently to indicate the direction of the markets. Below the main indicator are 5 smaller ones that signal points of trend reversals. These are:
- Nihilist_Ultra_Trend_V2
- Nihilist_Trend_Filter_1
- Nihilist_Trend_Filter_2
- Nihilist_Ultra_ADX
- Nihilist_Ultra_ADX_Dash_mtf
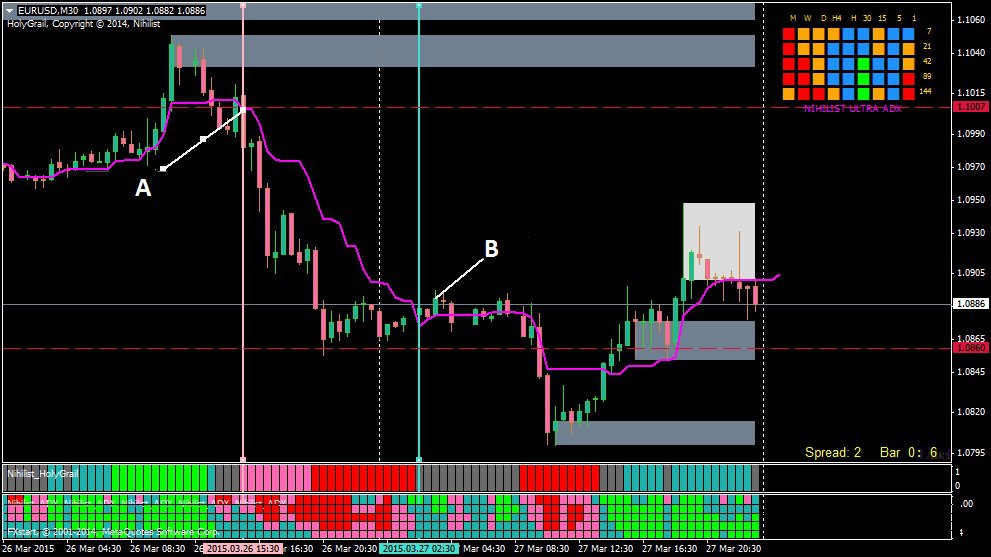
The Nihilist_Ultra_ADX indicator is the one on the upper right-hand corner of the trading window, it is represented by a set of squares in a rectangular shape. The vertical columns represent timeframes ranging from M1 (one minute) to MN (a month) while the horizontal rows represent the periods ranging from 7 to 144. The colors have the following meanings:
- Green – strong bullish trend
- Blue – moderate or weak bullish trend
- orange – moderate or weak bearish trend
- Red – strong bearish trend
You will also notice that candlesticks turn from their normal green-white hue to cyan-pink, this is due to the indicator Synergy APB. Finally, remember when I mentioned adding another indicator to complement the system? We’re going to use the kijun-sen, which provides an average of the previous high and low and is a very effective trigger line.
When to place trades
A buy order should be placed when the main HolyGrail indicator is green in color and the ADX window on the top-right corner does not have any red squares on the final column. One or two red squares there would still be fine, as long as the candle is still cyan. The last thing to look out for is the position of the candle relative to the kijun-sen, whereby you should wait until it closes above this trigger line to confirm an uptrend.

You can see above that the trader waited a little longer, and although they did lose a few pips, they still got most of the uptrend and made plenty of pips on the trade.
Conversely, a sell order should be placed when these indicators have the opposite colors: the HolyGrail should be pink or red – red would represent a strong downtrend while the ADX window should have mostly green squares on the final column. Make sure that the candle is pink in color this time, and wait until it closes below the kijun-sen before placing the order.
Again, you can see below that the trader waited until the candlestick was pink and below the kijun-sen before placing the sell order.
The reason behind the wait, until the candle crosses the kijun-sen, is for confirmation of market sentiment, a lot of traders don’t like to wait while they lose pips, but it’s important to exercise patience and caution. It’s better to lose a few pips in wait than to rush and lose a lot more. This is also why the strategy is not very appropriate for short-term traders, but long-term traders will benefit a lot from this wait.
At last, never forget about risk management, most importantly the stop-loss. The kijun-sen again comes in handy and you can use the previous flat of the kijun-sen to place the stop-loss above or below the sell or buy order. You won’t always need it, but you should always be careful. As for the take profit, you can use the kijun-sen again, and make sure to maintain at least a 2:1 profit-loss ratio, or simply use a trailing stop.
Factors to consider when using the system
Since the holy grail system works with fractals, it is usually combined with another indicator, preferably one with a high period gap. The reason is that sometimes candlestick patterns may point to a trend reversal, but the truth was that this was only created by a test in the market. Big players in the Forex market like to do this to make sure there aren’t enough opposite trades. Take, for example, a bullish trend, and one of the main buyers wants to make sure the trend continues, so they stop buying for a while and see if the trend changes. If it doesn’t they keep buying and the upward trend continues, but there will be a slight gap in the Forex charts online. The higher period indicator will keep a trader in such a situation from falling for the fake reversal.
This system is also most effective in higher timeframes; of course, anyone can still use it at any timeframe, but it is most effective at M30 and above. This might leave out those who make money by scalping but still leaves swing traders feeling very happy. The best trading time is during the London session when all regions worldwide overlap. These moments of metaphorical handing over create volatility as traders react to news announcements and there is usually a higher probability of trend reversals.
After installing, it’s best to leave it with the default values of periods and color, since these are the values that have been proven to work. After you’re fully familiar, with an expert trader, feel free to play around with the figures to suit your particular trading style. If you’re having trouble with the colors, you can load the holy grail template by heading to ‘Charts’ on the menu bar, moving down the drop-down menu and hovering over ‘Template’ then selecting ‘Load template’. If you properly installed the provided indicators and template, you should find the ‘nihilist_holygrail’ template in the next window; now just double-click and you’re good to go. This will automatically add all indicators and switch your color theme.
Go there and earn pips!
With the knowledge, you have now, go ahead and install the indicator on your reliable Forex trading platforms and give the system a try. I also know I keep saying this over and over, but you should never attempt any new system without first trying it on a demo account. A hammer is only useful in the hands of a carpenter, so until you’re completely familiar with the system, you’re only going to lose.