 Alpari
 XM
XMWe have already covered the basics of pivot points, but now it’s time to learn about how to include them in your trading strategy. Briefly, a pivot point is a level around which the value of the currency will tend to shift direction.
To include pivot points in your trading strategy, you will need to include the primary pivot point together with at least one level of support and one of resistance. The level of support will be a level where prices bottom out and begin to rise again, while the level of resistance is the opposite, sort of like the ceiling in value. Also, don't miss checking all you need to know about pivot points.
Once you have all these values mapped onto the Forex trading platforms, you will have something like this:
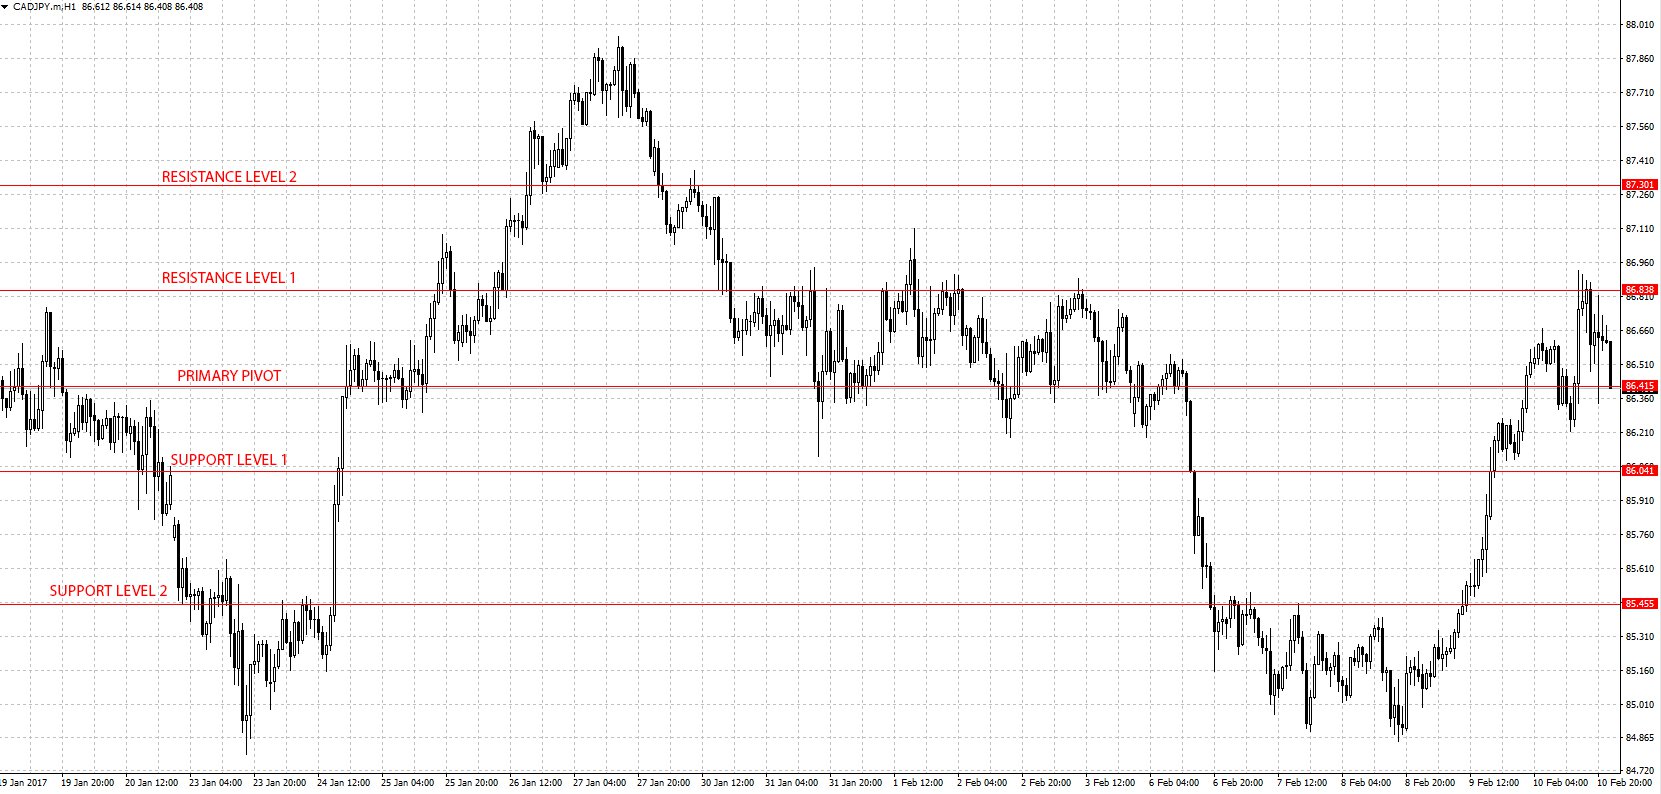
In the above example are 5 pivot points with the primary pivot at the center and 2 pairs of opposite support and level of resistances. You can also observe how trends tended to either slow down or reverse direction at these points, and this is why traders rely on them.
How to use the pivot points strategy
Now that you understand the concept of pivot points, let’s see how you can put it into practice. There are 2 ways in which you can make use of pivot points – trading breakouts or within an oscillating pattern.
Trading the breakouts
Once the value of a currency has reached a pivot point, it might break through it and create a new trend, this is called a breakout. It happens when a level of support is crossed downwards and vice versa after some resistance at the pivot point level. Breakouts occur when there is a significant change in the economy of a country, perhaps after the release of significant economic news on the economic calendar Forex. When the news is strong enough, a pivot point can be broken.
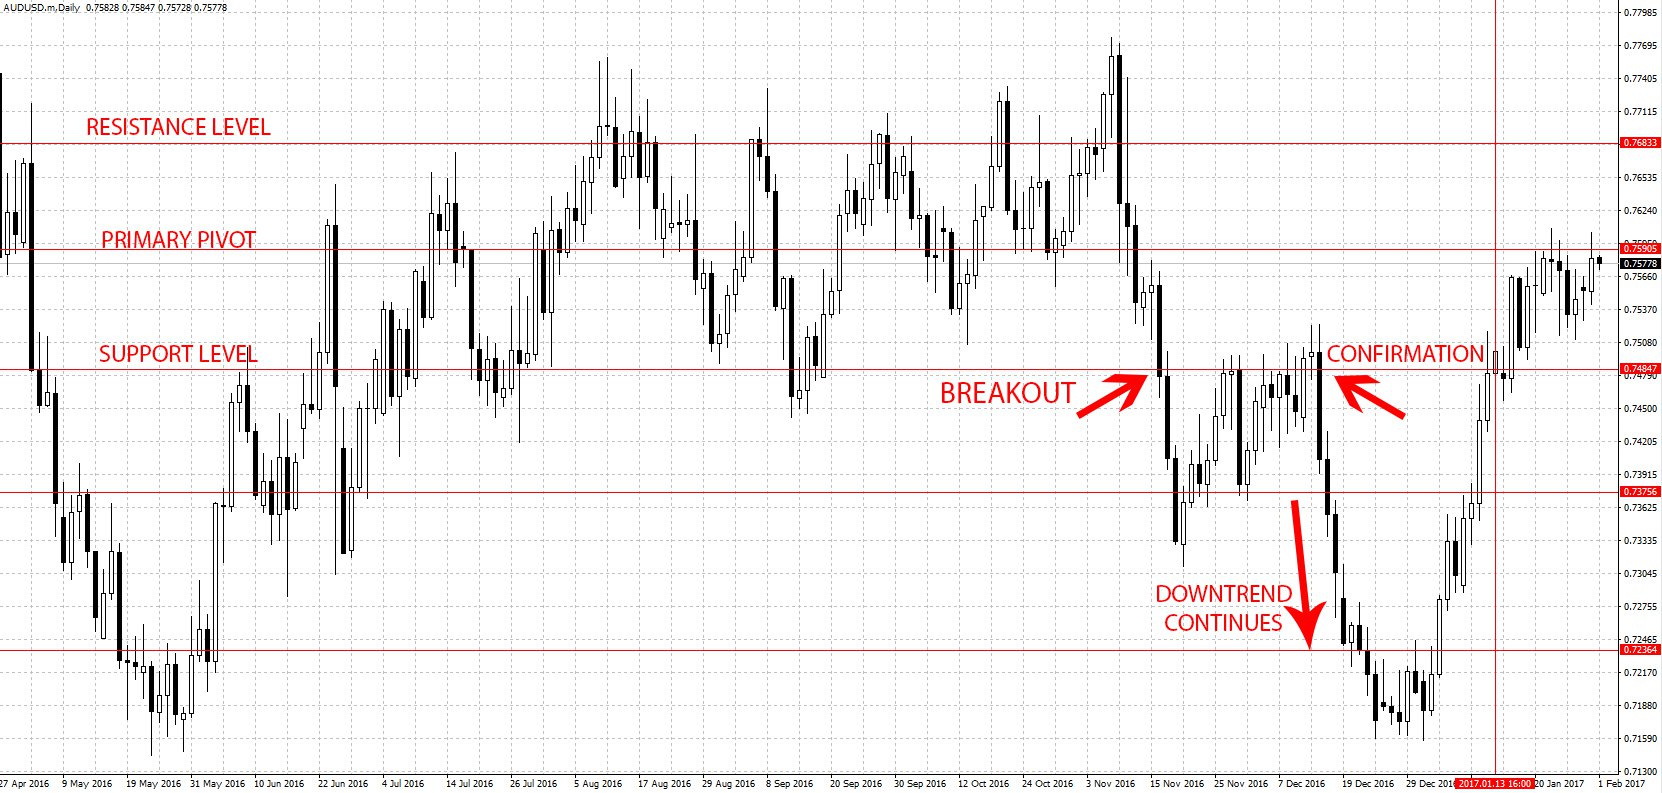
In the discussed scenario, the Federal Reserve's decision to increase interest rates to 0.750% triggered a breakout. Prior to this announcement, the AUD/USD pair was trading within a certain range. The news strengthened the US dollar, breaking through a key level of support. Despite this, prices rebounded to this support level, which then became a point of resistance, leading to a continued downward trend.
Subsequently, the pair encountered another support level, which it couldn't fully breach. The price began to move sideways, displaying an oscillating pattern, until negative news about US 10-year bond yields sparked an uptrend. However, it's noticeable that previous pivot points remained intact, with prices returning to range-bound trading.
At this juncture, traders are likely watching for a breakout at the primary pivot point. A breakout would be confirmed if a candle closes above this pivot. If the opening candle of the next session also closes above the primary pivot, it suggests a potential uptrend, prompting traders to consider long positions. Conversely, signs of a reversal would indicate that the pair is still in an oscillating pattern, making the upcoming session critical for further insights.
Trading an oscillating pattern
When a currency pair is oscillating between support and a level of resistance, it begins moving in a horizontal pattern – bouncing off these pivot points. As long as the economies of the countries the currencies represent remain stable and there’s no factor to change that, this is the pattern the chart will adopt. Forex charts will never be completely flat, but will instead oscillate around the pivot point to reach the support and level of resistance.
Identifying such a trend using pivot points can be extremely useful because you can place short trades when a level of resistance is reached and long trades when a level of support is reached. It may require more activities compared to riding a long-term trend, but it’s still valuable. (Learn more: Exness Regulatory Compliance and Security Features)
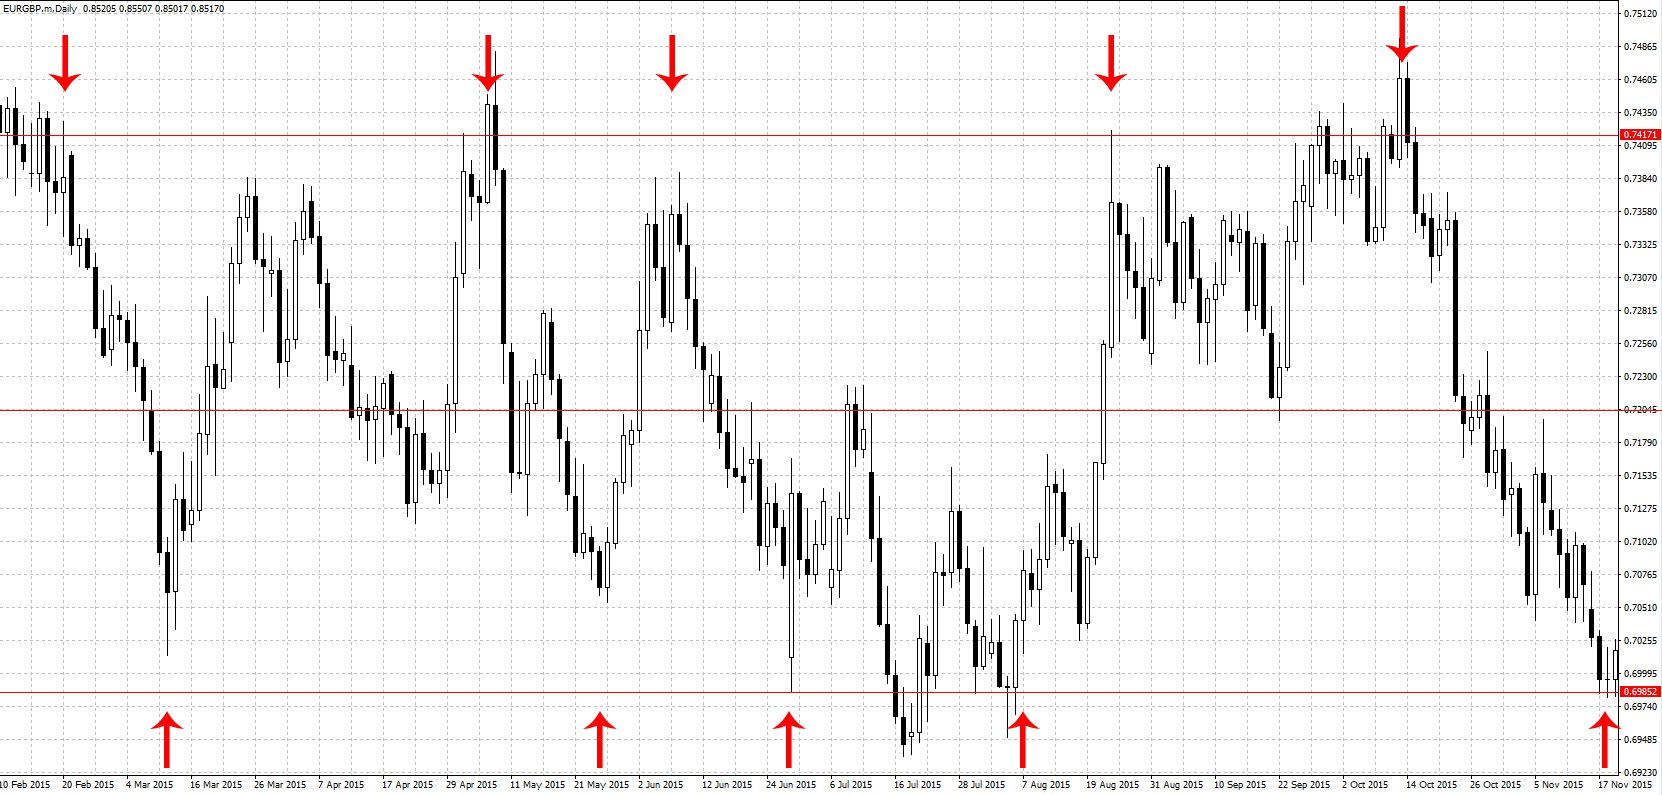
In the oscillating pattern above, you can see the EUR/GBP oscillate between 0.7417 and 0.6985 and the primary pivot around 0.7204. Once the price reaches either a support or level of resistance and then shows signs of exhaustion, this indicates a reversal.
Placing stop losses and taking profit levels
Besides just deciding when to enter a trade, pivot points can also be used to determine when to exit trades. As you know, risk management is very important in trading the Forex markets, so you should look ahead.
In the example directly above of an oscillating pattern, the price has down to the level of support and there are signs of a reversal. The pivot point strategy suggests that you take a long position, but where to put the rest? Ideally, the perfect stop-loss level would be at the next level of support, but that may be too far. If you want to be cautious and minimize losses, the previous low would be the stop-loss point, which would be the level at which the previous candle closed.
For your take profit, you want the first target to be the primary pivot point, if this level is crossed then the level of resistance would be your 2nd target. You should therefore adjust your stop loss manually according to the direction of the markets so that you ensure you make the most out of the trade. We’ll see how this trade would have played out in the final section of this post.
Precautions when using the pivot point strategy
Despite being so useful and easy to use, it is important to keep a few things in mind when using the pivot points strategy:
Wait for confirmation
Pivot points will get tested by the markets, and you should be careful not to be caught in a fake-out. A fake-out is when a pivot point is temporarily broken through, only for it to hold and reverse the trend.
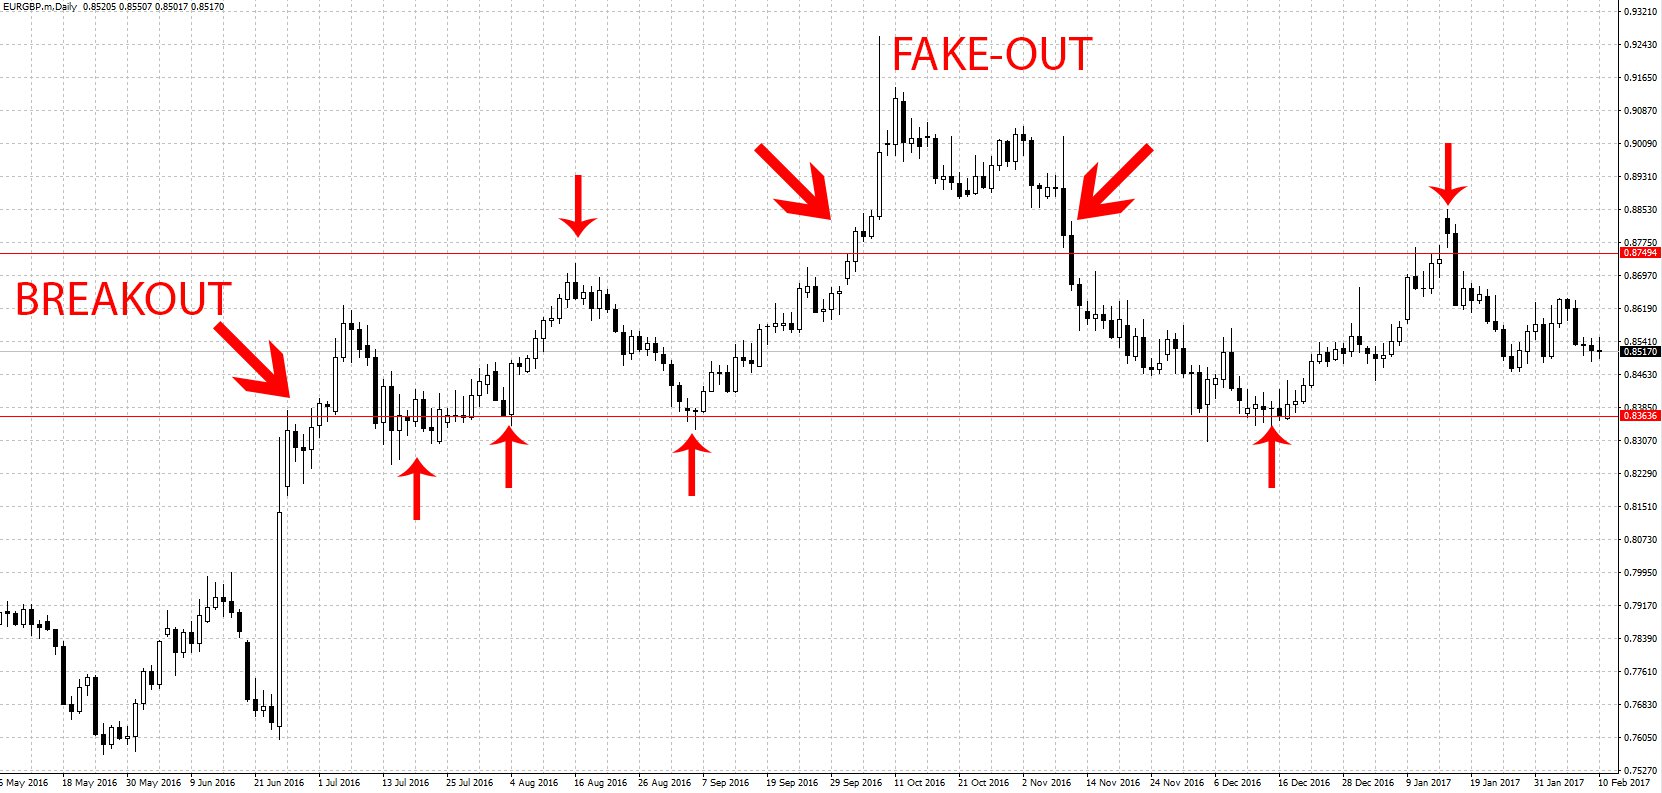
The breakout in the above example happened as a result of the Brexit poll. After the ‘Yes’ poll came through, the euro became very strong against the pound, and the level of resistance around 0.8363 was broken. After the level of resistance was broken, it became a level of support, from where the price of the EUR/GBP bounced off and never came back. As you can see after the level of resistance was broken, the price came back down as if it were a fake-out, but after some testing, the level of support was proven.
To avoid fake-outs, wait until the trend is confirmed. This would involve waiting until a few candles close above or below a pivot point before confirming that the pivot point has been broken. Of course, if the pivot point has been broken, you might lose a few pips as a result, but it’s better to err on the side of caution. Using technical indicators in combination with the pivot points will also be useful in determining market sentiment and judging whether the trend is about to be reversed. (Which are the best technical indicators and how to use them?)
Another way to confirm the reversal of a trend is by using candlestick pattern analysis. In the section above when we were looking at risk management, the EUR/GBP pair had reached a level of support and we intended to take a long position. To confirm this decision, we looked for signs of reversal, and the main one was the doji candlestick on the 18th of November 2015. Besides, the candlesticks’ bodies never crossed the level of support, showing signs of exhaustion. This is how the trade proceeded:
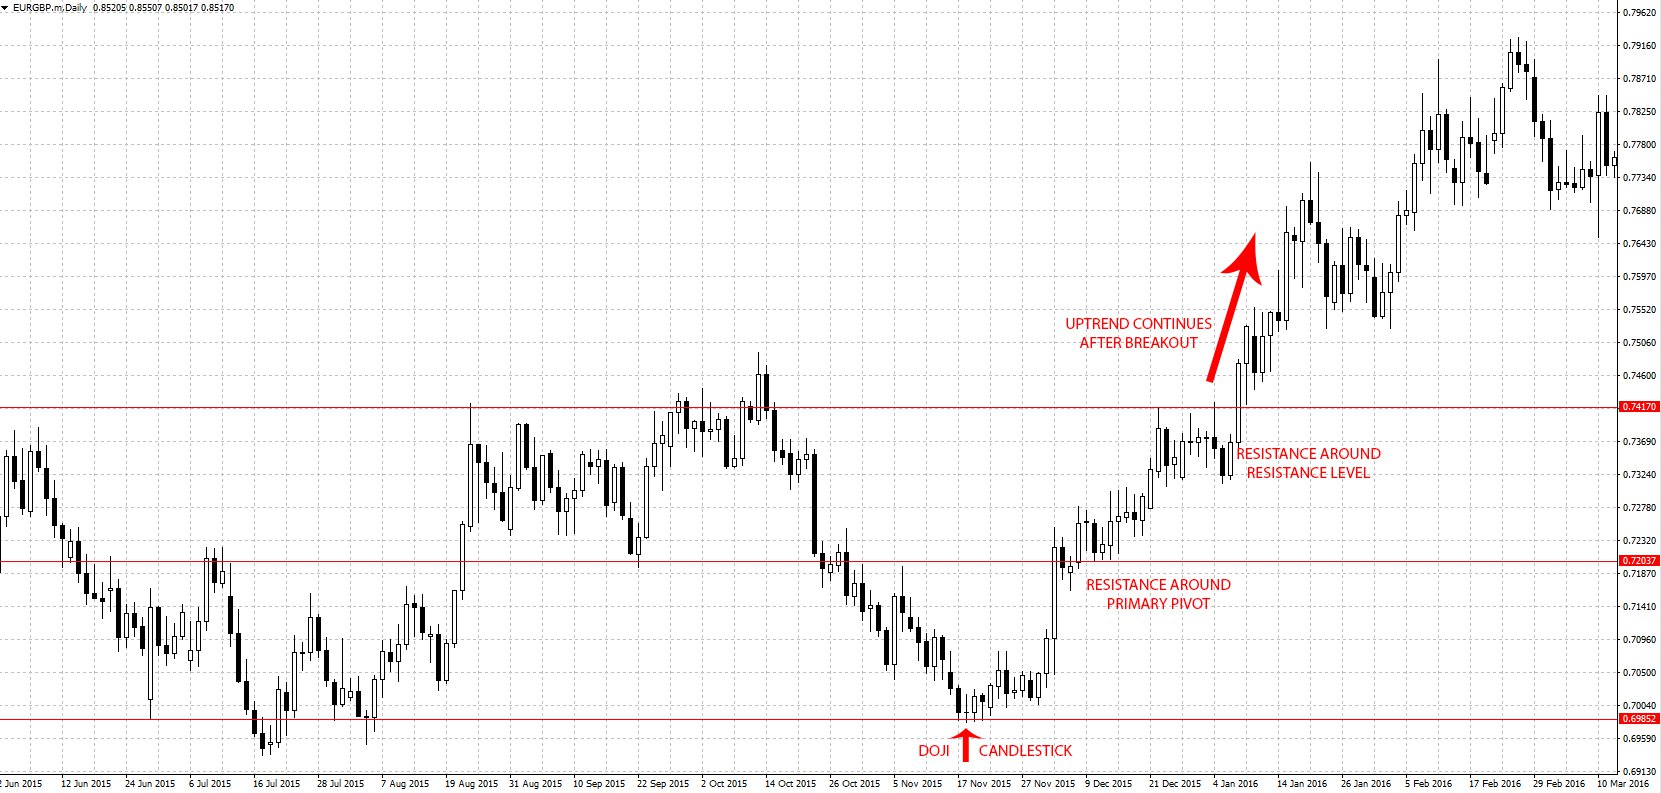
The downtrend reversed around the level of support and went up. A cautious trader would have stopped the trade at the primary pivot, but a swing trader would wait. After a bit of resistance, there was a breakout signaled by another exhaustive candle until the first level of resistance. There was even more resistance here, but the engulfing candle on the 6th of January 2016 should have indicated bullish sentiment, which was right. The uptrend continued up to the second level of resistance.
Use longer timeframes
Pivot points will represent potential support and level of resistance where the value of a currency will tend to stall. However, on shorter timeframes like the 1M, 5M, and 15M timeframes, pivot points are often broken because resistance is weak. The shortest advisable timeframe to use on a pivot points strategy would be the 1H chart. Even then, this would only work for very short-term trades, like those scalpers used to make money.
For better accuracy, it’s best to use the daily and more preferably the weekly timeframe to draw the pivot points. Swing traders will make use of the latter to capture long-term trends, and day traders can use the daily pivot points. (Read more about Long-term vs. short-term trading)
The levels will not be the same for everyone
When drawing up pivot points, no 2 traders will arrive at the same value for the level, but it will most likely be around a certain level. This is because some traders will look at the wicks of the candlesticks, while others will only focus on the body of the candle. Several other considerations will go into the decision-making, and these reasons will become different from one trader to the next. As such, you should not expect to find a single level at which all traders will place their pivot points.
(Check out live Forex quotes to see how currency pairs are performing right now)

If you’re not sure how to draw pivot points from the candlestick charts, switch over to the line charts. They have more defined points of support and resistance and make the drawing of pivot points a lot easier. If you're interested in learning more, we recommend you check out our in-depth FXPro account types overview.
or more Top Brokers make sure you check out our XM Forex Broker review and our Review of IC Markets Services.
Learn how a pivot point strategy can be used to trade trending markets in this short video:
For more Top Brokers make sure you check out our XM Forex Broker review and our in-depth Review of IC Markets Services.