The initials PVSRA stand for price, volume, support, and resistance analysis. It is more of a system of trading, this than other straightforward Forex trading strategies we have covered before. Being a trading system, it will require a good understanding of the principles behind it to know how it works.
The indicators are just a bonus, making it easy to identify the PVSRA tools, but the underlying principle will be the most important. As such, it may take some time to know it fully, but you will be happy you took the time when you finally do.
Principles of the PVSRA trading system
The main idea behind the PVSRA system is that the Forex markets cannot be understood through logic or math. It is a market with thousands of minds responding uniquely, therefore, making it virtually impossible to break down the entire market. However, there are certain facts that most traders know, like how little retail traders like ourselves affect the market. The image below shows the parties participating in the Forex market:
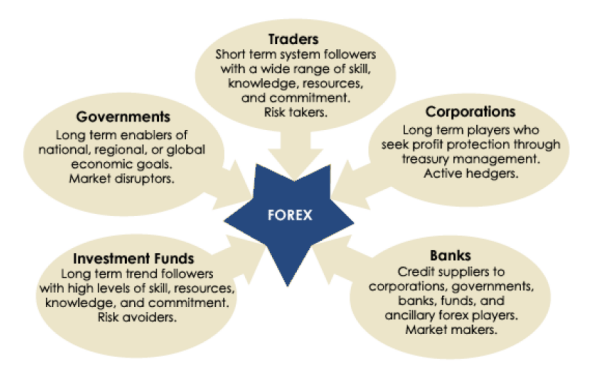
As retail traders, there is very little we can do to change the market prices, but larger players like hedge funds and banks can. There have been cases in the past where institutional traders have been prosecuted for colluding to move market prices in their favor. But, that’s a story for another time. We can keep complaining about how unfair it is, or we can take advantage of it. That is exactly what the PVSRA trading system does. (Forex market sentiment indicators)
The next principle of the PVSRA system is in the study of trading volumes. We may not be able to tell in which direction the markets are moving, but Forex companies can determine the amount of volume depending on the number of orders coming through. Banks offering Forex trading are in an even better position since they are sometimes working with Forex brokers as liquidity providers. If such a bank serves multiple brokers, then they can have very accurate information about the trading volume.
Nevertheless, even the most popular ECN Forex brokers can have as many clients to have a good enough idea. It’s all about taking a sample here, as no one can tell the trading volume in the entire market. Anyway, you don’t need to know the exact direction the trading volume is directed, and basic knowledge can let you know of a possible breakthrough. For example, if markets have been trading within a range for a while, and there is a sudden rise in trading volume, you can correctly deduce that a major market shift is about to occur. If it happens around a support or resistance level, there’s a chance of a breakout. (How to draw S/R levels like a pro)
Speaking of S/R levels, that is another vital principle of this system. The S/R levels act as points of consolidation, where traders are either covering their positions or opening new ones in anticipation of a breakout. These areas are usually around prices with zeros at the end, or halves and quarters. Why is that? Because people don’t usually place pending orders at unique numbers like 1.23987; it’s much more likely to have pending orders around 1.24000 than the former. When many of the pending orders and stop losses or take profits are activated, this can create an S/R level, where prices consolidate, waiting for a push in either direction. When you identify the S/R levels, you can decide the ideal entry and exit points for your trades. (Breakout trading strategies)
To decide whether the S/R levels represent long-term or short-term consolidation levels, we will also need to look at them from different timeframes. When the consolidation level occurs in higher timeframes, it can be a starting point for a longer trend and vice versa. Depending on whether you prefer to trade for shorter or longer periods, it will be important to know this nonetheless. (Long-term vs. short-term trading)
So, to recap the PVSRA principles:
- Determine when prices consolidate around critical S/R levels
- Use different timeframes to tell the strength of the consolidation levels
- Determine when there is a decrease/increase in trading volume
- Combine the position of the consolidation level and the increase in trading volume to decide where market prices will move
These are the basic principles of the PVSRA system, and if you can master them, then you should be able to trade any timeframe you prefer and whatever market you like, whether Forex, stocks, commodities, etc.
Technical indicators for the PVSRA system
As mentioned before, we’re going to use a few indicators to establish the basic principles of the trading system. These are custom indicators that have been modified specifically for this trading system, and you will be able to download them through the link at the bottom of the page. There are only six of them:
Trade levels
The MetaTrader 4 trading platform will display its indicator to display all open and pending orders within the Forex trading platforms on the main window. However, it will only be a single line showing the point at which the order was opened, and no other clue. The trade levels indicator will do this for you, showing you additional possible positions to enter your take profit and stop loss orders. Other platforms like cTrader may do this automatically, but the MT4 platform does now. That is the function of this indicator, and it will only show up after you have placed a trade.
Access Panel
The first window of this indicator will be at the top-left corner of the main trading window, showing the various times in different regions. We know that trading volume increases at the start and toward the end of a trading day in any time zone, and this part of the indicator lets us know the time in different areas. For example, a trade involving the AUD/USD will be most volatile when Australia’s and the US's trading session is open.
The next part will be the trading levels, which combine daily and weekly highs and lows; important for deciding if the trend may continue. Then there are pivot points plotted throughout the charts which tell us of possible consolidation levels. Finally, our Fibonacci levels also tell us about consolidation levels.
FFCAL panel
This indicator alerts us to upcoming events on the Forex calendar. To enable it to do so, you will need to ‘Allow DLL inputs’ when you are adding the indicator to the real-time Forex charts.
Trend suite
It provides the moving average, although slightly modified. By default, it will be a 50-period EMA, but you can change the period yourself to suit your trading style. (How to choose a trading strategy?)
Candles suite
It paints the candlesticks red, green, blue, and grey. Red and purple represents bullish momentum, green and blue show bullish momentum, and grey for consolidation. A pop-up window will appear when there is a color change in the candles, alerting you to trading opportunities.
Volumes suite
This one will be at the indicators window, showing price-volume analysis (PVA) bars and standard volume bars. The PVA bars will be colored in red, blue, and green corresponding to their meanings in the candles suite indicator. Standard volume bars will be grey.
Working the PVSRA trading system
Let’s look at a trading chart for clues to see how the PVSRA system works:
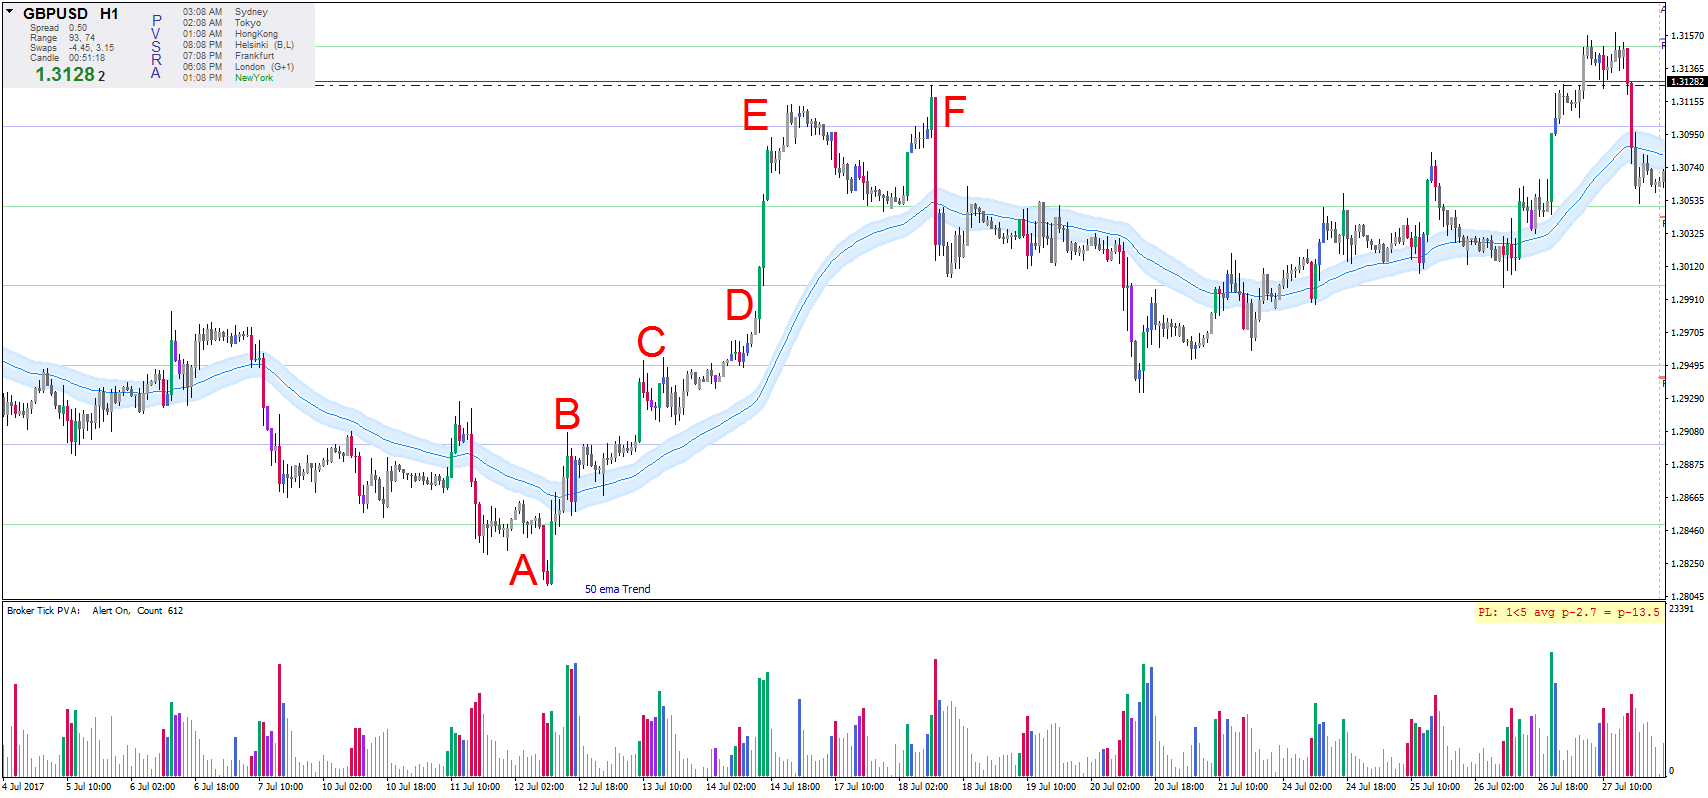
Starting from Point A, the markets had been in a downtrend, and there was even a break below a support level. The break didn’t last long, though, and the markets began to rise. The rise at Point A can be seen from the volume suite indicator when the PVA bars turned from red to green. However, this would not have been a good trading opportunity because markets were below the trend suite indicator and the access panel had a resistance level above the prices.
A better entry point would have been at Point B when markets had broken above the access panel resistance level and the trend suite EMA. See how the PVA bars in the volume suite indicator were long and green, then blue? This was a sign of the major market players increasing trading volume and moving the markets in their direction.
A short-term trader might have closed the trade at Point C when the candles suite turned grey, signaling consolidation, which would have been fine, but a long-term trader would observe how prices were still above the trend suite EMA and held on. A good sign of a trend reversal is when the candle's suit turns red and the volume's suit does the same. Since neither of these happens at Point C, you could have held on until Point E.
Point F was a sure trend reversal when prices went below the trend suite indicator, and the volumes suite showed a tall red bar – all signs of bearish sentiment. You will also notice that there was very little trading volume starting from Point E, showing that the bulls were no longer interested in the prices going higher.
That is it for the PVSRA system. It is indeed a very simple system once you understand how to read the signs. If you want to know how to formulate your trading system, listen as an expert explains it: