 Alpari
 XM
XMAfter reading through various Forex training materials, including this website, you will likely face the term ‘pivot points.’ By now, you may already know a little about what they are. For anyone who still doesn’t know exactly what pivot points are, here it is:
So, what are the pivot points?
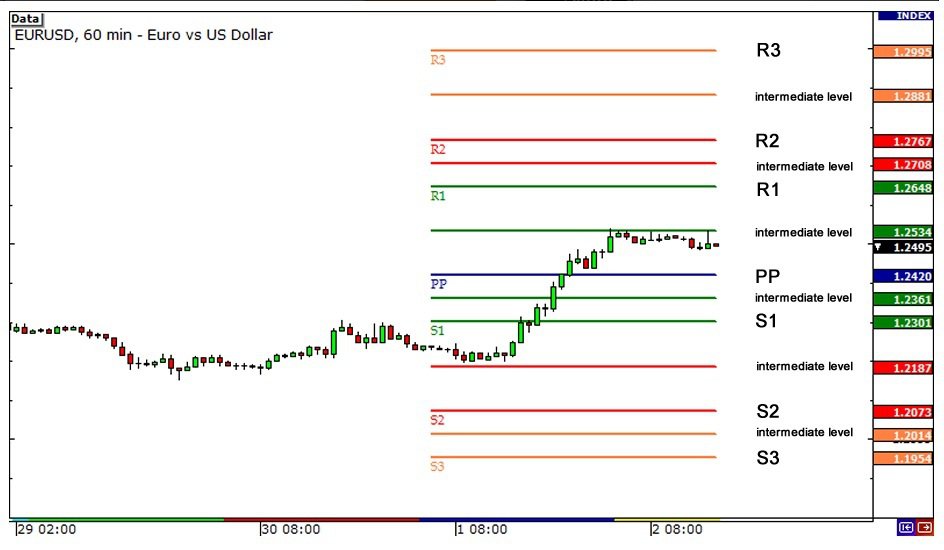
These lines drawn on Forex charts help the trader identify potential support and resistance levels. The support level is sort of a lower limit where the value of a financial instrument has difficulty going below, and it requires a significant pull like a critical news announcement to shift market sentiment and break this level. The resistance level is the opposite and represents a point where the value of an instrument has trouble going above. The figure below illustrates these levels graphically; you can see how the candlesticks bounce off them. (Check out: Explore LiteForex Trading Instruments and Spreads)
Pivot points include one or two support and resistance levels and an additional primary pivot between these levels. In Forex trading, pivot points inform the trader of the range within which the markets will oscillate, allowing you to plan your entry and exit points. We’ll look at how these pivot points are used in trading, but for now, know that pivot points are the lines representing the levels described above.
How are pivot points calculated?
Unlike other indicators, pivot points are not always generated automatically by the Forex trading platforms but are calculated by the user. Don’t worry, it’s not very difficult, and the rewards will be worth the extra effort. First, there are different types of pivot points with various purposes; therefore, calculating the pivot points will depend on the type of pivot point used. Second, you will need to understand a few terms used in the formula, and these are:
- PP – the primary pivot, the one in the middle
- H – the highest value reached in the previous period
- L – the lowest value reached in the previous period
- C – the value of the financial instrument when the markets closed
- S & R – support and resistance levels. There are usually 2 of each, sometimes more, so these values are represented as S1 and S2, R1 and R2, and so on
- O – today’s opening price
- C – today’s closing price
Now, let’s look at how these pivot points are calculated according to their type:
Standard pivot points
This is the simplest form of the pivot point and the most widely used by traders. The calculation method is also quite simple and uses a 5-point system to represent the primary pivot, two support levels, and two resistance levels. To calculate these levels, use this formula:
- PP = (H + L + C) / 3. It’s the average of these values
- S1 = (PP x 2) – H
- S2 = PP – (H – L)
- S3 = L – 2(H – PP)
- R1 = (PP x 2) – L
- R2 = PP + (H – L)
- R3 = H + 2(PP – L)
The formula above is the most widely used and the simplest, as you will see soon. Still, some traders modify the formula for calculating the primary pivot by including the opening price of the current trading day. This changes the PP formula to:
- PP = (O + H + L + C) / 4.
Again, it’s just an average of the four values, and since the other values are derived from the PP, the rest of the formulae remain the same. When these pivot points are drawn on the charts, they appear as seen in the figure below.
Fibonacci pivot points
On a chart, both the standard and Fibonacci pivot points look the same, but their calculation method is different. They both start the same, from the primary pivot point, but that’s where the similarities end:
PP = (H + L + C) / 3.
S1 = PP – [0.382 x (H – L)]
S2 = PP – [0.618 x (H – L)]
S3 = PP – [1 x (H – L)]
R1 = PP + [0.382 x (H – L)]
R2 = PP + [0.618 x (H – L)]
R3 = PP + [1 x (H – L)]
At first glance, they look similar to the standard pivot points on a chart, but you may notice that the values will vary from trader to trader. This is because, unlike common pivot points developed from fixed values, the previous high, low, etc., Fibonacci pivot points are more subjective and will depend on the trader’s trading strategy.
Demark pivot points
Thomas DeMark is a famous trader who is best known for developing various trading indicators, and he also developed his formula for calculating pivot points. His method is a bit different from the others and introduces a different variable, X:
If C < O, then X = today’s high + today’s close + (2 x today’s low)
If C > O, then X = today’s low + today’s close + (2 x today’s high)
If C = O, then X = today’s high + today’s low + (2 x today’s close)
Therefore, pivot points for the following day would be:
PP = X / 4
S1 = X / 2 – today’s high
R1 = X / 2 – today’s low
As you can see, DeMark’s formula for calculating pivot points is vastly different from the other formulae. Still, you’ve got to assume that DeMark knows what he’s doing, given how successful he is as a trader. Besides, it doesn’t hurt to try something different, and you might even like his formula.
Other types of pivot points
There may be other pivot point formulae, but these are the most common. Even if there are others, it’s not advisable to use them; pivot points are only effective if many traders use them. Like fiat money or currency, it only has value if many believe in it. Therefore, since most traders use the above pivot points, the support and resistance levels become a self-fulfilling prophecy because traders act on this information. This is also why the Demark pivot point system is unreliable and unpopular.
For this reason, you would want to have the same values for your support and resistance levels as every other trader out there, making timing crucial in determining the opening and closing prices.
Timing
The Forex market is a 24-hour market, so how do you tell when the markets have closed? The universally agreed upon closing and opening times are those of the New York (NYSE) trading session that opens at 9:30 a.m. and closes at 4:00 p.m. Eastern Standard Time (EST). To get these figures accurately, you can calculate from your local time or adjust the trading platform to use the EST system.
Furthermore, the pivot points will vary depending on your timeframe. If you use smaller timeframes like the 1, 5, 10, and 15-minute charts scalpers use to make money, your pivot points should be calculated from the daily timeframe. Using 30-minute and 1-hour charts, your pivot point values should be derived from the weekly charts. Finally, if you’re a long-term trader using the daily charts, you must create pivot points from the monthly charts.
How to use pivot points
It may take some time to set up your pivot points before you can use them, but after you’re done, you will realize they are straightforward to use and can provide you with excellent information about the markets.
Setting entry and closing points
The most important decision is deciding when to enter a trade, but these pivot points can help. For example, if the value of a commodity is falling and is approaching a support level, this could signify that the markets are about to bounce back up, and you could place a ‘buy’ order at that point. On the other hand, resistance levels indicate that the value may start falling, which tells you to place a ‘sell’ order.
After you have placed your order, you should set your take profit at the opposite pivot point. If the markets bounced off S1 and started rising, your take profit should be at the primary pivot.
Risk management
In addition to knowing when you will place a trade, you need to know when to close a losing position. Deciding where to place your stop loss can be difficult, but pivot points can help. We now know that pivot points present points at which the market momentum may reverse, so if you have an open position, you can place your stop loss near a pivot point. That way, you can avoid being caught in the red when the markets move against you suddenly.
What to remember about pivot points
They are only guidelines
Pivot points only represent potential support and resistance levels, but they don’t necessarily mean that the value of a financial instrument cannot go beyond these pivot points. In light of this, it is usually better to be conservative and wait until you see a definitive sign that the markets will bounce off a pivot point. Such a sign is presented when a candlestick closes below a resistance level or above a support level.
They are not independent
Since pivot points can be helpful, they aren’t very effective when used alone. Trading requires confirmation from another indicator to avoid fake break-outs or reversals. The same is valid with pivot points, and you should also use another indicator, like the relative strength index (RSI) or stochastic indicators, which show you if a commodity has been overbought or oversold. Remember to watch the Forex calendar because critical news announcements can render the pivot points unreliable.
They remain fixed
Once you have all your pivot points drawn out, they remain fixed for the entire trading day, and you should wait to alter the values until the trading period is over.
To recap, here's a short video about pivot points: