 AXITrader
The zig-zaging moves of the forex market have confounded traders since the beginning of exchanges. While some dismiss technical analysis as no better than reading tea leaves, the Gartley pattern has demonstrated that methodical analysis of price action can reveal high-probability trading opportunities.
First documented by Harold McKinley Gartley in his 1930s book Profits in the Stock Market, the Gartley patterns built on existing principles of Fibonacci ratios and chart pattern analysis.
Gartley aimed to solve the perennial questions of trading: what and when to buy and sell.
His insights into market psychology and crowd behaviour allowed Gartley to identify recurring chart formations that preceded major price swings.
Though originally designed for stocks, the versatility of the Gartley pattern soon attracted forex traders. Now a staple of technical analysis, the Gartley pattern comes in bullish Gartley and bearish Gartley versions, with defineable swings and retracements. Trading books extol the Gartley’s reliability in calling harmonic moves in advance. With pattern recognition software, Gartley formations are easy to identify on charts.
Yet as with any trading strategy, the Gartley harmonic pattern is not a crystal ball but success requires adaptations for current market conditions, risk management, and honing entry and exit techniques. This article covers time-tested tweaks and best practices for trading the Gartley pattern across forex pairs and stock indices.
What is the Gartley Pattern in Forex
The Gartley pattern is a special type of harmonic chart pattern that helps traders identify potential reversal points in the forex market, but it’s both a retracement and continuation pattern. It is based on Fibonacci ratios and was introduced by H.M. Gartley in his 1935 book “Profits in the Stock Market.”
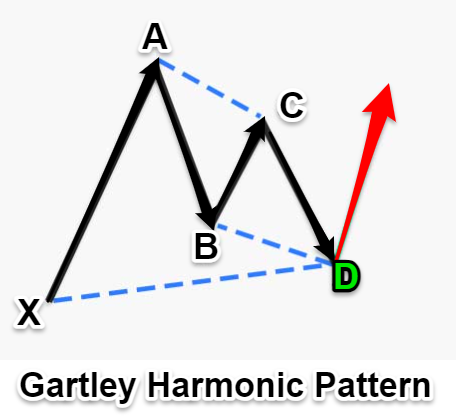
Like other harmonic patterns, the Gartley is a 5-point reversal pattern that has specific Fibonacci retracements between each point. The pattern starts at point X and moves in a zigzag fashion to points A, B, C, and finally D with the final point, D, marking the potential reversal zone where the price could change direction:
- For a bullish Gartley pattern, point D will be a lower low compared to point B. This sets up the potential for the price to reverse higher off of D point.
- In a bearish Gartley, point D is a higher high relative to B, signaling a potential top and reversal lower.
Traders watch for Gartley patterns to form on the charts, especially on key support and resistance levels. The pattern provides an early warning for potential long or short trading opportunities at points C and D. When confirmed with other indicators like price action, volume, or momentum oscillators, the Gartley pattern can improve the odds of catching a reversal in the forex market.
How to Identify the Gartley Pattern in Trading?
Since the Gartley is a harmonic pattern, its swings must adhere to specific Fibonacci levels and ratios in order to qualify as a valid formation. Use the following rules for identifying the Gartley pattern:
Rules of the Gartley Pattern
- XA leg – The XA leg can be any price movement with no Fibonacci requirements. This sets up the initial trend.
- AB leg – The AB leg should retrace between 61.8% and 78.6% Fibonacci ratio of the XA leg. This sets up the counter-trend.
- BC leg – The BC leg should be either a 38.2% or 88.6% retracement of the AB leg. This continues the counter-trend.
- CD leg – If BC is 38.2% of AB, CD should extend to 127.2% of BC. If BC is 88.6% of AB, the C D leg should extend to 161.8% of BC.
- AD leg – Finally, when CD completes, AD should retrace between 78.6% and 88.6% of the original XA leg which confirms the completion of the pattern.
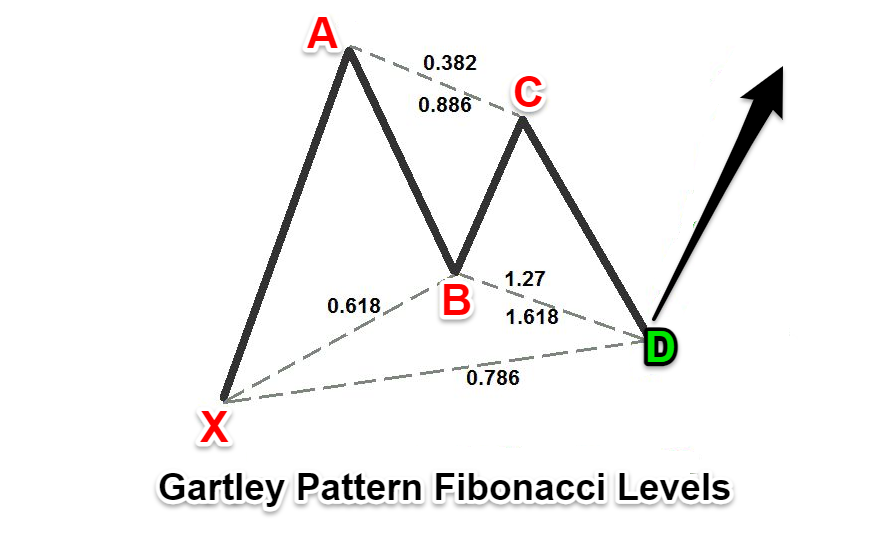
Following these Fibonacci sequences validates the Gartley. Traders can then watch for a potential reversal at points C and D when the pattern completes by using Fibonacci tools to measure the legs accurately is key to identifying valid formations.
When fully formed, the Gartley exhibits superb symmetry. Its adherence to precise Fibonacci levels reveals the hidden order in market movements first perceived by Gartley himself.
How to identify bearish and bullish Gartley patterns
The direction of the potential reversal at point D determines whether a Gartley pattern is bullish or bearish version.
Bullish Gartley Pattern
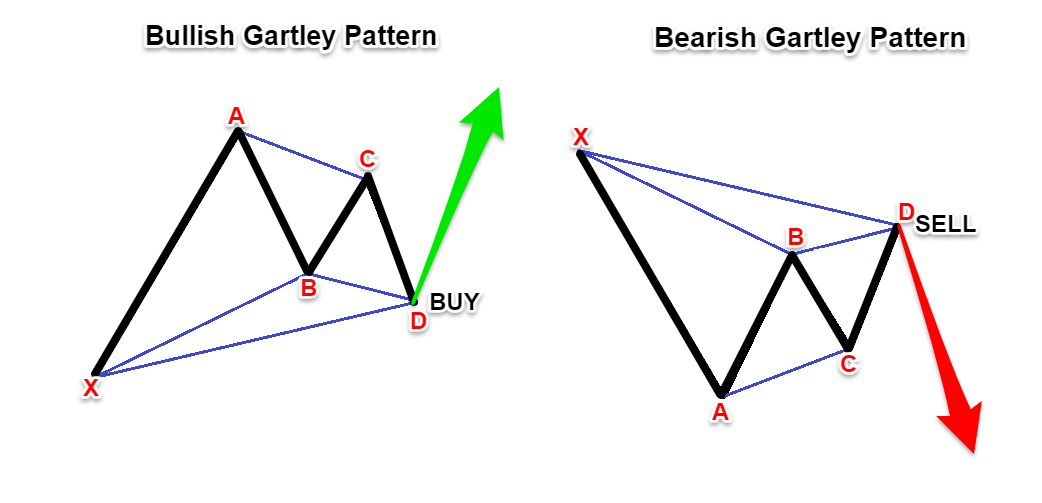
A bullish Gartley pattern has an overall bullish trend, with XA and BC legs moving up, and AB and CD legs moving down which sets up a potential reversal higher at point D. In an uptrend, the Gartley bullish pattern takes shape and it starts with point X marking a swing low. This is followed by lower highs at points A and C and higher lows at points B and D, creating the signature M shape.
Bearish Gartley Pattern
A bearish Gartley pattern has the opposite structure – down legs at XA and BC, and up legs at AB and CD. This creates potential for a reversal lower at D. The bearish Gartley formation forms the W configuration.
Profit target
Both patterns (bullish Gartley and bearish Gartley) have similar profit targets once confirmed:
- Swing B
- Swing C
- Swing A
- 161.8% extension of AD (final target)
So in summary, traders watch for the distinct M/W shape that forms against the prevailing overall trend. Then combine other indicators to confirm the potential reversal at points C and D gives trading opportunities in both bull and bear markets.
List of Harmonic Patterns
Here are some of the most common harmonic patterns used in technical analysis:
Examples of Harmonic Patterns
Basic Patterns:
- AB=CD: This pattern is formed by four price points (A, B, C, and D) where AB=CD and BC retraces a Fibonacci level (usually 38.2% or 61.8%) of AB.
- ABCD: This pattern is similar to the AB=CD pattern, but with an additional point (D) that is formed by extending the AB leg by the length of the BC leg.
5-point Patterns:
- Gartley: This pattern is formed by five price points (X, A, B, C, and D) where XA retraces 61.8% of AB, BC retraces 38.2% of XA, and CD extends 127.2% or 161.8% of BC.
- Butterfly: This pattern is similar to the Gartley pattern, but with a deeper retracement of BC (usually 78.6% or 88.6% of XA).
- Bat: This pattern is similar to the Gartley pattern, but with a shallower retracement of BC (usually 50% or 61.8% of XA).
- Crab: The crab pattern is similar to the Gartley pattern, but with a more complex internal structure.
- Shark: This pattern is similar to the Gartley pattern, but with a very specific set of Fibonacci retracements and extensions.
- Cypher: This pattern is a continuation pattern that is formed after a strong trend move. It is characterized by a deep retracement (usually 78.6% or 88.6%) followed by a shallow retracement (usually 38.2% or 50%).
Real World Example of a Gartley Pattern
Seeing the Gartley in action illustrates how to identify and trade harmonic patterns. Here are example charts of bullish and bearish Gartleys:
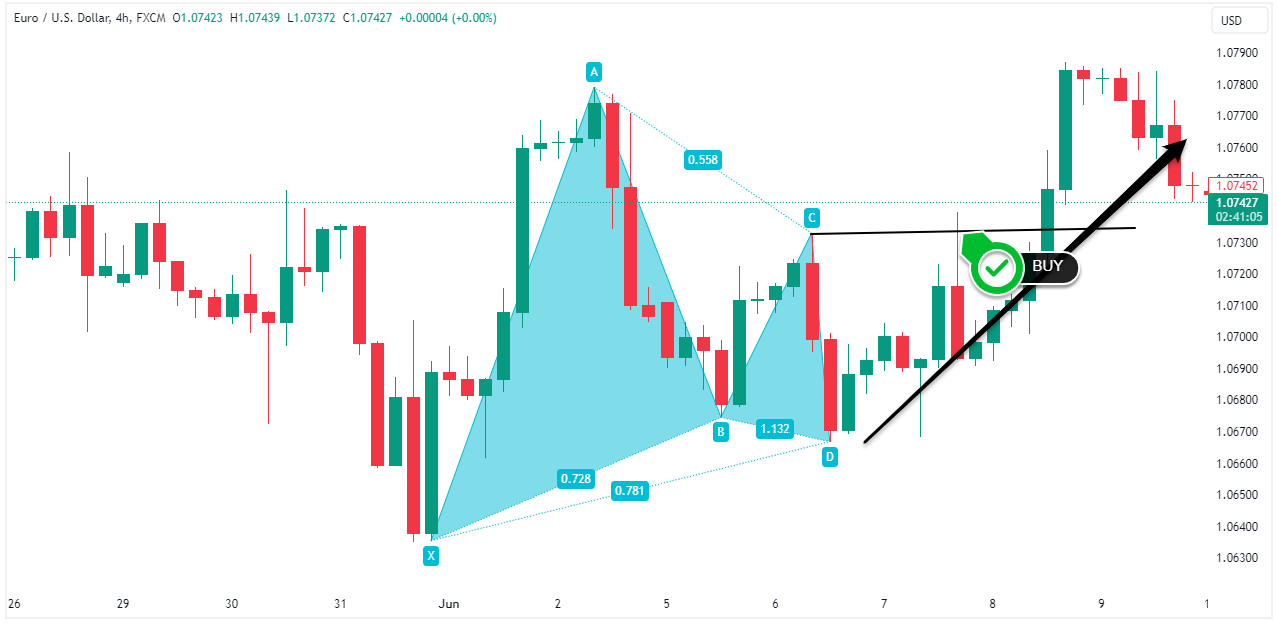
Bullish Gartley Pattern Example
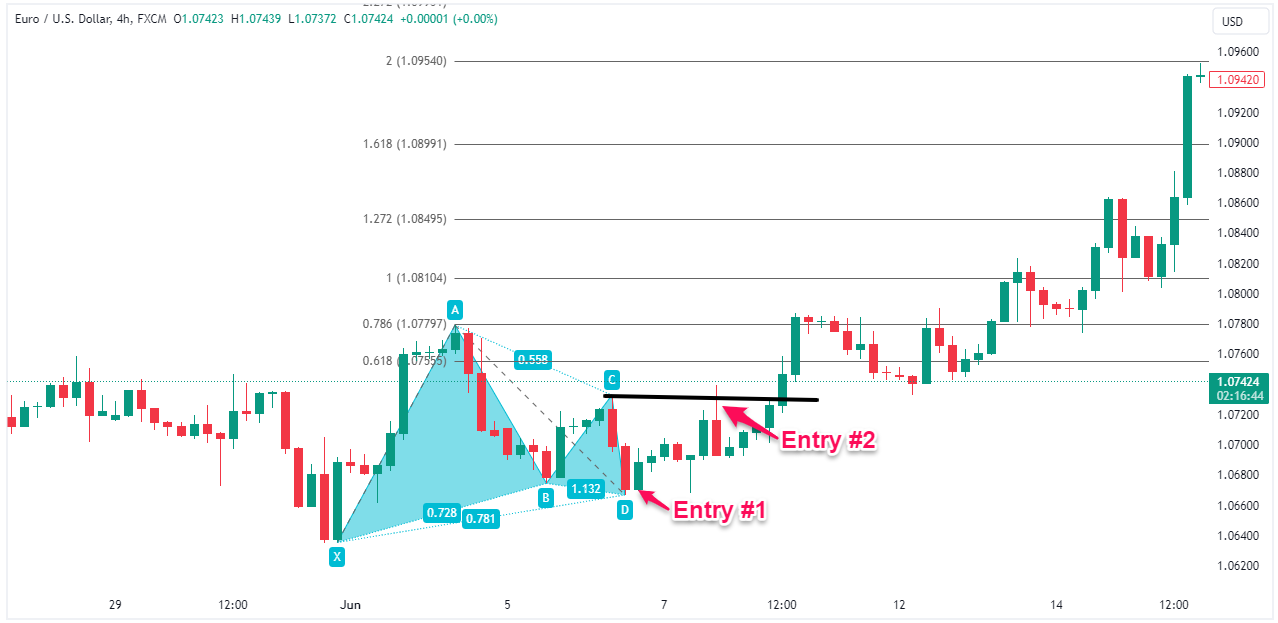
This 4-hour EUR/USD chart shows a bullish Gartley pattern unfolding in an uptrend. Points X, A, and C mark relative swing lows, while B and D are higher highs. The final leg CD retraces to the 127% Fib level, setting up a long entry on a break above C.
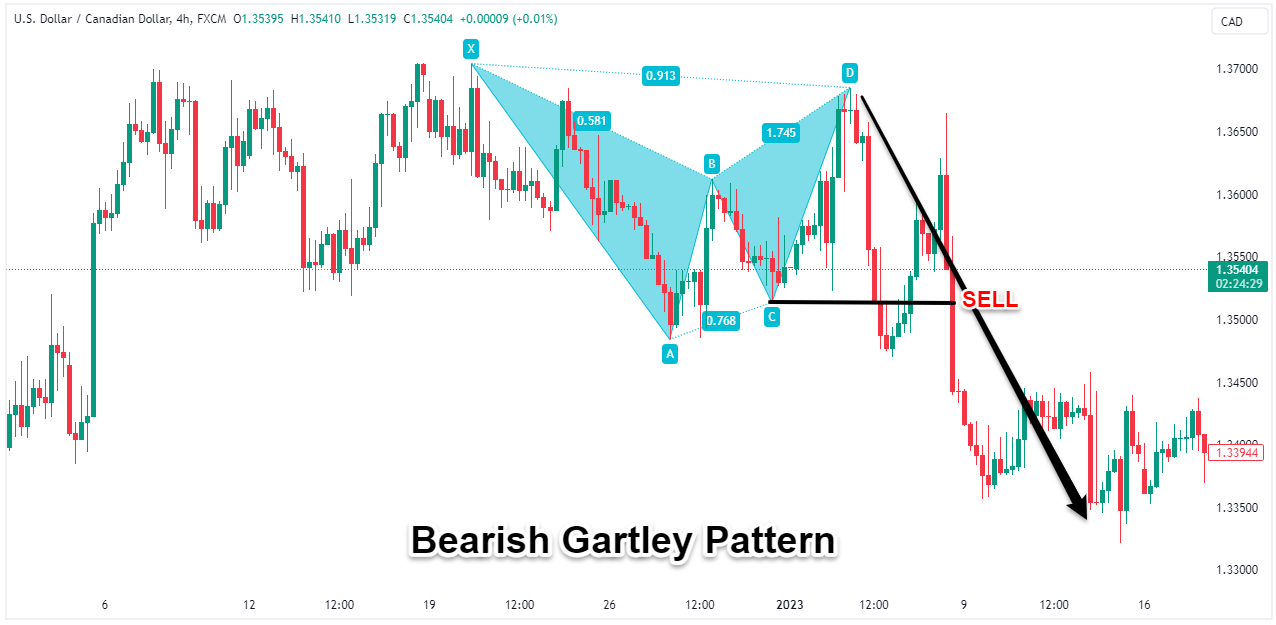
Bearish Gartley Pattern Example
On this 4-hour USDCAD chart, a bearish Gartley takes shape in a downtrend. The pattern has swing highs at X, A, and C, and lower lows at points B and D. Price finds support at the 161.8% Fib of BC, signaling a short on a breakdown below C.
Gartley Trading Strategy
The Gartley pattern offers traders a structured approach to identifying high-probability setups. While pricing and Gartley pattern trading details may vary, the core harmonic trading strategy remains constant.
First, correctly identify the pattern taking shape. Mark points X, A, B, C and D observing the Fibonacci ratios outlined by Gartley and monitor the CD leg, waiting for a test of the 127.2% or 161.8% Fib retracement levels. A bounce from either support indicates a valid pattern.
Gartley Trade Entry
Trade the Gartley pattern using this market entry strategy:
- For long entry, the trigger occurs on a break above point C on a bullish Gartley or between 127.2% or 161.8% Fibonacci ratios.
- For bearish Gartleys, the entry comes on a breakdown below point C or between 127.2% or 161.8% Fibonacci ratios.
Gartley Stop Loss
A key facet of the Gartley pattern rules is intelligently placing your stop loss to limit downside risks in case the setup fails.
For long trades triggered on a bullish Gartley, initial stops go below the D point swing low or below the 161.8% Fibonacci level. Adjust the stop higher as the trade moves favorably, such as above the C or B swings to lock in profits.
Gartley Take Profit
Setting clear price targets is crucial for booking profits when trading the Gartley pattern by banking gains methodically using the Fibonacci extensions identified within the pattern.
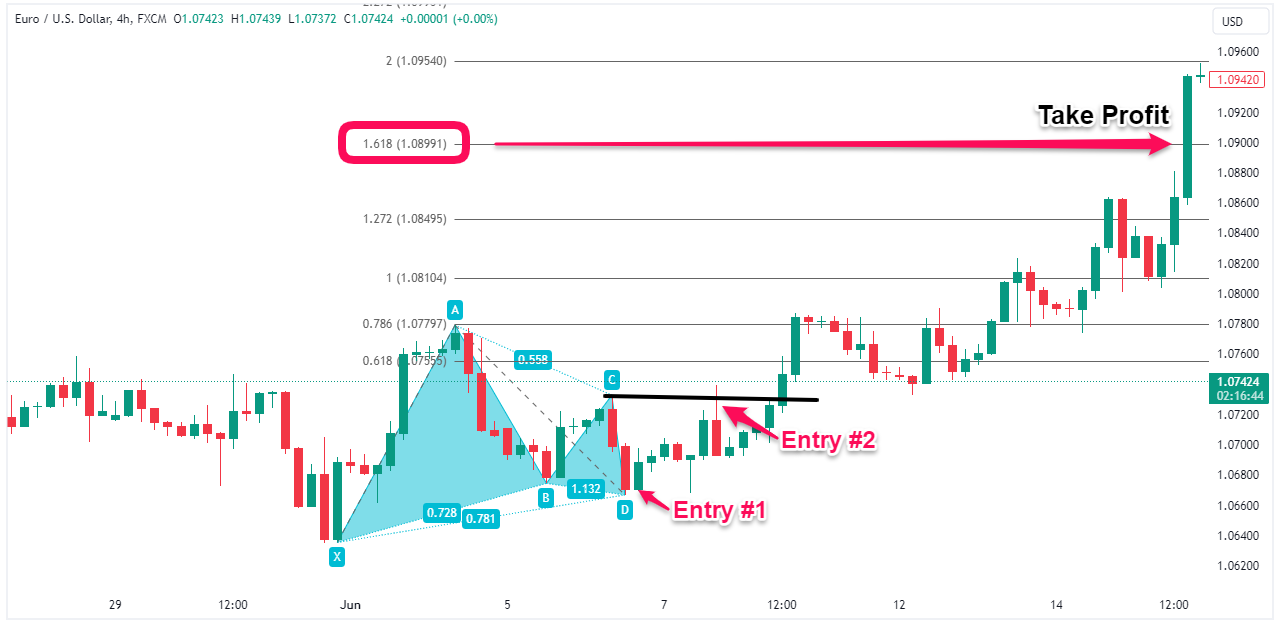
For bullish Gartleys, the initial profit target comes at the 161.8% Fibonacci extension of the AD leg, which aligns with Gartley’s measured move strategy. As the trade moves favorably, scale out portions at the previous swing highs:
- First target at point B
- Next target at point C
- and A swing point.
The beauty of the Gartley lies in its built-in exit strategy which highlights optimal areas to take profits, enabling traders to ride trends while banking regular gains. Savvy traders only book partial profits at extensions, allowing the remainder to run with a trailing stop.
By layering exits across defined targets, Gartley traders compound gains while managing risk. The key is having the discipline to follow multiple profit targets, scaling out of winning trades at predetermined levels.
MetaTrader 4 can automatically add Fibonacci retracements
Here’s how MetaTrader 4 can automatically add Fibonacci retracements when trading the Gartley pattern:
- Step #1: Locate the “Fibonacci Retracement” tool on the MT4 toolbar. It’s typically represented by an icon with several horizontal lines and percentages. Alternatively, navigate to “Insert” > “Fibonacci” > “Retracement” in the top menu.
- Step #2: Visually identify the X, A, B, and C points of the potential Gartley pattern on your chart.
- Step #3: Click on point X (the start of the pattern).
- Step #4: Drag the tool to point A (the end of the first leg).
- Step #5: Release the mouse button. MT4 will automatically plot the Fibonacci retracement levels, including the crucial 78.6% level for potential entry.
Alternatively, The MetaTrader community has developed numerous custom indicators specifically designed to identify Gartley patterns. These indicators can be downloaded for free or purchased from online marketplaces like MQL5.
Market Context Conditions
The Gartley pattern like any harmonic chart pattern offers high-probability setups, but trades still require confirmation using broader chart analysis.
Examining the current structure of pivotal levels, trends and volatility gauges the market backdrop.
Are prices stretched to extremes or consolidating in a range?
What do oscillators show about momentum?
Does volume confirm the emerging move?
Analyzing higher time frames reveals the dominant trend. Apply bullish Gartleys in uptrends, bearish in downtrends. Look for converging signals like breakouts across multiple frames and ensure the broader technical picture aligns.
While the Gartley gives the pattern, price action provides real-time clues from the trading chart.
No indicator offers a crystal ball, but combining chart context with the high-probability Gartley improves both the timing and structure of trades. Traders gain an edge from the pattern itself and skillful execution based on developing market conditions.
Key Takeaways
Here are core lessons for effectively trading Gartleys:
- Identify bullish and bearish versions using the defined swings and ratios. Bearish Gartleys have highs at X, A, C and lows at B, D.
- Trade bullish Gartleys in uptrends, bearish Gartleys in downtrends based on bearish gartley pattern rules and pattern sequence.
- Enter long on bullish patterns after a break of point D and place stops under D, take profits at Fib extensions.
- For bearish Gartleys, go short on a breakdown below D, with stops above D and downside targets.
- Confirm pattern validity using price action before triggering entries at point D.
- Scale out partial profits at the C, B and A swings to bank gains on the way up.
Final Thoughts
In closing, the Gartley pattern represents one of the most reliable trading strategies for profiting from harmonic market moves. By combining quantified Fibonacci ratios with price action, the Gartley provides a probabilistic method to buying lows and selling highs.
However, successfully trading Gartleys requires practice and skill. Mastering entries, stop placement, profit targets and confirmations separates success from failure.
For hands-on experience trading Gartleys and other chart patterns, be sure to practice with a broker offering robust charting capabilities, tight spreads and quality executions. Evaluate brokers using our forex comparison to find the best forex brokers for your trading style and harmonic strategy.