Risk Warning: Your capital is at risk. Statistically, only 11-25% of traders gain profit when trading Forex and CFDs. The remaining 74-89% of customers lose their investment. Invest in capital that is willing to expose such risks.

USD/MXN Trade Ideas

Filter:
USD/MXN
Popular
EUR/USD
GBP/USD
USD/CHF
USD/JPY
AUD/USD
Brent
XAU/USD
All instruments:
Forex
USD/CAD
EUR/JPY
EUR/GBP
NZD/USD
EUR/AUD
GBP/JPY
CAD/JPY
EUR/CAD
NZD/JPY
GBP/CHF
CHF/JPY
EUR/NZD
GBP/AUD
CAD/CHF
AUD/NZD
NZD/CAD
GBP/CAD
AUD/CHF
Metals
XAG/USD
XAU/USD
XPD/USD
XPT/USD
XCU/USD
Energy
WTI
Brent
Indexes
S&P500
DOW30
DXY
Select
AUD/CAD
AUD/JPY
AUD/SGD
AUD/USD
BTC/USD
CHF/BGN
CHF/RON
CHF/SGD
CHF/TRY
EUR/CHF
EUR/CZK
EUR/DKK
EUR/HKD
EUR/HUF
EUR/ILS
EUR/MXN
EUR/NOK
EUR/PLN
EUR/RON
EUR/RUB
EUR/SEK
EUR/SGD
EUR/TRY
EUR/USD
EUR/ZAR
GBP/BGN
GBP/CZK
GBP/DKK
GBP/HKD
GBP/HUF
GBP/NOK
GBP/NZD
GBP/PLN
GBP/RON
GBP/SEK
GBP/SGD
GBP/TRY
GBP/USD
GBP/USD
GBP/ZAR
HKD/JPY
NZD/CAD
NZD/CHF
SGD/HKD
SGD/JPY
TRY/JPY
USD/BGN
USD/CHF
USD/CNH
USD/CNY
USD/CZK
USD/DKK
USD/EUR
USD/HKD
USD/HUF
USD/ILS
USD/JPY
USD/MXN
USD/NOK
USD/NOK
USD/PLN
USD/RON
USD/RUB
USD/SEK
USD/SGD
USD/TRY
USD/ZAR
Clear
All Forex brokers
All Forex brokers
Alpari
EXNESS
FBS
FIBO Group
HYCM
IG
Instaforex
NordFX
RoboForex
Levels to trade USD/MXN
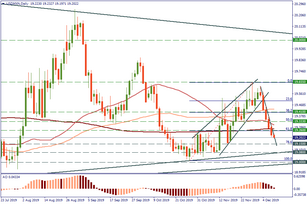
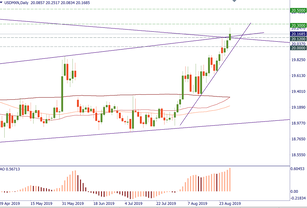
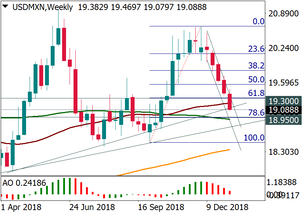
The volatility in USD/MXN has jumped. The pair is correcting up within the downtrend, which has been in place since September. On Thursday, the price closed above 18.78 (50-day MA). The targets for the correction lie in the 19.015/038 area (100-day MA, the presumed point D of a harmonic “Crab” patte...
28
USD/MXN can offer more
Trade idea SELL 19.1950; TP1 19.15; TP2 19.08; SL 19.22 USD/MXN has found itself within a rather steep downtrend. The pair has topped at 19.6550 at the end of November and during the last several days dropped below the 100-, 50- and 200-day MAs. Although in the short-term the USD is obviously overso...
18
USD/MXN is fighting with resistance
Trade ideas BUY 19.64; TP 19.78; SL 19.60 SELL 19.48; TP 19.42; SL 19.50 USD/MXN has been strengthening since the start of November, although you can notice by looking at the chart that the advance hasn’t been smooth. During the recent days, the price has been trading in a kind of a “rising wedge”. ...
23
USD/MXN is at the support line
Trade idea BUY 19.25; TP 19.38; SL 19.21 USD/MXN has reached the support line which has been limiting its downside since the middle of 2017. The line’s currently supporting it in the 19.07 area. The price action on the D1 is in line with the parameters of the bullish Gartley harmonic pattern. As a r...
18
USD/MXN is trying to recover
Trade idea BUY 19.51; TP 19.6670; SL 19.45 BUY 19.6150; TP1 19.6670; TP2 19.73; SL 19.59 USD/MXN was supported by the 50-week MA around 19.38 and the 100-day MA at 19.33. The pair also went above the 50-day MA (now at 19.52). On the H4, we see a series of higher highs and lows. This may mean that US...
10
USD/MXN has reached the key area
Trade ideas SELL 20.10; TP 20.00; SL 20.13 BUY 20.30; TP 20.50; SL 20.25 USD/MXN had a very bullish August. The pair is currently testing the resistance line connecting the highs of 2017 and 2018 at 20.12. This is, of course, a very significant obstacle. Even though the USD is currently trading abov...
8
USD/MXN is trading in a range
Trade ideas SELL 19.60; TP1 19.55; TP2 19.40; SL 19.62 Let’s try some range trading. It seems that such an opportunity has presented itself in the pair USD/MXN. This pair is quite used to sideways trading. On D1, we see that the upper wicks of the recent candlesticks have been longer than the lower ...
8
USD/MXN: the clues from the technical picture
Trade ideas SELL 18.97; TP 18.90; SL 19.00 BUY 19.20; TP 19.28; SL 19.18 As you look for the technical trade ideas, pay attention to USD/MXN. On D1, the pair formed a bearish “shooting star” candlestick ahead of the resistance line from December high. In addition, the 100-day MA went below the 200-d...
10
USD/MXN came in motion
Trade idea SELL 18.98; TP 19.90; SL 19.00 USD/MXN fell for three days in a row, dived below 50-day MA (19.15) and closed yesterday below the support line going through 2018 lows (19.04). The Mexican peso is supported by the rising oil prices, while the USD weakened ahead of the Fed’s meeting. If the...
6
USD/MXN remains under pressure
Trade idea SELL at 19.06; TP 19.00; SL 19.08 USD/MXN is testing levels below 50-week MA (19.2130) and is vulnerable for a slide to the 100-week MA (18.9090). The pair is trading within a narrow rapid downtrend channel on D1. The next level of attraction is the 78.6% Fibo retracement in the 18.95 ar...
6
A trade idea for USD/MXN
Trade idea SELL at 20.20; TP1 20.10; TP2 19.98; SL 20.28 USD/MXN has met resistance at the line connecting 2017 and 2018 highs. On D1, it went far from the moving averages that are currently below the price chart and will likely correct down. The dynamics of the pair resembles a “Three drives” patte...
7


Was the information useful for you?

Categories

Forex Analysis
Forex Technical Analysis
Fundamental Analysis
Forex Market Overview
Daily Forex Forecasts
Weekly Forex Forecasts
Monthly Forex Forecasts
Forex Trade Ideas
Stock Market Analysis
Fractal Analysis
Forex Wave Analysis
Forex Trend Analysis
Ichimoku Analysis
Fibonacci Analysis
Candlestick Analysis
Forex Murrey Math Lines