Risk Warning: Your capital is at risk. Statistically, only 11-25% of traders gain profit when trading Forex and CFDs. The remaining 74-89% of customers lose their investment. Invest in capital that is willing to expose such risks.

Fibonacci Forex Analysis

Filter:
All instruments
Popular
EUR/USD
GBP/USD
USD/CHF
USD/JPY
AUD/USD
Brent
XAU/USD
All instruments:
Forex
USD/CAD
EUR/JPY
EUR/GBP
NZD/USD
EUR/AUD
GBP/JPY
CAD/JPY
EUR/CAD
NZD/JPY
GBP/CHF
CHF/JPY
EUR/NZD
GBP/AUD
CAD/CHF
AUD/NZD
NZD/CAD
GBP/CAD
AUD/CHF
Metals
XAG/USD
XAU/USD
XPD/USD
XPT/USD
XCU/USD
Energy
WTI
Brent
Indexes
S&P500
DOW30
DXY
Select
AUD/CAD
AUD/JPY
AUD/SGD
AUD/USD
BTC/USD
CHF/BGN
CHF/RON
CHF/SGD
CHF/TRY
EUR/CHF
EUR/CZK
EUR/DKK
EUR/HKD
EUR/HUF
EUR/ILS
EUR/MXN
EUR/NOK
EUR/PLN
EUR/RON
EUR/RUB
EUR/SEK
EUR/SGD
EUR/TRY
EUR/USD
EUR/ZAR
GBP/BGN
GBP/CZK
GBP/DKK
GBP/HKD
GBP/HUF
GBP/NOK
GBP/NZD
GBP/PLN
GBP/RON
GBP/SEK
GBP/SGD
GBP/TRY
GBP/USD
GBP/USD
GBP/ZAR
HKD/JPY
NZD/CAD
NZD/CHF
SGD/HKD
SGD/JPY
TRY/JPY
USD/BGN
USD/CHF
USD/CNH
USD/CNY
USD/CZK
USD/DKK
USD/EUR
USD/HKD
USD/HUF
USD/ILS
USD/JPY
USD/MXN
USD/NOK
USD/NOK
USD/PLN
USD/RON
USD/RUB
USD/SEK
USD/SGD
USD/TRY
USD/ZAR
All Forex brokers
All Forex brokers
Alpari
EXNESS
FBS
FIBO Group
FxPro
FXTM
HYCM
IG
Instaforex
NordFX
RoboForex
Japanese Candlesticks Analysis 13.05.2022 (EURUSD, USDJPY, EURGBP)
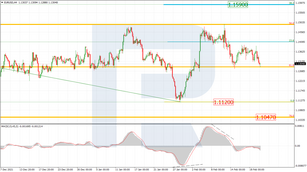
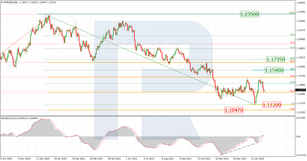
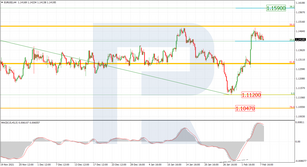
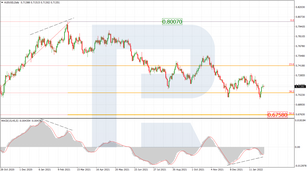
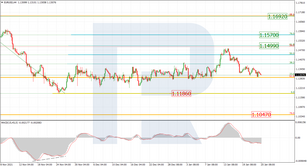
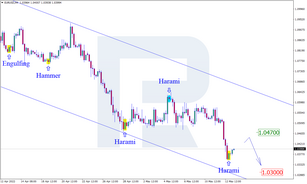
13.05.2022EURUSD, “Euro vs US Dollar”As we can see in the H4 chart, the asset has formed a Harami reversal pattern close to the support area. At the moment, EURUSD is reversing in the form of a new ascending impulse. In this case, the upside target may be at 1.0470. However, an alternative scenario ...
247
Fibonacci Retracements Analysis 23.02.2022 (GBPUSD, EURJPY)
23.02.2022GBPUSD, “Great Britain Pound vs US Dollar”As we can see in the H4 chart, GBPUSD is still consolidating around 38.2% fibo and this consolidation range may later be followed by a new rising impulse. The mid-term upside targets may be 61.8% and 76.0% fibo at 1.3833 and 1.3987 respectively. Th...
247
Fibonacci Retracements Analysis 22.02.2022 (EURUSD, USDJPY)
22.02.2022EURUSD, “Euro vs US Dollar”As we can see in the H4 chart, divergence on MACD made the asset complete the rising impulse and resume its local correction. The most probable scenario implies that the pair may finish the correction soon above the low at 1.1120 and then continue growing to brea...
199
Fibonacci Retracements Analysis 21.02.2022 (GOLD, USDCHF)
21.02.2022XAUUSD, “Gold vs US Dollar”As we can see in the H4 chart, the asset is testing the mid-term 61.8% fibo at 1908.00. Possibly, the pair may rebound and form a slight pullback, which may later be followed by a further uptrend. The next upside target is 76.0% fibo at 1969.00.The H1 chart shows...
670
Fibonacci Retracements Analysis 17.02.2022 (Brent, Dow Jones)
17.02.2022BrentAs we can see in the H4 chart, divergence on MACD made the asset start a new correctional decline after entering the post-correctional extension area between 138.2% and 161.8% fibo at 94.54 and 99.43 respectively. A breakout of the key support at 65.89 will lead to a reversal of the l...
23
Fibonacci Retracements Analysis 16.02.2022 (GBPUSD, EURJPY)
16.02.2022GBPUSD, “Great Britain Pound vs US Dollar”As we can see in the H4 chart, GBPUSD is consolidating around 38.2% fibo. This consolidation range may be followed by a new rising impulse. The mid-term upside targets may be 61.8% and 76.0% fibo at 1.3833 and 1.3987 respectively. The key support r...
79
Fibonacci Retracements Analysis 15.02.2022 (EURUSD, USDJPY)
15.02.2022EURUSD, “Euro vs US Dollar”As we can see in the daily chart, the asset is quickly correcting to the upside after convergence on MACD. After reaching and testing 23.6% fibo, the pair has started a slight pullback within this correctional uptrend. After this pullback is over, the price may f...
86
Fibonacci Retracements Analysis 14.02.2022 (GOLD, USDCHF)
14.02.2022XAUUSD, “Gold vs US Dollar”As we can see in the H4 chart, after breaking the previous high, the asset continues trading upwards. In the future, the pair may reach and break the long-term 61.8% fibo at 1908.00. At the moment, XAUUSD is testing 50.0% fibo.The H1 chart shows that after finish...
100
Fibonacci Retracements Analysis 11.02.2022 (AUDUSD, USDCAD)
11.02.2022AUDUSD, “Australian Dollar vs US Dollar”As we can see in the H4 chart, AUDUSD has completed the first correctional wave to the upside after testing 23.6% fibo. The current decline may be heading to break the low at 0.6967 and then continue down to 50.0% fibo at 0.6758. However, as long as ...
102
Fibonacci Retracements Analysis 10.02.2022 (Brent, Dow Jones)
10.02.2022BrentAs we can see in the H4 chart, divergence on MACD made the asset start a new correctional downtrend after testing the post-correctional extension area between 138.2% and 161.8% fibo at 94.53 and 99.41 respectively. After the correction is over, the price may break the local high at 94...
24
Fibonacci Retracements Analysis 09.02.2022 (GBPUSD, EURJPY)
09.02.2022GBPUSD, “Great Britain Pound vs US Dollar”As we can see in the H4 chart, the rising wave, which is heading towards the local high at 1.3749, is slowing down. After breaking the high, the asset may reach the key resistance at 1.3834. However, there is an alternative scenario suggesting that...
101
Fibonacci Retracements Analysis 08.02.2022 (EURUSD, USDJPY)
08.02.2022EURUSD, “Euro vs US Dollar”As we can see in the H4 chart, the asset is quickly correcting to the upside after completing the previous downtrend, which failed to reach 76.0% fibo at 1.1047 due to convergence on MACD. As of now, the first rising impulse has already reached 23.6% fibo. In the...
61
Fibonacci Retracements Analysis 07.02.2022 (GOLD, USDCHF)
07.02.2022XAUUSD, “Gold vs US Dollar”As we can see in the H4 chart, the asset is correcting upwards after plummeting before. Divergence on MACD, which made the pair form the first descending wave earlier, may force the second one. The closest downside target may be 61.8% fibo at 1730.00. However, an...
98
Fibonacci Retracements Analysis 04.02.2022 (AUDUSD, USDCAD)
04.02.2022AUDUSD, “Australian Dollar vs US Dollar”The daily chart shows a double test of the long-term 38.2% fibo and an update of the low, as well as convergence on MACD. In this case, the pair is expected to start a new rising correction, which may later be followed by a further downtrend towards ...
79
Fibonacci Retracements Analysis 03.02.2022 (Brent, Dow Jones)
03.02.2022BrentAs we can see in the H4 chart, after breaking the high at 86.63 and fixing above it, Brent has stopped at 91.43. At first, the asset intended to reach the post-correctional extension area between 138.2% and 161.8% fibo at 94.53 and 99.41 respectively, but the above-mentioned level tur...
17
Fibonacci Retracements Analysis 02.02.2022 (GBPUSD, EURJPY)
02.02.2022GBPUSD, “Great Britain Pound vs US Dollar”As we can see in the H4 chart, after falling and reaching 61.8% fibo, GBPUSD is correcting upwards. If this correctional uptrend is transformed into a proper rising wave, the price may grow to break the local high at 1.3749 and then reach the key r...
78
Fibonacci Retracements Analysis 01.02.2022 (EURUSD, USDJPY)
01.02.2022EURUSD, “Euro vs US Dollar”As we can see in the daily chart, the downtrend continues as the asset is heading towards 76.0% fibo at 1.1047. At the moment, the pair is correcting upwards after completing the previous descending impulse. After the pullback is over, EURUSD may resume falling t...
45
Fibonacci Retracements Analysis 31.01.2022 (GOLD, USDCHF)
31.01.2022XAUUSD, “Gold vs US Dollar”As we can see in the H4 chart, after attempting to reach the high at 1877.09, XAUUSD is forming a steady wave to the downside and has already returned to 38.2% fibo tested earlier. The next downside targets may be 61.8% and 76.0% fibo at 1730.00 and 1696.10 respe...
72
Fibonacci Retracements Analysis 28.01.2022 (AUDUSD, USDCAD)
28.01.2022AUDUSD, “Australian Dollar vs US Dollar”As we can see in the daily chart, having completed the correction, the asset is forming a new wave to the downside and re-testing 38.2%. The downside targets are 50.0% and 61.8% fibo at 0.6758 and 0.6464 respectively. The resistance is the high at 0....
37
Fibonacci Retracements Analysis 27.01.2022 (Brent, Dow Jones)
27.01.2022BrentAs we can see in the H4 chart, after breaking the high at 86.63 and fixing above it, Brent has tested the psychologically important level of $90 per barrel. In this case, the asset may slightly correct in the nearest future and then resume growing. The next upside targets are inside t...
23
Fibonacci Retracements Analysis 26.01.2022 (GBPUSD, EURJPY)
26.01.2022GBPUSD, “Great Britain Pound vs US Dollar”As we can see in the H4 chart, the previous decline has been replaced by a slight growth, which may start a new rising wave. If it happens, the upside targets may be 61.8% and 76.0% fibo at 1.3834 and 1.3987 respectively. However, an alternative sc...
91
Fibonacci Retracements Analysis 25.01.2022 (EURUSD, USDJPY)
25.01.2022EURUSD, “Euro vs US Dollar”As we can see in the H4 chart, after growing and reaching 50.0% fibo, the asset is trading to the downside. This movement may be considered another descending impulse within the downtrend; its closest target is the low at 1.1186, a breakout of which may lead to a...
57
Fibonacci Retracements Analysis 24.01.2022 (GOLD, USDCHF)
24.01.2022XAUUSD, “Gold vs US Dollar”As we can see in the daily chart, XAUUSD is still forming another rising wave within the uptrend and may soon reach 50.0% fibo. Later, the pair is expected to continue the uptrend to reach 61.8% and 76.0% fibo at 1908.00 and 1969.50 respectively. The key support ...
86
Fibonacci Retracements Analysis 21.01.2022 (AUDUSD, USDCAD)
21.01.2022AUDUSD, “Australian Dollar vs US Dollar”As we can see in the H4 chart, the asset is moving to the downside after finishing the correctional uptrend at 50.0% fibo and divergence on MACD. One can expect another rising impulse towards 61.8% and 76.0% fibo at 0.7340 and 0.7420 but the main sce...
42
Fibonacci Retracements Analysis 20.01.2022 (Brent, Dow Jones)
20.01.2022BrentAs we can see in the H4 chart, Brent has broken its previous high at 86.63. Right now, the asset is trying to fix above it and continue trading upwards to reach the post-correctional extension area between 138.2% and 161.8% fibo at 94.56 and 99.43 respectively. The key support is the ...
20
Fibonacci Retracements Analysis 19.01.2022 (GBPUSD, EURJPY)
19.01.2022GBPUSD, “Great Britain Pound vs US Dollar”As we can see in the H4 chart, after an attempt to test and break 76.0% fibo, GBPUSD has started a new decline, which may transform into a proper descending wave towards the low at 1.3160. The key resistance and the next upside target are the high ...
63
Fibonacci Retracements Analysis 18.01.2022 (EURUSD, USDJPY)
18.01.2022EURUSD, “Euro vs US Dollar”As we can see in the H4 chart, after breaking its consolidation range to the upside, EURUSD has broken 50.0% fibo. At the moment, the asset is starting a new pullback, which may later be followed by another growth towards 61.8% and 76.0% fibo at 1.1500 and 1.1570...
37
Fibonacci Retracements Analysis 17.01.2022 (GOLD, USDCHF)
17.01.2022XAUUSD, “Gold vs US Dollar”As we can see in the daily chart, XAUUSD is forming another rising wave within the uptrend after convergence on MACD; the previous wave has tested 50.0% fibo. In this case, the pair is expected to continue the uptrend to reach 61.8% and 76.0% fibo at 1908.00 and ...
60
Fibonacci Retracements Analysis 14.01.2022 (AUDUSD, USDCAD)
14.01.2022AUDUSD, “Australian Dollar vs US Dollar”As we can see in the daily chart, the asset is still moving to the upside after testing 38.2% fibo and convergence on MACD. This movement should be considered as a short-term ascending correction, which may later be followed by a further downtrend to...
34
Fibonacci Retracements Analysis 13.01.2022 (Brent, Dow Jones)
13.01.2022BrentAs we can see in the H4 chart, the situation has significantly changed over the last week. At the moment, Brent is steadily growing towards the high at 86.63. However, the asset may yet slightly correct before attacking this level. After breaking the high, the price may continue tradi...
18


Was the information useful for you?

Categories

Forex Analysis
Forex Technical Analysis
Fundamental Analysis
Forex Market Overview
Daily Forex Forecasts
Weekly Forex Forecasts
Monthly Forex Forecasts
Forex Trade Ideas
Stock Market Analysis
Fractal Analysis
Forex Wave Analysis
Forex Trend Analysis
Ichimoku Analysis
Fibonacci Analysis
Candlestick Analysis
Forex Murrey Math Lines