 Alpari
 XM
XMForex trading is well-known for its profitability, particularly to those who have reaped its rewards. But there's more to trading than just Forex. Exploring other markets can open up new, profitable avenues.
Among these alternatives, gold trading stands out. It's known for its remarkable volatility — where your capital can rapidly increase, but also disappear just as quickly. This makes it an exciting yet challenging market to engage with.
Historically, gold hasn't always been this volatile. Understanding the shift in its market behavior is key. It involves exploring gold's past, its status as a safe haven for investors, and the strategies that can help you leverage its current volatility for potential gains. (Investor Tips 2019: What To Include In Your Portfolio)
History of Gold as a Currency
Before the printing machine, traders needed a form of currency that represented value to replace the barter system. To fit this purpose, many items became a form of currency, but gold stood out among the rest. First, gold was a rare metal and thus it had a lot of value to the person who had it. Second, it could not lose value with time because it is chemically unreactive and resistant to corrosion. Many other materials could not fulfill both of these purposes and so gold became the standard currency for centuries. (This is: How To Make Trading Metal CFDs More Profitable)
Back then, it was the amount of gold one had that represented the value of a coin, which is why countries were rushing to find more gold around the world by sending explorers. Besides gold, silver was also a good alternative seeing as it had been in use since the days of the Roman Empire. Silver and bronze were more common in Europe than gold because it was more commonly available and could create more coins. You see, as the population grew, the little gold available was not enough to create gold coins, and so silver coins became more suitable as currency. (Do you know: Which Are The Best Commodities To Trade In The Autumn?)
The status quo remained for centuries but there was a need for a change as global trading became more common. It was no longer as easy to haul gold bullion for the trade of large, valuable goods, nor was it secure because sailors were afraid of pirates. Moreover, there had already begun a practice of making fake gold coins. The easiest way to do this was by shaving off the edges of several coins to make another coin and since gold coins were very valuable, it was worth it. Also, consider that they didn’t have modern weighing scales and could miss a few grams that had been shaved off as gold coins were valued by their weight. Another way of making fake gold coins was by mixing them with other base metals that had less value like lead or copper. (Find out: What's going on with oil and how does it affect traders)
With so many problems in trading using gold, a simple method arose whereby goldsmiths would issue paper receipts to buyers and sellers of gold rather than the actual material. It is no wonder then that some of the first private banking institutions in Europe began in the goldsmith's shops. The replacement of gold with the paper was first made official in 1861 when the first US paper currency was printed by Salmon Chase, then Treasury Secretary. Meanwhile, the Gold Standard Act was passed that set the value of gold per ounce at $20.67. Now it was possible to tie a particular amount of gold to a dollar value – a system that remained for nearly a century later. (Here is: All you need to know about futures contracts)
Although the use of paper to represent an amount of gold created trust, the value of gold kept on changing as gold deposits were discovered around the world. The final blow came in the wake of World War 1 when participating countries had to weaken the gold standard to finance military operations. After the war, many of the countries that abandoned the gold standard returned to it but had to abandon it once again during the Great Depression. When the depression hit, people were hoarding gold and distrusting financial institutions while withdrawing gold from banks at a very high rate. This run of gold forced US President Roosevelt to close the banks and turn in their gold to the Federal Reserve. This move was also meant to prevent other countries from redeeming gold and depleting the US gold reserves.
It was only later that economists realized how the gold standard was hurting economies rather than helping them. For example, during the Great Depression, the US government increased interest rates to give the dollar more value and discourage redeeming gold. Instead of the intended purpose, this made the depression worse for people and many banks and businesses were forced to close. That is why gold was devalued by 40% by President Roosevelt in 1934 from $20.67 to $35 per ounce. With this increase, the value of reserves rose from $4.033 billion to $7.348 billion. With the Gold Reserve Act of 1934 that prohibited the private ownership of gold, the US had the most gold reserves in the world, and so most countries simply pegged their currencies to the US dollar rather than gold. As a result, the US dollar became the world currency as it was favored over gold in international trade.
In the US, the balance of payments kept on increasing as Americans kept on importing foreign goods using dollars. By 1970, there was only $14.5 billion worth of gold in reserves yet foreign dollar holdings were $45.7 billion. Gold was devalued to $38 per ounce in 1971 and then to $42 in 1973. Finally, in 1976 gold was completely decoupled from the dollar seeing the gold standard was simply not working. After the decoupling, the value of gold shot up to $120 an ounce in the free market, and it has risen by over 900% to its current price of $1,220 since then. Its peak value was on the 5th of September, 2011, when an ounce of gold was valued at $1,895 because of economic uncertainty and the use of gold as a safe haven.
Now instead of currency representing a particular amount of gold, it is simply fiat meaning that it is only backed by the government issuing it. Over the years, there have been various calls to return to the gold standard, although these have only received minor support and seem unlikely. Even more unlikely is the use of blockchain as a standard. Mostly, the gold standard hinders economic growth because countries can print more currency and stimulate growth, even though it may cause inflation in the short term.
What to consider when trading gold
Now that gold is no longer pegged to any currency, its value can change based on a variety of factors that could arise from any region of the world. If you’re going to be trading in gold, then you have to be aware of these factors so that you can be ready for what’s coming instead of reacting all the time. Remember that success in financial trading involves mastering an asset and the factors that affect it from one time to the next. If you can master these factors, then gold trading will become easier for you. (know the: 10 steps of successful traders)
Contract specifications
Before making any trades, it is important to know exactly what you’re getting into and how much you should be risking. We always advise that you should not risk more than 2% of your capital, but the only way to know what that 2% represents is to understand the contract specifications from your broker. The best Forex trading companies provide a calculator within their website that allows anyone to analyze the amount of exposure they will be getting themselves into.
If you’re completely new to Forex trading, gold is traded under the symbol XAU and can be paired with the US dollar (XAU/USD) or the euro (XAU/EUR). This is by the ISO 4217 standard that requires currencies to be designated in three letters. Gold’s scientific name is derived from its Latin origin, aurum, and symbolized as Au on the periodic table with an ‘X’ affixed at the end. When paired with the US dollar, XAU/USD will have 4 figures and 2 decimal places. The image below is a screenshot of the contract specifications from Alpari Forex brokers.
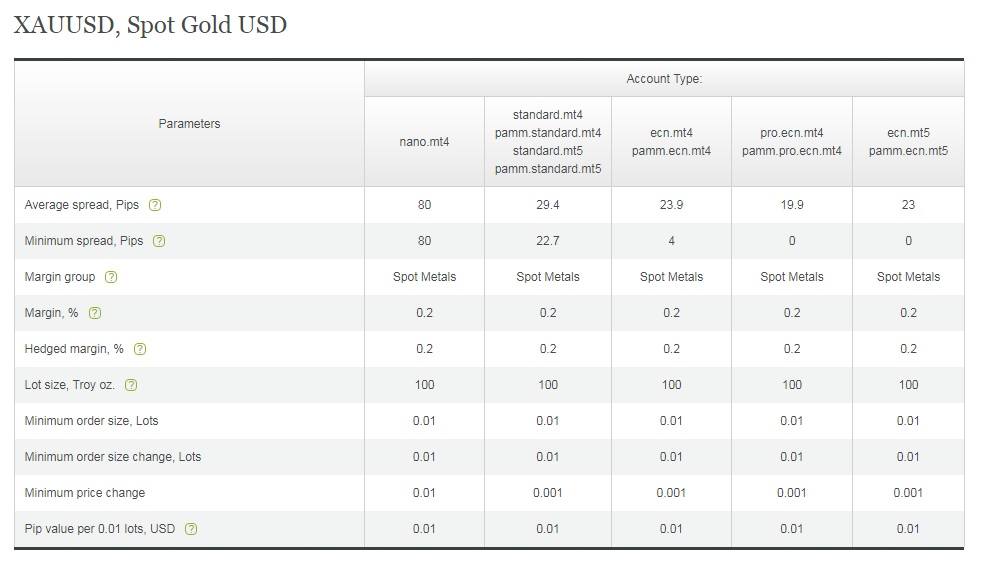
Assuming you are using a standard account where a single lot represents 100,000 units, the table implies that a single pip movement will cause a change of $0.01 if you had traded 0.01 lots. You should also note all the other specifications regarding gold trading by this broker such as margin, lot sizes, and the spread. Here, the spread is a bit higher than with currency pairs, but that is to be expected since these are CFDs. All the same, compared to various other brokers, this isn’t a very bad deal; in fact, it’s very good.
It is important to know how much you are risking because gold can be very volatile at times and because of its high margin requirements, can cause massive losses when unchecked. To avoid getting a margin call or being stopped from your position, calculate the margin requirements against your capital. If you have little capital, then it is advisable not to trade in CFDs or, if you must, lower the amount of leverage you use. Even if you have a huge capital, it is still necessary to calculate precisely the level of risk you can comfortably take.
Best times and days to trade
Once you know the risk you’re taking, now it’s time to find out when gold trading is best for you. First off, gold trading does not run continuously the same way currency pairs do among most brokers. Continuing with our example with Alpari, trading runs from 1 am to midnight, leaving a recess from midnight to 1 am the following day. This is also important to know because the swaps involved in leaving a trade open onto the next day are larger than that which is charged for currency pairs. Also remember that, while markets are closed, crucial news could be announced that affects the value of gold, locking you out of your trade during this time and potentially losing you money if you can’t close your trade or open a new one. Once you are aware of the trading times by your broker, especially going into the weekend when weekend swaps can be enormous, you should be able to close any open positions if need be before you’re charged extra.
The next step is to figure out when the best times to trade gold. We learned from Forex trading that there is no need to sit in front of a computer trying to make trades 24 hours a day because it would simply be a waste of time. Instead, finding the most volatile periods in the markets will put you in a good position to make profitable trades and catch significant price changes. Within the day, volatility in the gold market picks up during the London session when the London Metals Exchange and Stock Exchange are open to trade. This is when the major traders start to buy the commodity in bulk and prices start to change significantly. Before the London session, the Asian session is usually quite dull as there aren’t many commodity exchanges in the region, or at least none that can match those in the Western hemisphere.
From then onwards, volatility remains high until the New York session when the New York Mercantile Exchange (NYMEX) is open for trade and other commodity exchanges in Chicago also open their doors. Overall, the best times to trade gold are between 12 PM and 5 PM (GMT). If you’re not available for trading during these times, then perhaps you won’t enjoy gold trading as much as other traders.
From day to day, the best days to trade are on Tuesday and Wednesday. Even in the Forex market, trading on Monday is usually unfavorable unless you know what you are doing. Markets will usually react violently when they open on Monday if there was any piece of news that occurred over the weekend, but you have to be skilled to catch it. We covered this strategy in another section, but it can also be useful in gold trading. On Monday, traders are still trying to get their bearings and establish the general trend for the week. As a rule, trends set on Monday generally don’t change in the middle of the week unless there is a significant change in global markets. As a result, not a lot of trading in gold occurs on Monday. Tuesday and Wednesday are the best days because the week’s trend has already been established and traders are now getting into action. You too can also get on the wagon and ride the trend if you have done your analysis well. Toward the weekend, there aren’t a lot of new positions being opened, so volatility once again drops as traders just keep an eye on their trades. It is still possible to get in on the action on Thursday and Friday, but then you would have missed the majority of the trend. (Discover the: Secret of Monday's Gap Trading)
Seasonal fluctuations in gold value
Gold's value exhibits specific seasonal patterns. Notably, from December to January each year, gold prices often trend upwards. This increase is largely attributed to the heightened demand for gold during the festive season, particularly for jewelry, which forms a major part of gold demand.
Additionally, as the year draws to a close and a new one begins, investors often revise their investment plans. Seeking to diversify their portfolios and hedge against potential risks in the upcoming year, many high-net-worth individuals buy substantial amounts of gold during this period, further boosting its demand and price.
In contrast, spring usually marks a downturn for gold prices, continuing into the summer. This decline follows the earlier spike and is often a market correction responding to the overvaluation caused by winter demand. The extent of this correction depends on the prevailing economic conditions. For example, a significant dip occurred in 2015 due to concerns over a slowing Chinese economy, a major consumer of gold. Conversely, a milder correction happened in 2017 amidst a booming global economy, and a similar trend was observed in 2018, possibly influenced by major economies accumulating gold reserves.
Following the spring correction, there's often a modest or flat increase in gold prices during the summer, driven by holiday season jewelry purchases. However, this summer spike is less predictable and less significant compared to the winter increase. Then, prices typically drop at the start of autumn in anticipation of the winter demand.
Despite the variability of these seasonal trends, traders can develop medium-term strategies based on these patterns. For example, looking for buying opportunities in winter can be advantageous, anticipating the upcoming price spike.
Currency correlations
This is yet another topic we covered in the Forex market, and a very powerful tool when you’re trading closely related assets. We can’t always watch all assets, but we can use the knowledge we have on one asset and use it on another with similar success. For example, the Australian and New Zealand dollars usually have the same pattern when observed on a chart. Knowing this, one only needs to study either of the currencies and still be able to make informed choices about the other. (All you need to know about Currency correlation and how to use it)
Gold exhibits correlations with various assets, both directly and indirectly. It shows a significant positive correlation with silver, as both metals often follow similar patterns. This correlation also extends to other precious metals like platinum and palladium, though palladium has recently experienced a notably higher demand. Beyond precious metals, gold is closely linked to the US dollar, Australian dollar, and Chinese yuan. The relationship with the US dollar is inverse; as the dollar's value increases, gold's value tends to decrease. This inverse correlation stems from gold's historical tie to the US dollar, which is now the world's reserve currency. When gold demand rises, it often indicates a high investment in US securities, suggesting a decreased interest in gold as a safe haven. This trend has been prominent throughout the year, with fluctuations in gold value corresponding to global events such as threats of trade or nuclear wars, during which gold's value typically spikes.
On the other hand, the yuan and the Australian dollar have a positive correlation with gold because these are both gold-producing countries. Since gold is quoted in US dollars, increased demand for the metal means better economic performance for the countries and thus a stronger local currency. Looking at a chart showing gold alongside either of the two currencies will be clear about this correlation beyond doubt.
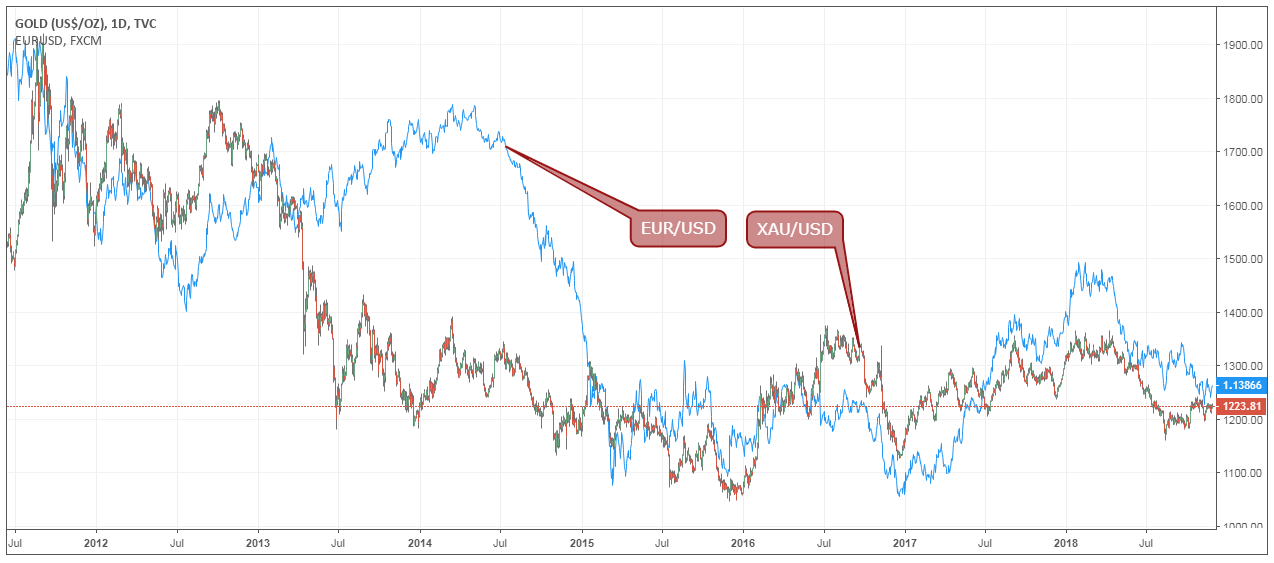
Once you can understand the position of gold as a safe haven and how it relates to other currencies, it becomes much easier to identify even more correlations between gold and currencies, commodities, and indices. Then you won’t have to do a lot of work when you can combine the knowledge you have and use it elsewhere. Say, you have been studying the chart of EUR/USD and find that the exchange currency is getting weaker, then you won’t even have to study an XAU/USD chart because you know they will be similar to the EUR/USD chart. All you will need to do is figure out where to place your stop-loss and take-profit before moving on to the next chart.
Technical analysis of gold prices
There is no asset you can trade without doing a lot of technical analysis. Even if your primary source of information is fundamental, it is still the technical analysis that will guide you on where you can anticipate prices to reach and place the appropriate price controls. With gold trading, the most important aspect of technical analysis is in identifying the long-term trends rather than the day-to-day shifts. This is because gold creates extended trends that last for days, weeks, and even months in a single direction. Through the past two decades, gold has been on the rise for most of that time, gaining in value from the year 2000 to its peak in 2011.
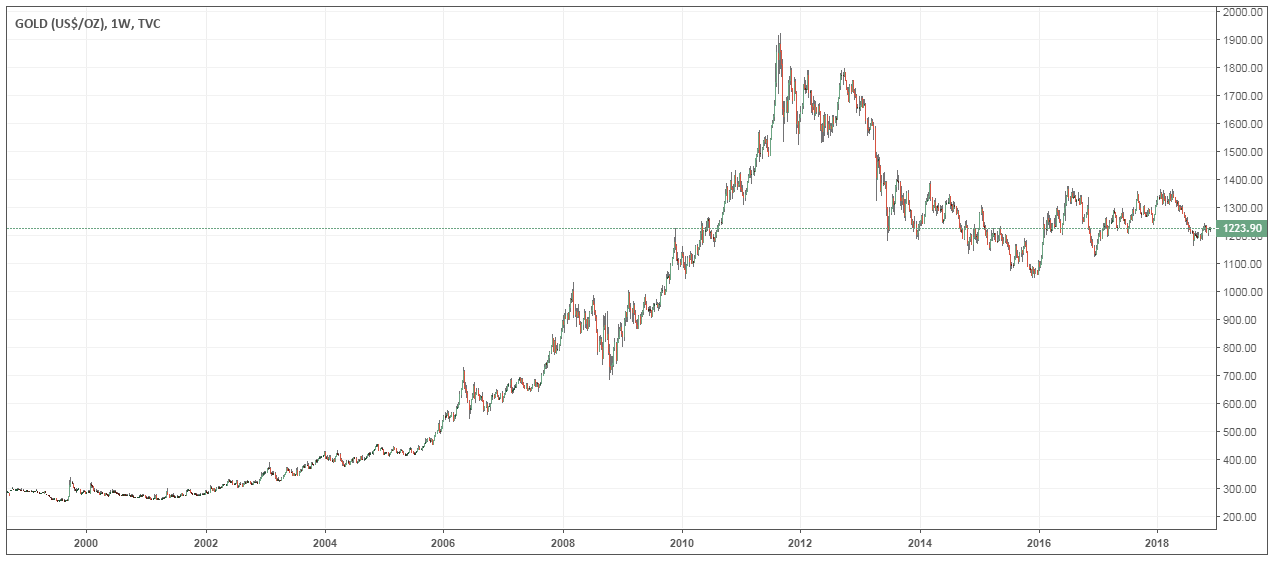
During this time, there were only a few downturns such as in 2008 following the global economic crisis. After its peak value, gold prices went sideways until 2012 when the value fell for four consecutive years until 2016 when again the prices went sideways until today. In these two decades, gold has only changed trend once when it changed from a downtrend to an uptrend. This creates remarkable reliability in gold as an asset to invest in and eases the process of technical analysis because once you can identify the direction of the trend, the rest becomes much easier.
The other unique thing about gold price charts is the rapid change of prices from one candle to another. Looking at gold cost charts on any timeframe, you will immediately notice how the individual candlesticks are usually long unlike those in a currency pair that is often short with only random candles being extremely long. This peculiarity in gold costs is caused by the low liquidity in gold markets as compared to retail Forex markets. In the latter case, the presence of many retail traders has made the market very liquid and because of so much trading occurring every minute, the costs don’t change by a huge difference unless there is some major news announcement on the Forex calendar.
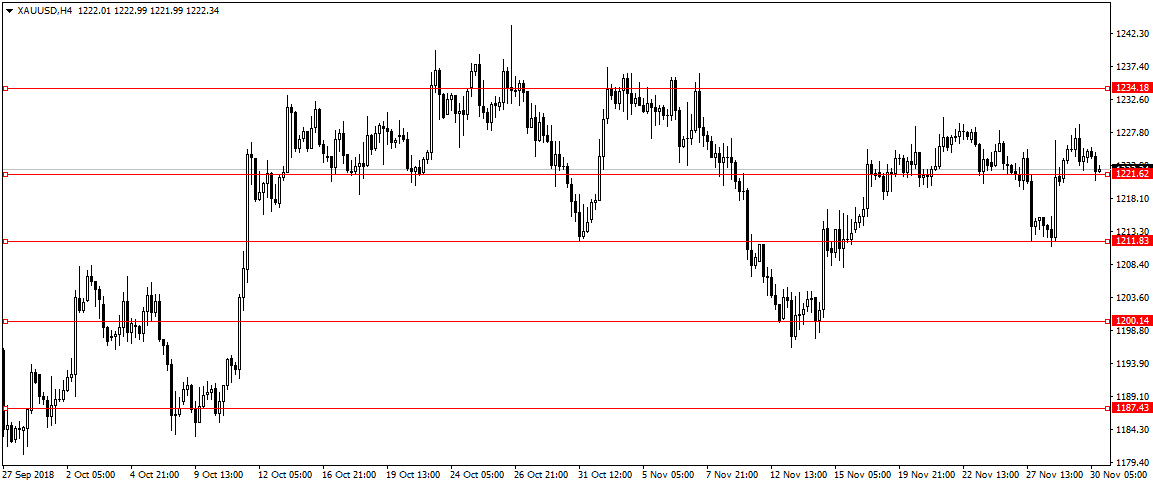
In the case of gold markets, they are not as accessible to retail traders as the Forex market because of the high margin requirement. While retail traders can buy actual currency pairs thanks to leverage provided by brokers, gold markets are often influenced by the gold futures in metal exchanges. Retail traders can only participate through CFDs, which only track the worth of gold rather than buying the actual metal. For example, gold futures at the Commodity Exchange (COMEX) in New York requires $3,400 in maintenance for 100 troy ounces of gold. These major players who buy the gold futures mostly use pending orders to buy the metal, and this creates a gap between different cost points. In the image below, we have marked a few of the major pivot points between which gold costs alternate. In between these levels, there is very little activity, indicating that traders usually place their pending orders there.
Factors that affect the worth of gold
If you’re going to be trading in gold, there are several things you have to keep in mind to guide you on your path. These are the factors that affect the worth of gold in a huge way and set the trend for gold worth.
Interest rate decisions by central banks
Central banks are in charge of regulating money stock within the country they operate. They usually do this by quantitative easing, which involves setting the interest rates at which they lend banks money. The interest rates affect the worth of gold because of opportunity costs. Opportunity cost refers to the idea of switching from a guaranteed investment, albeit little, to an investment with a higher return and higher risk. Following the global economic crisis, many developed economies reduced their interest rates to zero and even negative interest. That made conventional securities like bonds less profitable and gold much more profitable, raising the opportunity cost and luring investors to buy gold. This is why gold costs went on spiked from 2009 to 2011.
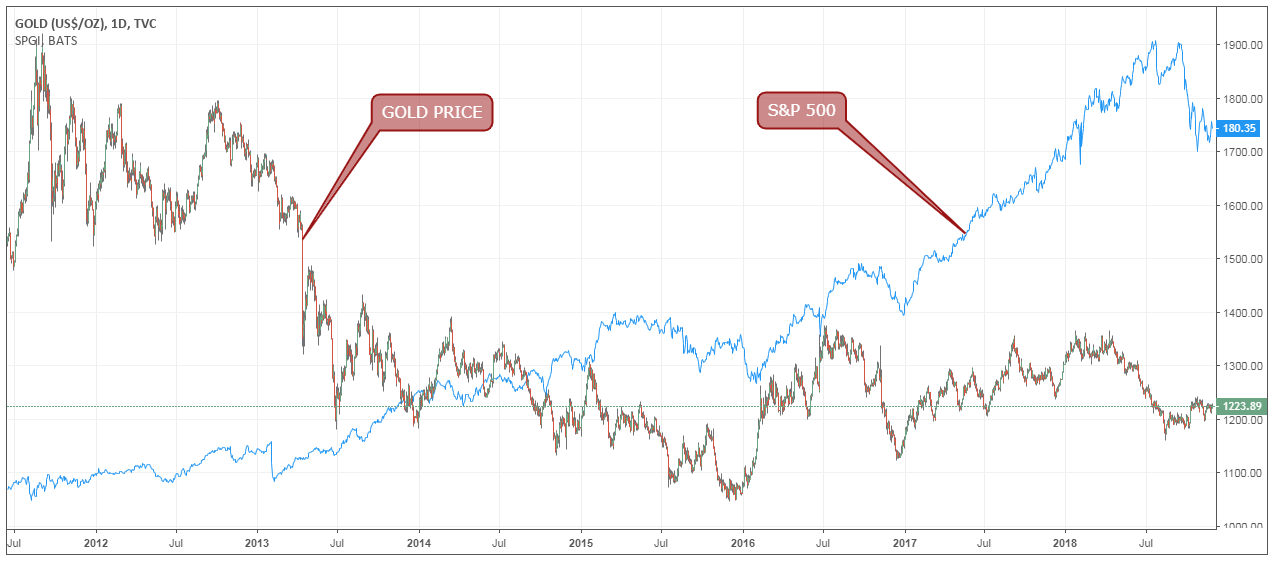
The US still holds the largest gold reserves and thus has the most influence on gold worth based on the FED’s interest rate decision. The FED’s meetings have had a direct impact on the worth of gold ever since the institution started to raise interest rates. From December 2016 to date, the FED has increased interest rates from 0.25% to the current rate of 2.25%. This effectively lowered the opportunity cost for switching to gold because other assets like stocks, bonds, etc. became wildly profitable. The image below is of a chard comparing the historical cost of gold against the S&P 500, where it is evident that one’s increase in worth coincides with the other’s decrease in worth.
The Federal Reserve (Fed) convenes approximately every six weeks to review and adjust interest rates. These decisions often lead to significant fluctuations in gold prices. For instance, when rates are lowered, gold prices typically spike, and when rates are raised, they tend to fall. This pattern was evident following the Fed's meeting on November 8th. Despite maintaining the interest rate, gold prices changed due to market interpretation of the Fed's stance as either dovish or hawkish. Following the meeting, Fed Chair Powell's remark that interest rates were "nearly neutral" suggested further rate hikes, leading to a decline in gold prices with expectations of a December rate increase.
For traders, it's crucial to understand the factors influencing the Fed's decisions. Inflation, the rise in the cost of goods and services, is a key consideration. While some inflation is necessary for economic growth, excessive inflation can devalue the currency, as seen in Zimbabwe and Venezuela. The Fed aims to regulate inflation through interest rate adjustments, ensuring it remains within an acceptable range.
Economic data, such as unemployment rates, GDP growth, and manufacturing output, also guide the Fed's decisions. For example, if the economy is struggling, the Fed might lower interest rates to stimulate spending and economic growth. Conversely, in a thriving economy, the Fed might raise rates to prevent currency devaluation. Under the Trump administration, the positive economic data in the U.S. led the Fed to increase interest rates.
The Federal Open Market Committee (FOMC) considers these factors in its meetings, but traders should also pay attention to other economic data released before these meetings. This data can offer insights into the Fed's potential interest rate decisions. Recently, inflation rates dropped more than expected, from 2% in September to 1.8% in October, suggesting that the Fed may not raise rates further this year despite previous hawkish signals. Understanding these dynamics is crucial for effective trading strategies.
Gold mining and production
Getting most precious metals usually involves a complicated process of mining and refining, but gold is different. Due to its nature as unreactive, it can be found in huge amounts concentrated in specific areas, and that makes it easier to mine than most other precious metals. If the gold deposits are concentrated, it could even be possible to use a simple pan to separate the gold nuggets from rocks as is common in areas like Ghana. Larger deposits found deeper in the ground would need the digging of tunnels, but the process is still fairly simple. The main problem with gold mining is in locating the gold deposits themselves because afterward, the process is very simple. According to the World Gold Council, the total amount of gold ever mined by 2017 was 187,200 metric tonnes. Going by the worth of gold at the time of $1,250 per ounce, that would put the total worth of gold above $7.5 trillion.
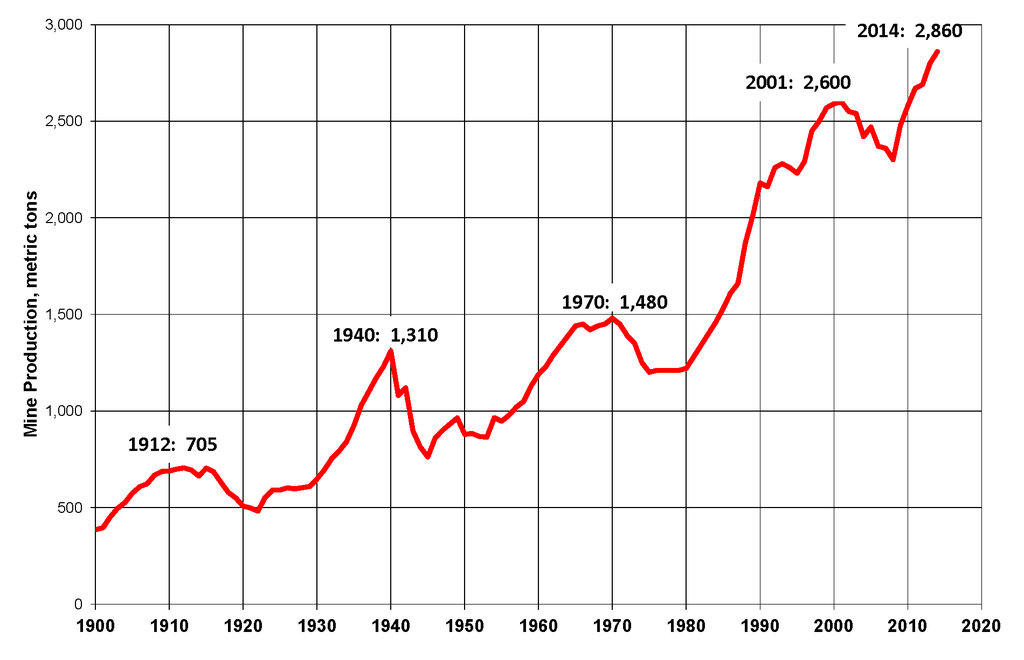
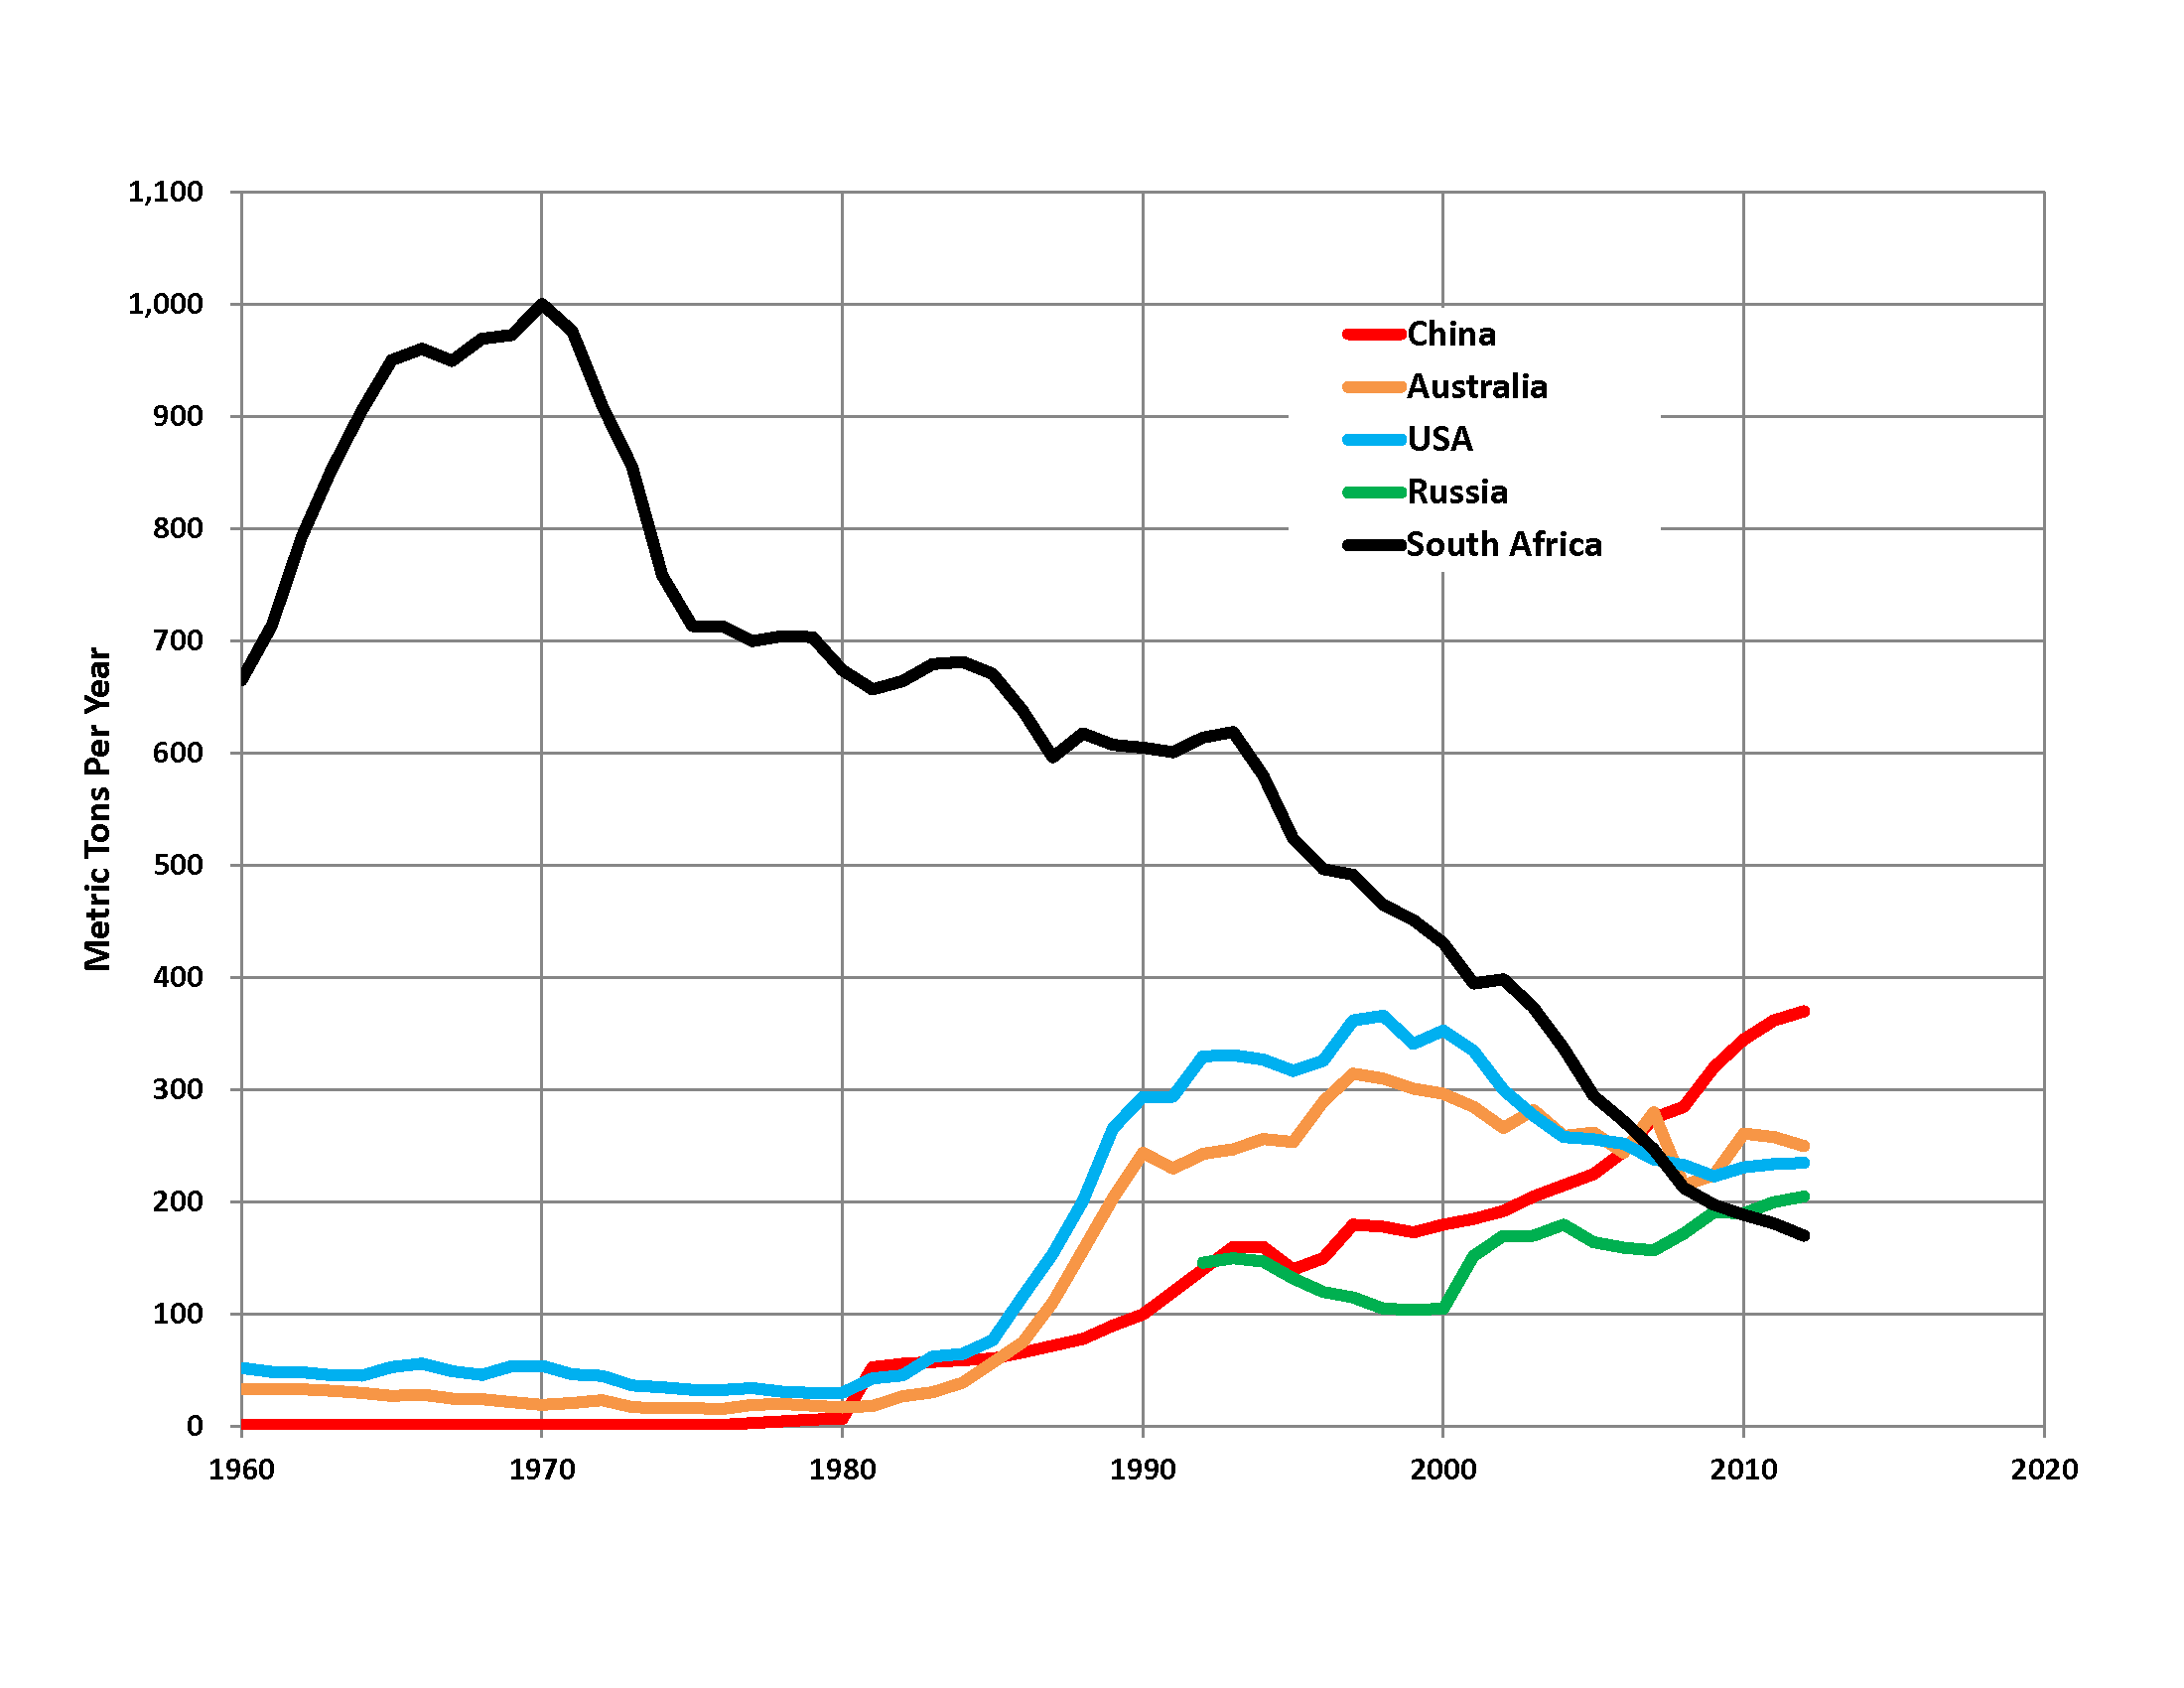
Initially, large gold deposits had been located in South Africa eventually reaching a peak in 1970 when the country produced 1,000 tonnes of gold per year. By July this year, the Mineral Council of South Africa declared that 75% of their gold mines had become unprofitable because there were few gold reserves left. Now China is the world’s top producer of gold and they even raised their gold reserves by 57% from 1,054 to 1,658 metric tonnes in 2015. This means that China’s place as a gold producer is not likely to change any time soon. Second to China is Australia whose gold reserves are also remarkable and could potentially exceed those in China. In third place is the United States followed by Russia and a rapidly dwindling South Africa. (Learn To Trade The Forex Market Through Analysing Stock And Request)
Okay, so why learn about gold mining? Because the goings on in the countries with the highest gold production can affect the worth of the commodity. Since China is the leading producer and is expected to remain so shortly, it has the most influence on gold costs worldwide. Looking at the chart of live gold costs below over the past few years, you can see a direct relationship between the Chinese economy and the worth of gold. Except for the exception in 2015, the values of the Shanghai Stock Exchange Composite Index and gold costs have been following the same trend.
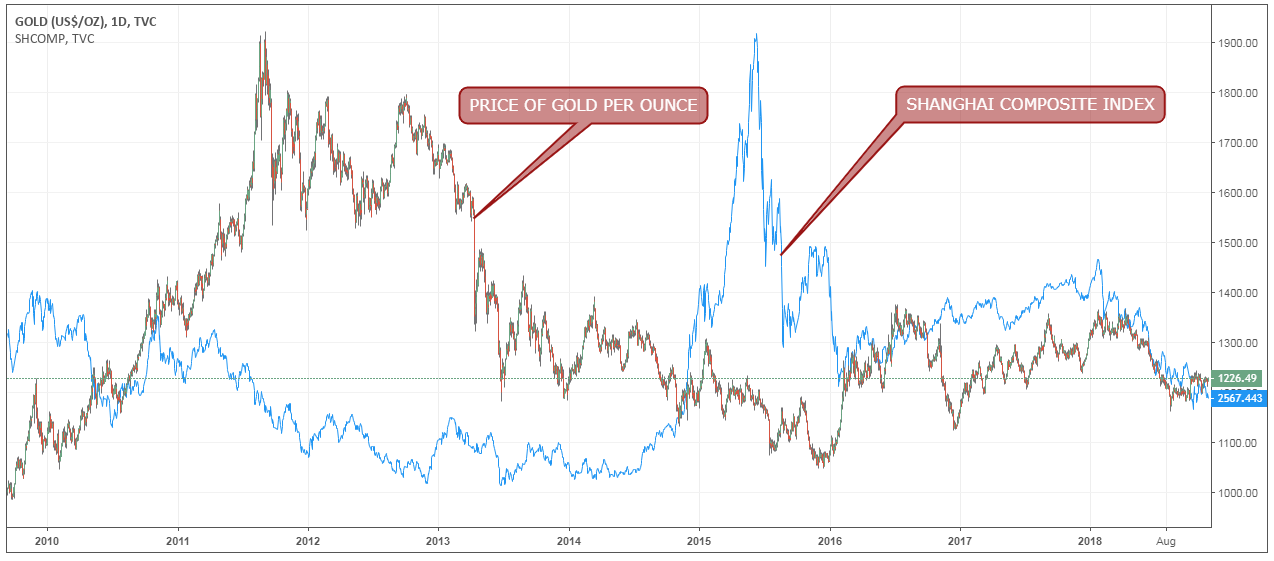
Why is this so? This is because, since China produces the highest amount of gold worldwide, most of it is consumed locally and not exported. Indeed, China is also the top consumer of gold, followed by the US and India. Gold reached its peak worth in 2011 because of rising requests from China as the country’s economy grew astronomically. Since 2011, China’s economy has been slowing down, and the request for gold by locals has also decreased. In 2015, there was an economic slowdown in China that exacerbated the problem, but gold worth increased because investors rushed to invest in gold as a haven.
Knowing the sources of gold can also help you evaluate macroeconomic trends in gold costs because of stock and request – higher stock means lower costs. When China raised its estimated gold stocks by 57% from 1,054 to 1,658 metric tonnes in 2015, this caused gold prices to fall dramatically because of the increased stock. The opposite happened when South African mining companies were shut down, although it did not have a huge impact as the country no longer leads in gold production. All in all, it is important to know the countries that produce the most gold and to be aware of the goings on in those countries so that you can predict whether the value of the commodity will go up or down. Just remember that this knowledge could mean long-term trends in the markets, and that is a good opportunity for position trading. (Everyone should: Learn How To Use Position Trading In The Forex Market For Profit)
Gold stocks by country
Although the gold caliber was abolished in 1976, central banks around the world still stock up on gold and keep it in their stocks. They do so during times of economic instability and feel like they need to invest in more secure assets like gold. An example is Russia which has been buying up gold from the open market aggressively all through the year. In 2008, gold stocks in Russia’s central bank were less than 500 tonnes, but the amount increased to 1,944 tonnes by June 2018. At the same time, Russia was dumping US securities like T-bills, bonds, and notes which were considered riskier in the face of trade wars and other geopolitical instabilities. Russia has not been the only country stocking up on gold as China and India have been doing the same too.
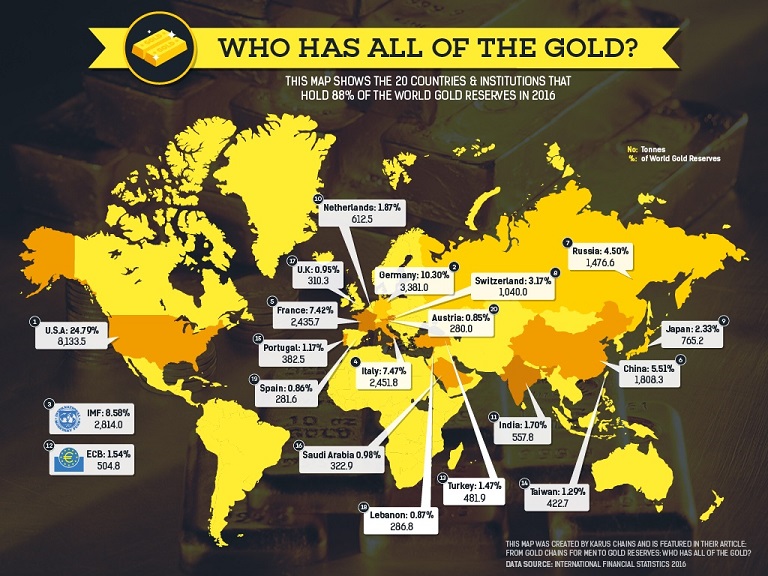
Following the accumulation of gold stocks by Russia, the country made it to the top 5 countries with the largest gold stocks, and it may even have the third largest stocks if they continue to buy gold. The move to increase gold stocks is meant as a move to buy gold while prices remain low. According to Goldman Sachs and Goldcorp, one of the world’s largest gold mining companies, the gold stock is expected to decrease significantly. The consensus is that gold production will fall to the levels seen in the early 2000s and that gold stocks would be exhausted by 2034. Countries are now stocking up on gold in anticipation of this day when the value of gold will spike after stock decreases. Add to that, there is the fear that the US will be unable to repay its debts if countries return US securities.
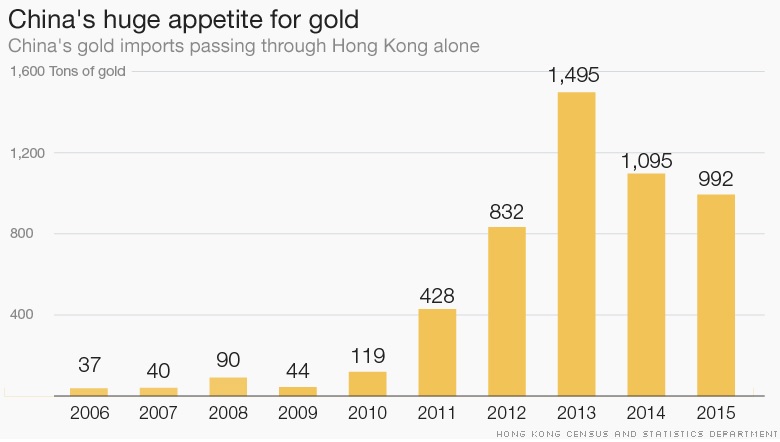
When countries stock up on gold to build their stocks, they also take it away from the open markets thereby decreasing the stock. Market forces then increase the value of gold because of the low stock. You can see the effect of countries piling up their gold stocks by comparing the value of gold with the graph below representing China’s gold-buying spree from 2006 to 2015. It is clear that as China depleted its global gold stock, the value of the shiny metal also rose proportionally. Then again in 2016, China extended its gold buying, and once again the metal’s value rose all through the year.
Countries usually increase their gold stocks to increase their ‘global power’, and China succeeded in doing so back in November 2015 when the yuan was included in the IMF Basket. This elevated the currency to stock currency status. Interestingly, Canada has been doing the opposite by selling its gold stocks. The country had 1,088 tonnes of gold in 1955 but now there remain just about 77 ounces, probably all taken up by China, India, Russia, and the like. These strategies of buying gold to ramp up stocks can also affect trends of gold prices as we have seen in the examples above, and being aware of gold stocks can give you an idea of the overall trend.
You may be wondering why gold prices have been falling all through the year despite gold buying by Russia and other countries, but that can be attributed to central banks artificially manipulating the prices. The World Gold Council reported that stocks of gold worldwide had risen to $12 trillion in 2012 from $2 trillion in 2000, but some have disputed these figures. One entity is the Gold Anti-Trust Action Committee (GATA) which was created in 1998 by Chris Powell. He states that Western central banks have been overstating the amount of gold they have to keep gold prices low and stimulate their other assets like bonds, stocks, etc. This could explain why the countries mentioned above have been stocking up on gold and why prices have continued to decrease over the years.
Global trends
While the US has a lot of influence on gold prices thanks to its large stocks, there are still other economies that play a hand. Here, anything goes as long as it is significant, and it all comes down to the level of uncertainty it brings. One notable example of such an event was the Brexit vote reached by the UK after a referendum. By choosing to opt out of the EU, the UK had thrown a wrench into the European economy causing a lot of uncertainty and panic. Many companies would be affected by the decision, and so would the countries that relied on bilateral trade deals. As usual, investors swarmed toward the only haven they could turn to – gold. Once again, the Brexit vote lowered the opportunity cost of investing in European assets and made gold very lucrative.
Similar reactions in gold prices can be noted through such events as the US presidential elections, German elections, France elections, Dutch elections, trade wars between the US and China, threats of nuclear war between the US and North Korea, and so on. Every time something happened that threatened conventional assets, gold had always shown an increase in value commensurate to the event that had occurred or was anticipated to occur.
Use of gold in industry
Gold is not only used as an asset to hedge against risk in the markets, but it also has actual uses in the real world. The most obvious use is in jewelry, and this indeed accounts for about 75% of the request for gold. Gold is seen as a status symbol in China and India, therefore it is in high request in these and many other countries. As you would expect, people buy gold jewelry more when the economy is thriving and they have money to spend and vice versa. This explains why the price of gold usually increases during the December holidays before slowing down in the spring and picking back up in the summer. Other holidays like the Chinese New Year holiday, Diwali in India, etc. all have an impact on good prices.
By keeping an eye on the festive seasons and holidays around the world, it can be possible to formulate short-term trading strategies in gold. You have to be careful when doing so, though, since only the world’s largest gold consumers are capable of driving prices higher. Fortunately, this creates a cycle that can be predicted year after year. Besides jewelry, gold is also used in industry to make computer chips and other electronics like GPS systems and medical devices like heart stints.
US dollar value
Even the value of the US dollar itself should be a factor to consider when trading gold. Most of the time, the US dollar becomes stronger when the FED raises interest rates as has always been the case. For example, when rates are higher, US securities become more favorable over those in economies with lower interest rates like, say, Germany where the ECB has still retained 0% interest rates. That is because international investors buy more US securities, which have to be bought in dollars, thus increasing the request for US dollars and consequently raising the currency’s value.
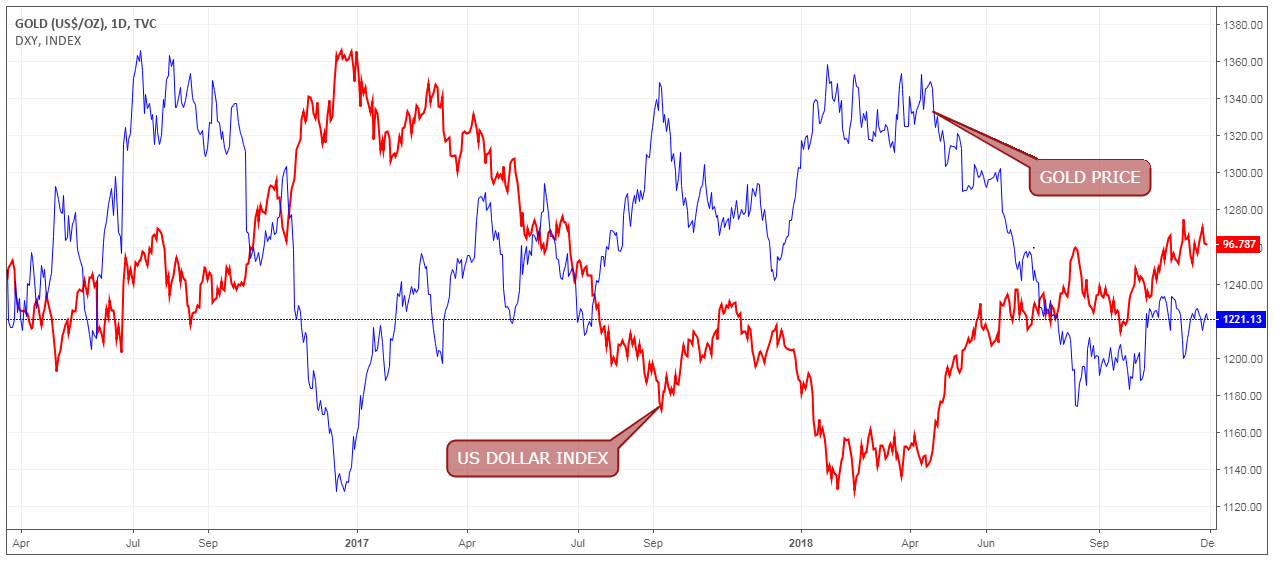
The strength of the US dollar is represented by the US dollar index which compares the currency to a basket of other countries. This index has always been inversely proportional to the value of gold for most of history. 2017 was an unusual year, though, because both the value of gold and the US dollar both kept rising throughout the year. This is unusual, but not completely unheard of. Last year, the phenomenon occurred because there was a lot of global uncertainty surrounding the elections in Europe and Brexit that both contributed to the growing request for gold. At the same time, the US economy was thriving, and so both the DXY and gold values kept rising. However, the two are indirectly proportional most of the time, and you can use the change in one’s value to predict how the other will react.
Gold trading strategies
Just like in any other market, you have to come up with a strategy to follow to make consistent profits. When it comes to gold, you can either go for short-term or medium to long-term trading strategies. Fortunately, gold is versatile enough to cater to either need while still being profitable.
Short-term trading strategies
These are those systems that rely on a trader working with the 4-hour chart and below, hoping to open and close a trade within the day. The advantage to this is that, as mentioned in a previous section, gold prices shift rapidly from one pivot point to the next, creating some wonderful opportunities even on short timeframes. On the other hand, sometimes there may be a lack of trading opportunities when prices remain flat for a long period and these can be dull moments. The first thing to take note of is the aforementioned pivot points. Whether it’s on a longer or shorter timeframe, these pivot points will become the key to successful gold trading because a lot of pending orders are placed at these levels by the major players. (Find out: All you need to know about pivot points)
Once you have identified these pivot points, the next step is to determine when the trends might change in one direction or the other. My favorite tool in the gold market is analyzing candlestick patterns. In the image below, we have marked the support, resistance, and pivot point levels in the XAU/USD market on an hourly timeframe. (These are the: 7 Powerful Candlestick Patterns to Learn and Understand)
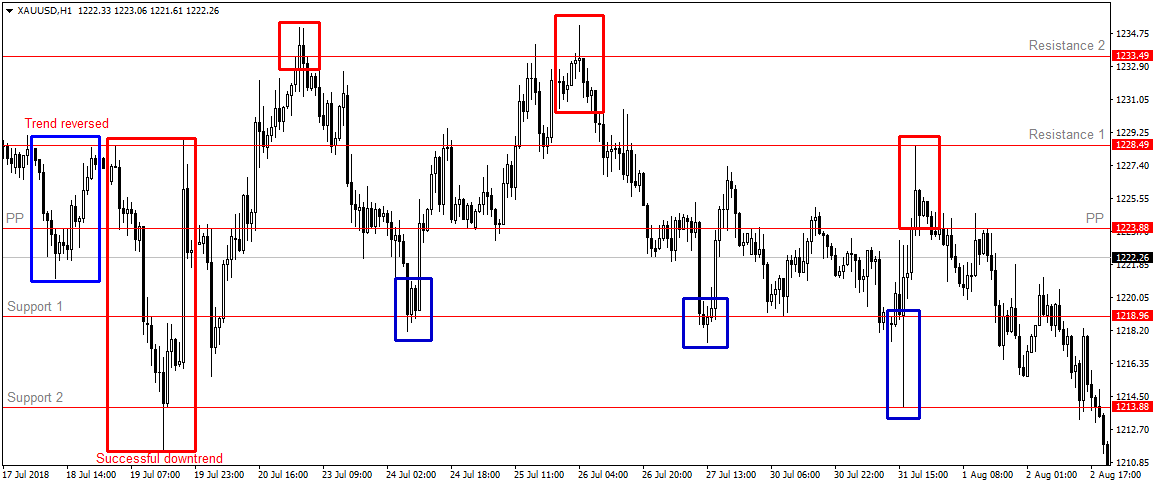
The charts begin in a downtrend attempt to break through the pivot point but fail and prices rebound to the first degree of aversion. The reason for the trend reversal was probably because there were no candlestick patterns that signaled there was a bearish sentiment at the start. Add to that, some doji candles were formed at the pivot point, showing that the markets were undecided. However, after reaching the first degree of aversion, we see the formation of a shooting star candle that usually signals the end of an uptrend. Surely, the trend goes down and this time breaks below the pivot point heading toward the first foundation degree. (Learn: How to draw S/R degrees like a pro)
Another doji candle forms here, but this time instead of causing a reversal extended the downtrend to the second degree of aversion. At this point, we note that the final bullish candle created a very long shadow/wick followed by a bullish engulfing candle. Both of these are strong measures of an uptrend, and it is indeed what happened thereafter. This uptrend was also reversed by a similar candlestick pattern at the first degree of aversion.
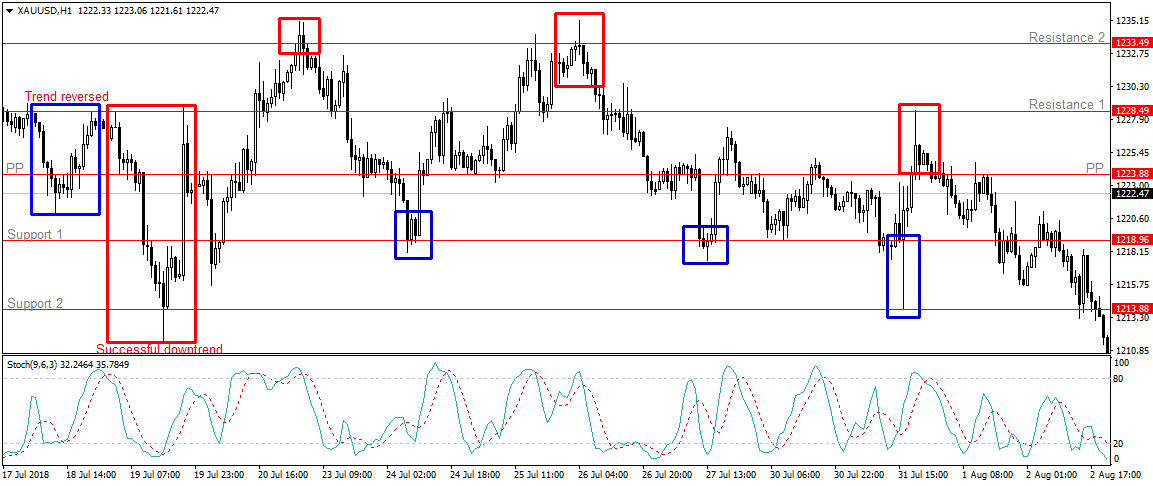
Throughout the period represented in the above chart, the prices of gold remained within and kept bouncing in either direction between the foundation and aversion degrees represented. The most significant candlestick pattern was the creation of the long shadows that indicated a reversal in the pre-existing trend. By using this tool in conjunction with the pivot, foundation, and aversion degrees, it is possible to create a very effective short-term trading strategy that captures the changes in gold prices. To make it even more effective, the addition of a swinger like the stoch measure could be useful in confirming the candlestick patterns. In the image below, you can see how the stoch swinger confirmed both successful and unsuccessful trend reversals all through the range. (Learn how to use the stoch swinger by studying the: Best technical measures and how to use them)
Apart from just initiating the trade, you could use the same candlestick patterns to set price degrees. After a candlestick pattern is created that signals an uptrend through a long shadow at the bottom, you can use this candle to place your stop-loss degree such as was the case in the left region marked in a red rectangle. For the take profit in an uptrend, counting two or three previous candles higher is usually standard on a typical trading strategy with a 2:1 profit ratio. If the trend continues strongly, you can eliminate the take profit and use a trailing stop or just shift the stop loss manually upwards as the trend continues. (Look at some: Uncommon technical measures)
There may be other trading strategies for gold in the short term, but this is my favorite because it is simple to understand and apply in any short timeframe from H4 downwards. All the same, I would not recommend using it on any timeframe lower than M15; gold markets may be volatile, but at that timeframe, it is very difficult to identify the pivot points.
Medium and long-term trading strategies
A medium-term strategy is one that typically involves closing a trade before the weekend or holding it for a few weeks. Meanwhile, a long-term strategy is one where you hold on to a trade for weeks, months, or even years. Regardless of what you prefer, the main idea is to identify trends in the markets that might stay in place for a long time. The good news is that gold usually holds a single trend for years, and it is not too difficult to find these trends. My favorite tool for spotting long-term trends is the trendline. Many traders ignore trend lines for more exotic tools but I’ve found this to be a sufficiently effective tool when trading gold. (All you need to know about Using trendlines in your Forex trading strategy)
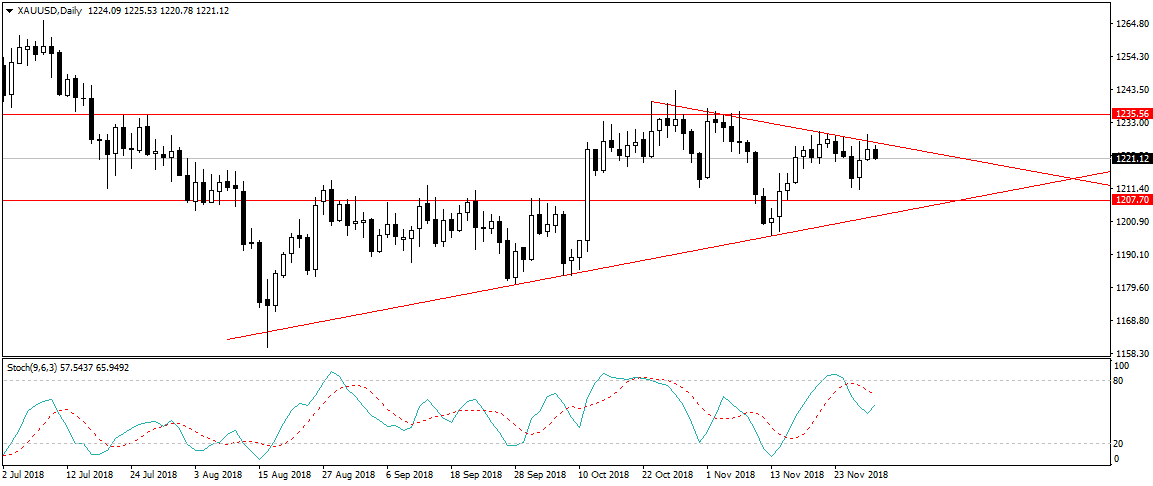
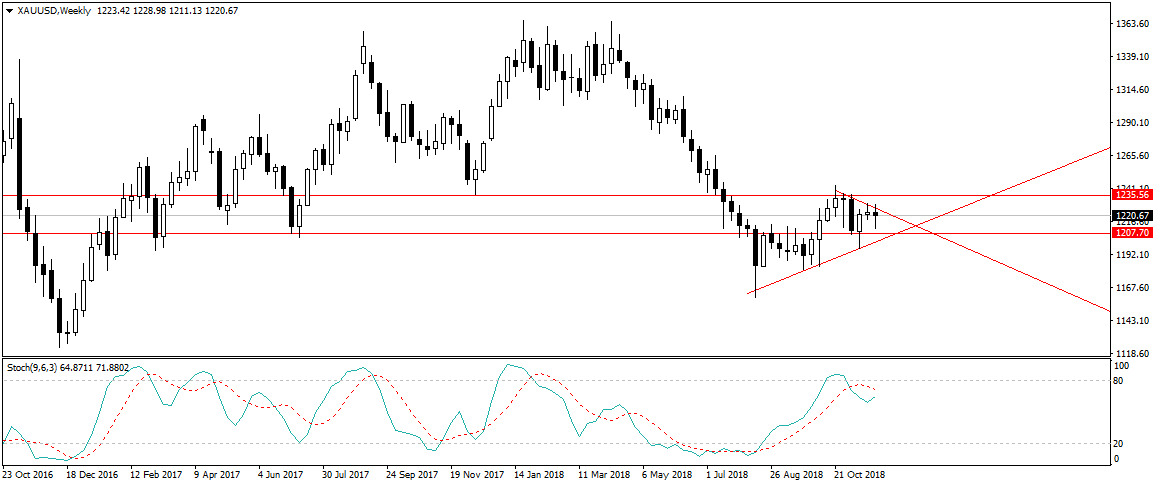
The image above represents the XAU/USD markets set to a daily timeframe. On it I’ve drawn two trendlines, one going up and the other, down. Those by themselves could give you a general idea of the long-term trend, but it is always recommended to use some complementary measures. Once again, I’ve used my favorite, the stock, and added two pivot point degrees. The first thing you will notice is that the trend had been going up for two consecutive months from August to October, but then the trend seemed to reverse. These two trends have been marked by opposing trendlines and they have thus created a triangle. The formation of a triangle is a strong signal that there is a breakout coming, and that is what I am currently waiting for. To find out which one is more likely, the stoch measure comes in handy. (Everything about the: Triangles Forex trading strategy)
The measure shows us that the upward momentum is probably over because the markets have been overbought, therefore we can expect the prices to go down for the next few days. Once prices reach the foundation degree, we should then look to the stoch for signs of a reversal upwards or a breakout below the trendline to the downside. Right now, it is still too early to tell which direction is certain, but a look at the weekly charts could give us a hint. From the weekly chart below, we can tell that bullish momentum is dwindling because markets have already been overbought as seen on the stoch. Therefore, it is most likely that prices will break out to the downside of both the trendline and the foundation degree in a few days.
The above is an example of a medium-term trading strategy that lasts only a few weeks, but you can use the same principles in an even longer-lasting trade strategy. The only difference is that then you would be using the trendlines and stoch swinger to determine whether the trend is slowing or proceeding in the same direction to anticipate the reversal.
Wrapping up
We have now covered all the important information you need to know about trading in gold markets and even a few strategies. More trading strategies can be found in detail in our Forex strategies section. Although these are meant for trading currency pairs, the same principles can be used even in the gold market. That’s it! Now go on and give these strategies a try, we promise you will be impressed by the results.
If you're interested in trading in gold markets, don't miss out on our best Forex Broker for trading gold list. For more top brokers, make sure to check out our Alfa Forex, RoboMarket, and Exness reviews.
If you still need some more advice on gold trading, why not get it from one of the best investors of all time, Warren Buffet, in this short video: