 Alpari
 XM
XMFew concepts in financial markets are as commonly used and effective as support and resistance (S/R) levels. By now, I am sure you know what S/R levels are, and I will not insult you by defining what they are, as if to amateurs. You came here to be a better S/R artist, and that is exactly what you will learn.
How to draw S/R levels properly
Knowing how common S/R levels are, you would assume that it would be the first thing any trader learned, but it’s not so. Many traders still don’t know how to draw S/R levels well enough, and that can be disastrous as we’ll see later. If you follow these steps, though, your S/R levels will be very similar to those on the big players’ real-time Forex charts.
Start with a clean chart
The first step is to delete any other indicators you may already have on your charts. These may disrupt your analysis of the charts and perhaps lead to incorrect S/R level placement. Depending on the Forex trading platforms you’re using, the process of deleting indicators will vary. On MetaTrader, you can delete other indicators one by one by double-clicking and pressing the ‘Delete’ key, or you can right-click within the chart and select the options highlighted in the image below:
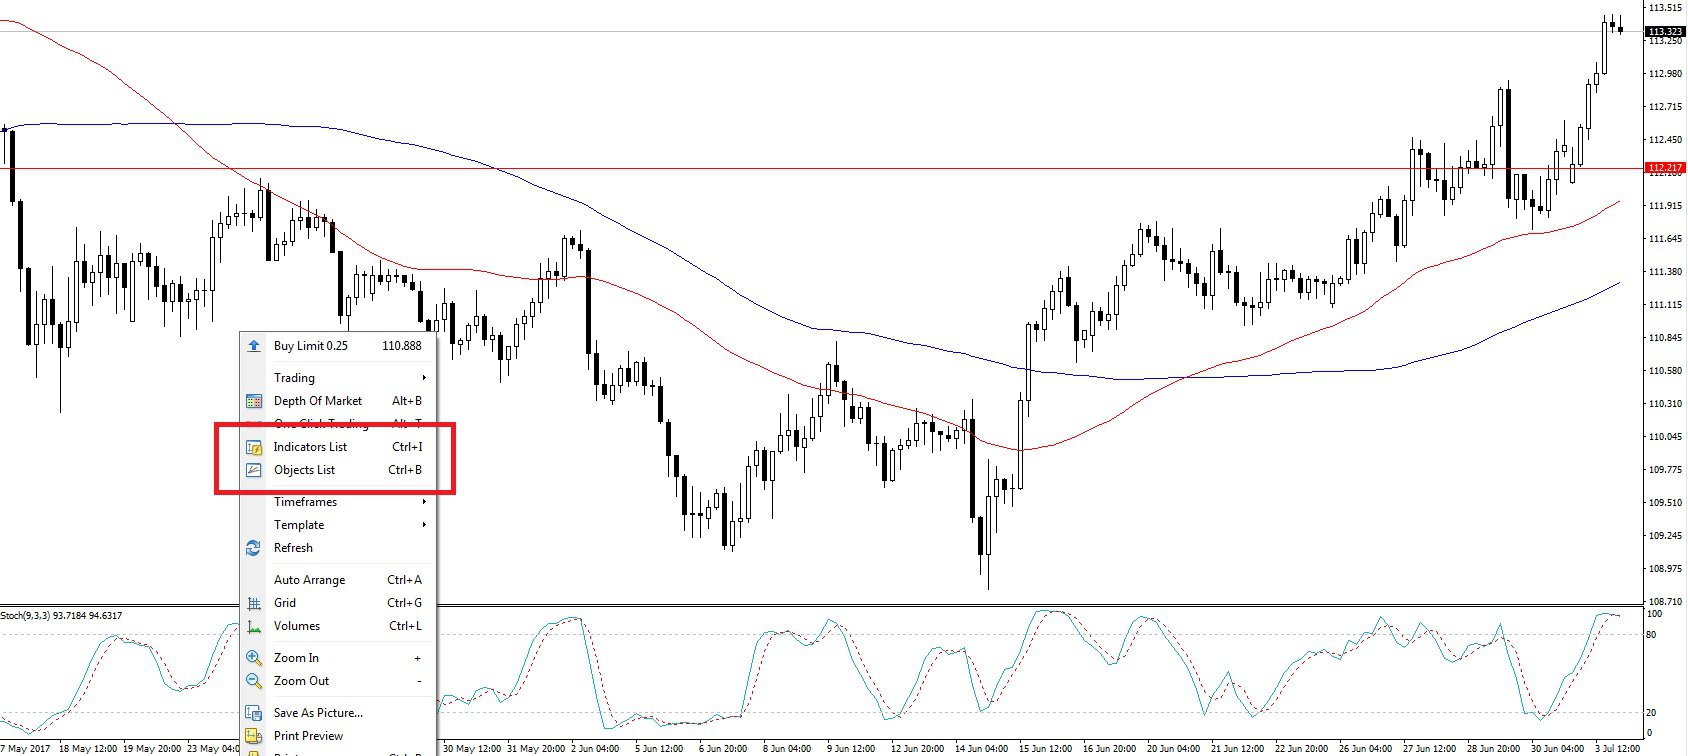
Once you have a clean chart, it will be easier to note areas where prices bounce off and act as S/R levels.
Add key S/R levels
Key S/R levels will be the strongest points where prices are unlikely to go past. For example, the key support level will be where prices have repeatedly been unable to go below for a very long time. You want to have these levels because they will tell you how much farther prices may go up or down.
In my case, I prefer to trade the 4-hour charts, but this timeframe is not suitable for establishing key S/R levels. What I do is move one timeframe higher to the daily chart and draw key S/R levels from there. So, for those who trade the 1-hour chart, shift to the 4-hour chart and do the same. As for lower timeframes, 1-minute, 5-minute, 15-minute, and 30-minute charts, the 1-hour chart would be most suitable. I don’t recommend drawing S/R levels with any timeframe under one hour.
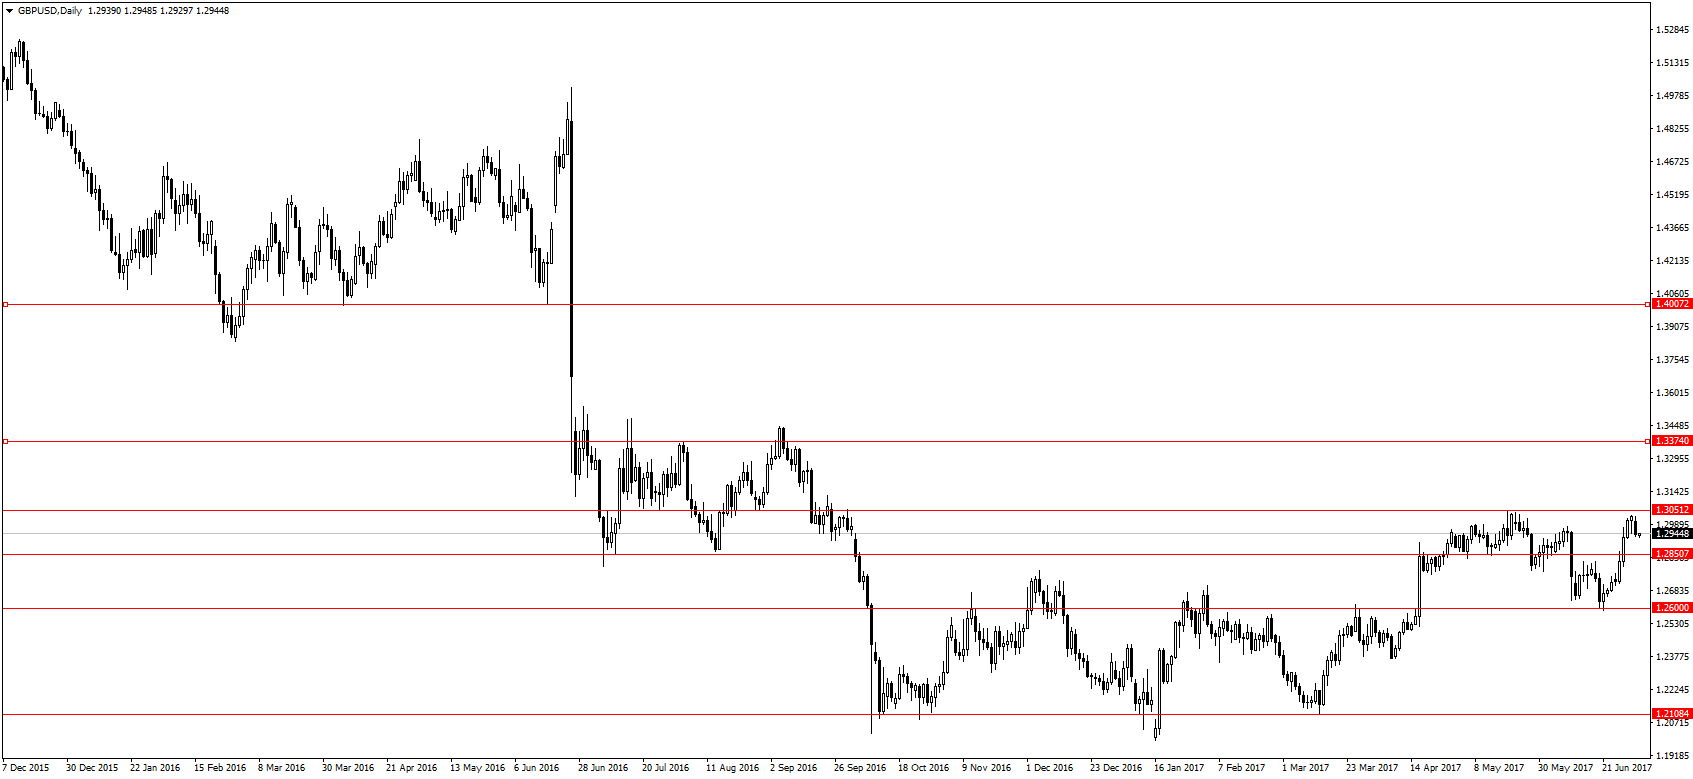
Above is an image of the GBP/USD pair on the daily timeframe with the S/R levels plotted. Moving back down to my 4-hour chart, these would be my key S/R levels.
Add near-term S/R levels
The near-term S/R levels are a lot like pivot points, and they will be found in between the key S/R levels. At near-term S/R levels, more traders either enter or exit positions, making them crucial markers. For example, traders may enter positions at the near-term S/R levels once they realize prices may keep moving until they hit the key S/R levels. Therefore, these near-tern S/R levels will provide suitable entry/exit positions.
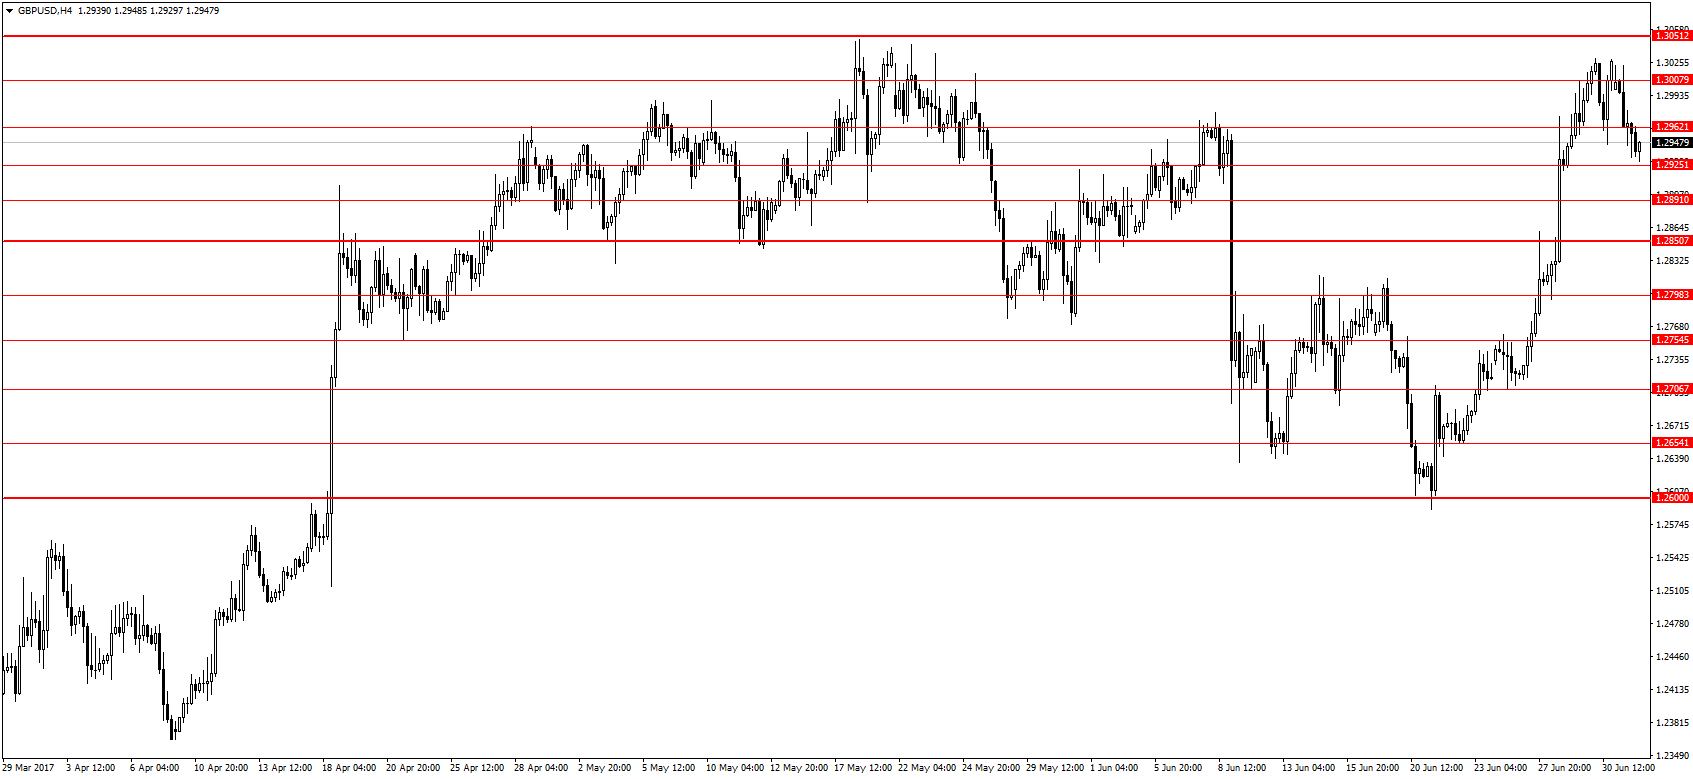
The above chart represents the same GBP/USD pair now on the 4-hour chart and the near-term S/R levels plotted. With these on your chart, you now have all the S/R levels you need to start trading.
Now that you have drawn your S/R levels, it’s time to trade the markets. (Pivot points strategy)
Why are S/R levels so effective?
The thing that makes S/R levels so effective is that they reflect market prices where the most trading activity takes place. Imagine if markets were in an uptrend, at some point, some traders with long positions are going to close those trades, either manually or through pending orders. The main players in the markets use pending orders to secure the intended profits according to their risk model. (Risk-management on Forex)
To determine the ideal price at which to exit the trade, these traders look to previous S/R levels. If enough bulls close their positions at a particular price, then an uptrend is going to end, and a reversal begins. This process thus creates a level of resistance, and vice versa for a downtrend.
S/R levels are so effective that it takes a major change in market sentiment to break them, as you can see below: (Fundamentals of fundamental trading)
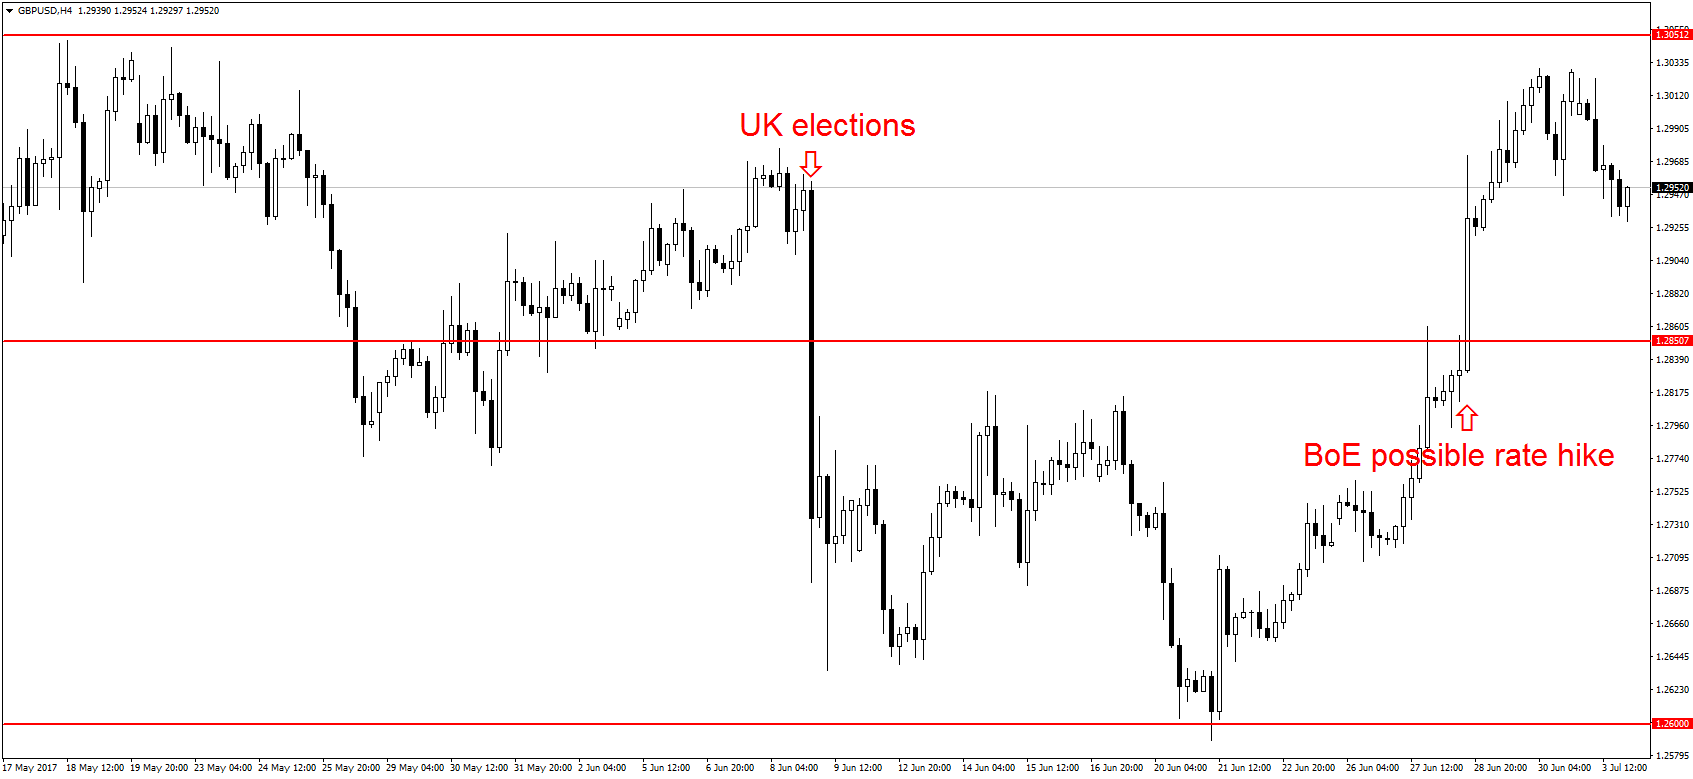
Only major news announcements are enough to break through the key S/R levels, showing just how effective they can be in trading.
Tips on drawing S/R levels
These are just a few additional tips to help you in becoming a better S/R master and to make your job easier. I understand how precious time is, and these tips are meant to save you some time and effort.
The levels will be around rounded figures
You will notice from the S/R levels I drew above that they are found in rounded numbers like 1.26, 1.30, 1.27, and 1.28. This is not a coincidence, and it should tip you off to key S/R levels. It is very unusual to find S/R levels at areas with a lot of decimal places like 1.27893, and if yours is there, then you might consider moving it toward a more rounded number.
As we mentioned earlier, S/R levels are effective because these are the areas around which most traders either open or close orders. Imagine yourself placing a pending order with Forex trading brokers, it would be more likely you would do it at a rounded number like 1.27 instead of 1.27893. You are not alone, and this is why S/R levels will be at more rounded numbers.
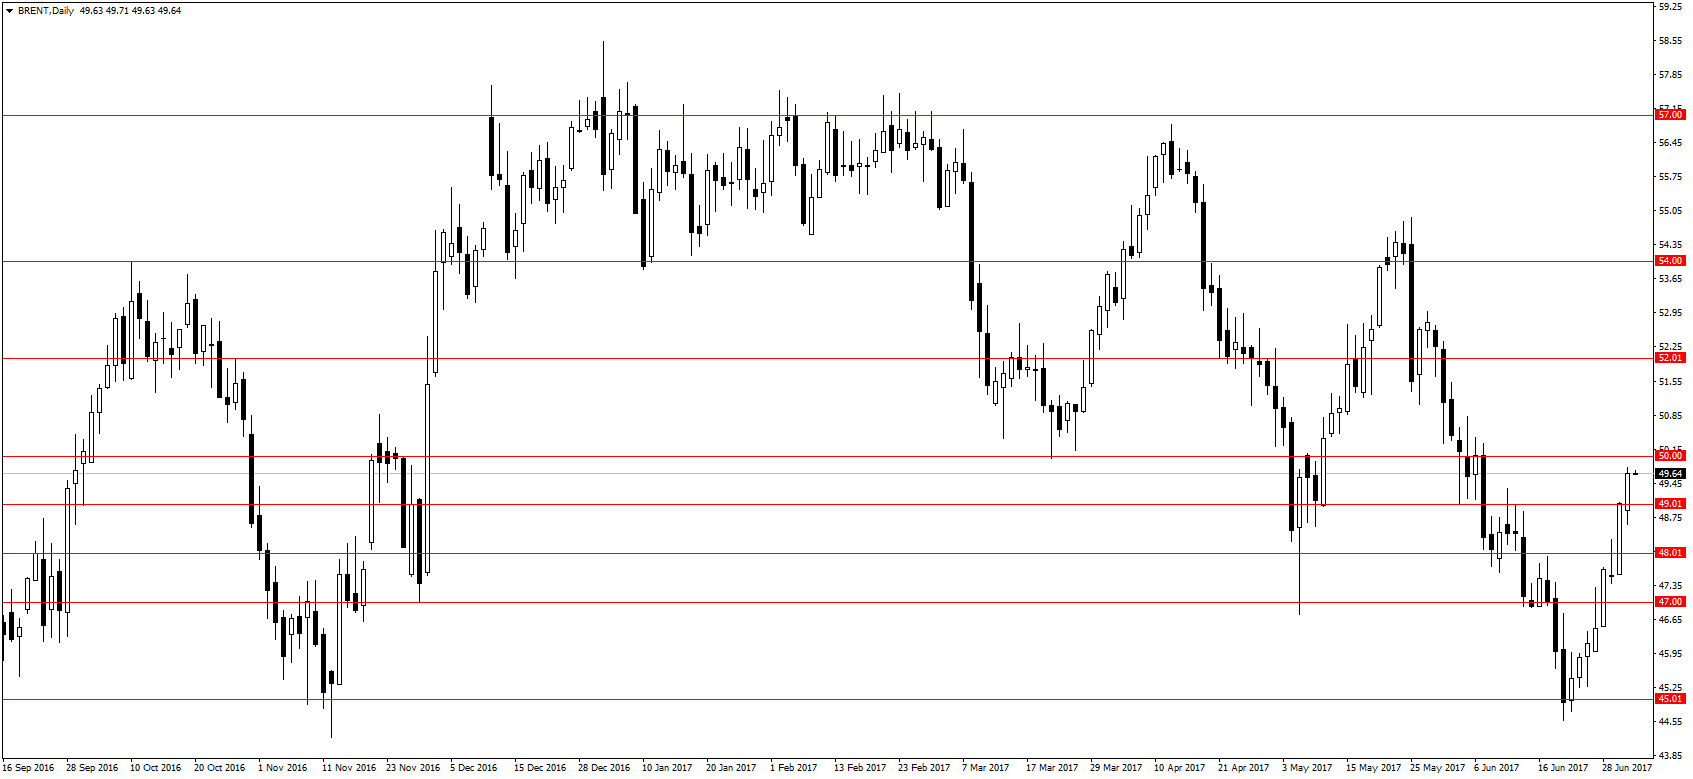
This principle is even more powerful when you’re dealing with other trading instruments like stocks and commodities, where traders will have pending orders at exact numbers. Below, S/R levels for Brent crude oil can be seen at exact numbers like 50, 45, 57, etc.
Now, this does not mean that you should aggressively move your S/R levels toward a rounded number, but try to make it as close to one without destroying its integrity.
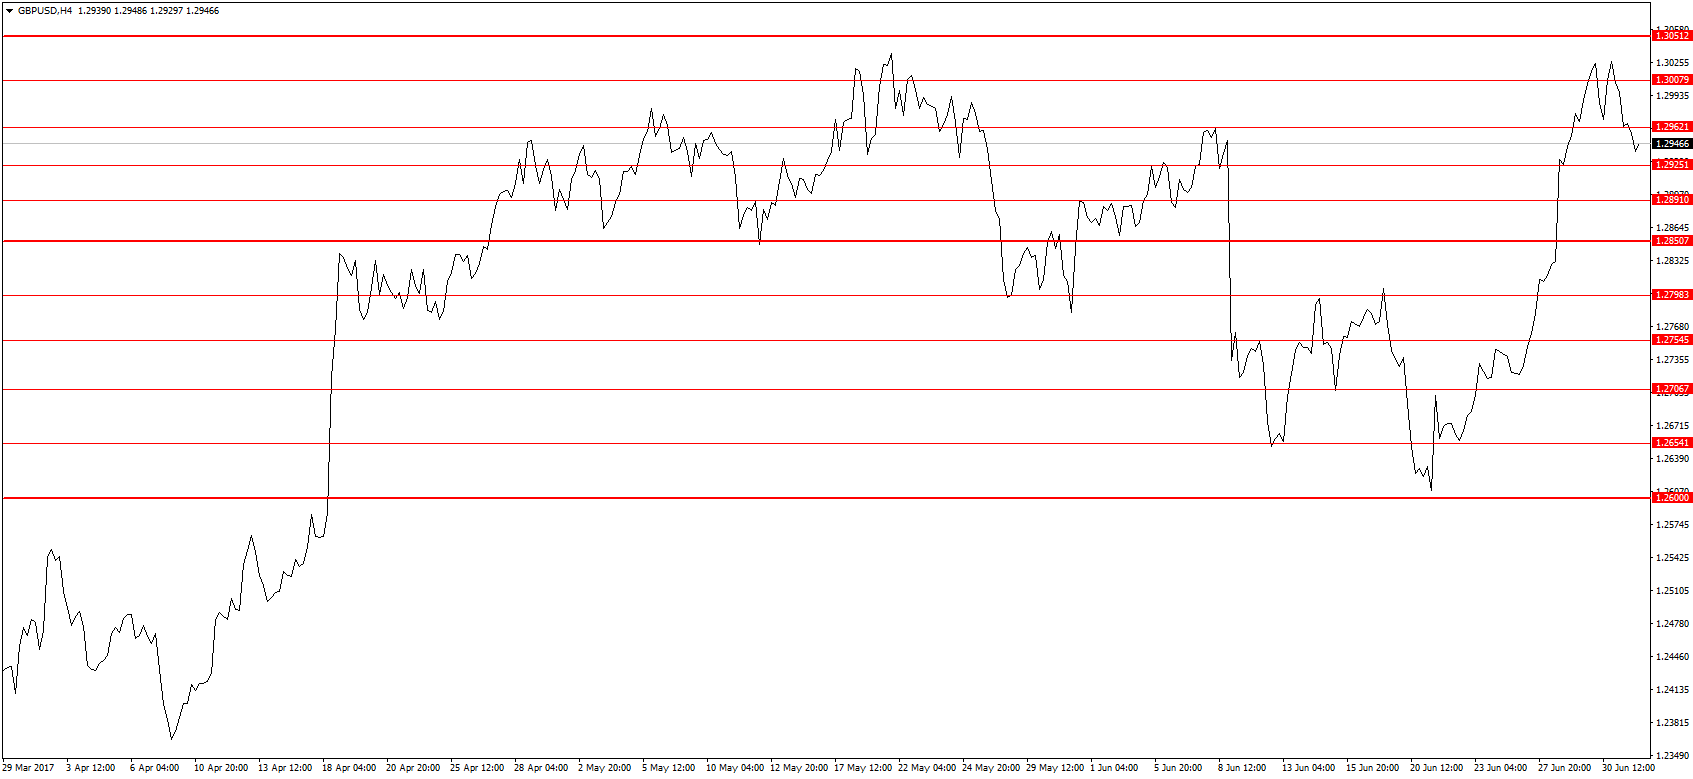
Switch to line charts
Line charts may not be the best while you’re trading, but you can use them when you want to eliminate the ‘noise’ of the candlesticks. The candlestick chart may be a bit confusing because the shadows and bodies make it difficult to determine where exactly prices turned. The line chart on the other hand only makes use of closing prices and is not subject to the same noise. If I were to switch the same GBP/USD chart to a line chart, see how the S/R levels just fall in line (pun intended):
Use other indicators to hint at S/R levels
Although most indicators are lagging, they can show you which points in the past prices bounced strongest off of, and these will give you a clue on where your S/R levels ought to be.
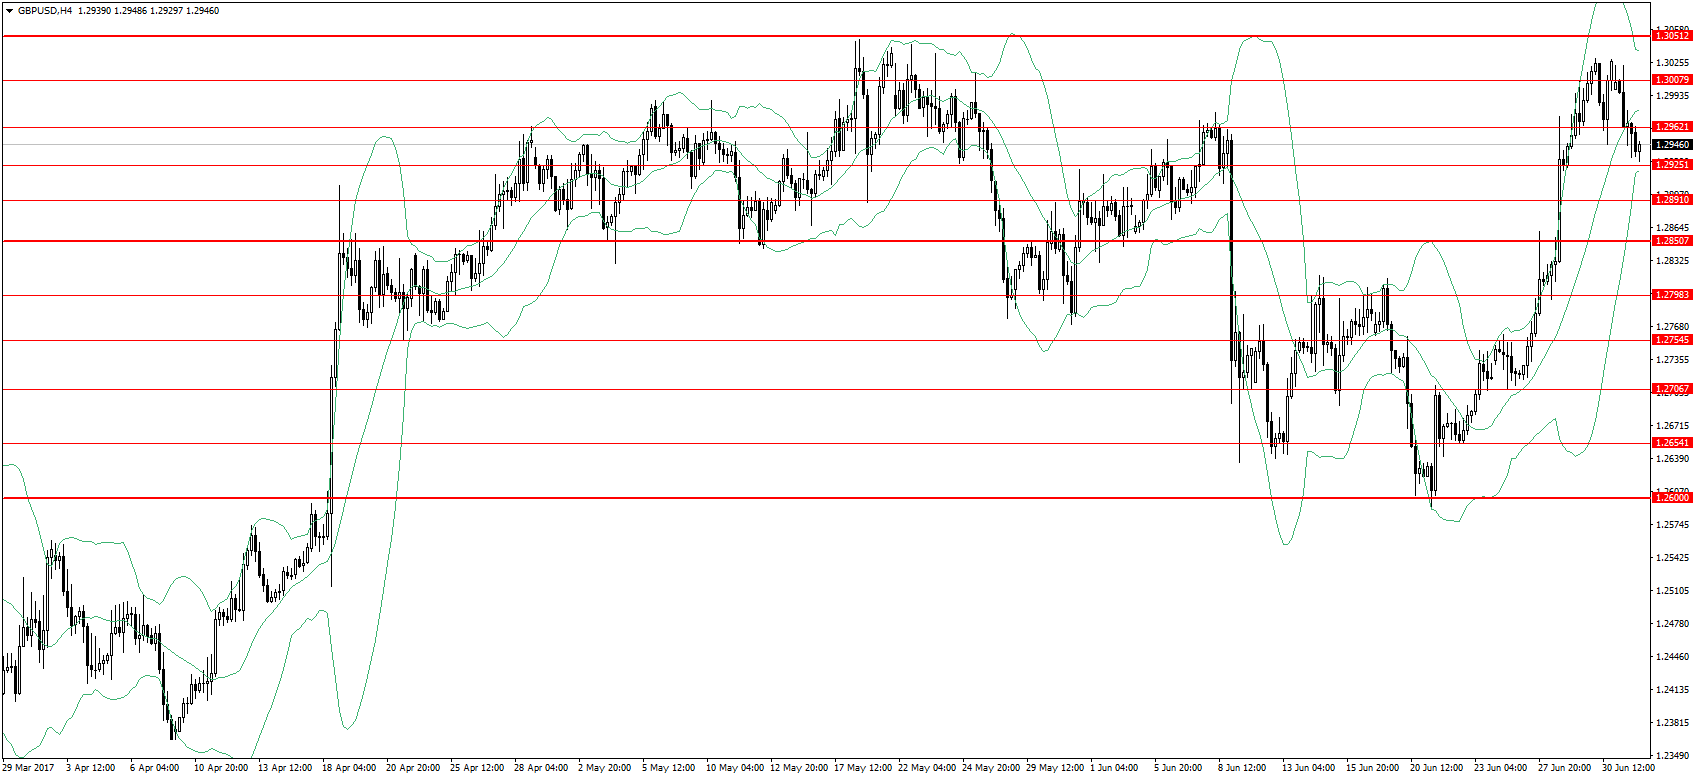
In the chart above, the Bollinger bands in green are seen reacting to the S/R levels, and although they don’t provide the exact points of support and resistance, they can be a guide for you.
Further reading for you, and yes, it is related:
Using the Fibonacci retracement