 Alpari
 XM
XMThis is yet another Forex strategy that relies upon the formation of patterns on the Forex trading platforms. Regardless of the platform you’re using, these patterns are bound to form at some point, and knowing them will give you an edge over other brokers. Just like the previously discussed head and shoulders pattern, triangles also show market sentiment and show you how the markets might move in response. (Head and shoulder pattern trading strategy)
What does a triangle pattern look like?
A profitable trading strategy will be worthless if you can’t see it. I’ll also assume you’re reading this because you have probably never seen any formation of triangles before.
The symmetrical triangle pattern
Well, here’s a typical example of a triangle formation:
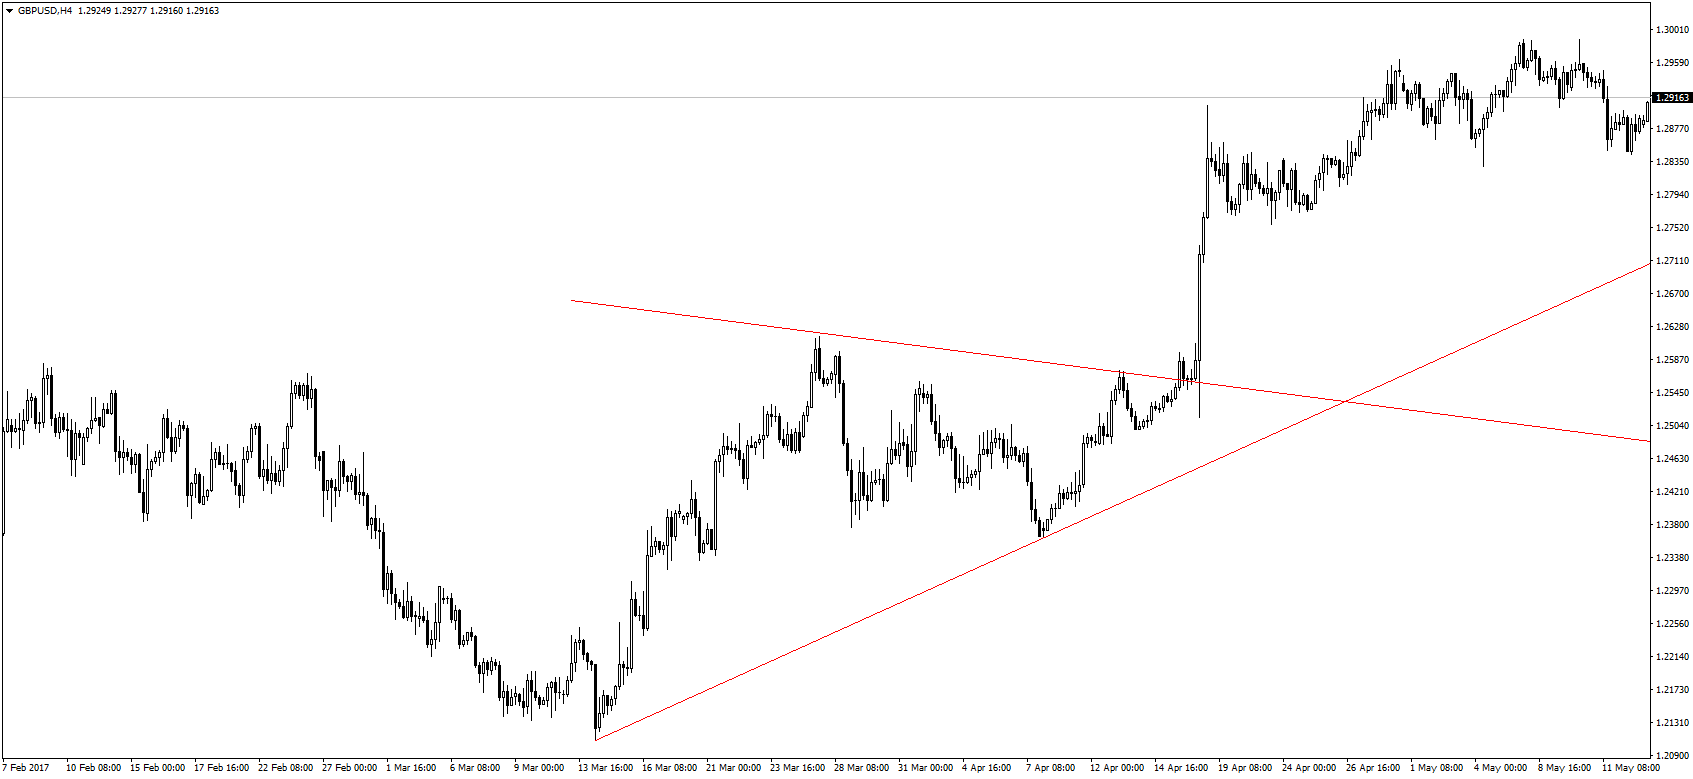
I’m sure now it’s very clear, and all you need to do is draw a pair of trend lines. The trend line should touch the support and resistance points, or you can call them the peaks and troughs, on the Forex charts. If you prefer more visuals, it is possible to add a shade/fill to the triangle, but it’s not needed.
Now, this is the most common type of triangle pattern formed, and it’s called a symmetrical pattern because both trendlines are moving in opposite directions. When you see this pattern forming, what does it mean?
That the bulls are getting more and more in control. Let’s look at the image above, the ascending trendline starts at the bottom of a downtrend, and then the prices start to go up. After a strong uptrend, a point of resistance is met, and prices go down. Nothing wrong so far, until you note how the support level has moved higher, where the ascending trendline again passes through. On the other side, the descending trendline is indeed pushing prices lower by forming lower highs, but it’s not doing so as much as the ascending trendline is.
This pattern, therefore, shows that there is an ongoing struggle between the bulls and the bears, but that the bulls are more aggressive. The area marked by the triangle formation is known as consolidation, and it represents this struggle in market sentiment. When you see this formation, prepare for an explosion in prices as the markets head to the apex of the triangle.
The ascending triangle pattern
In this case, the triangle is not formed by converging trendlines but rather by one horizontal level of resistance and an ascending trendline.
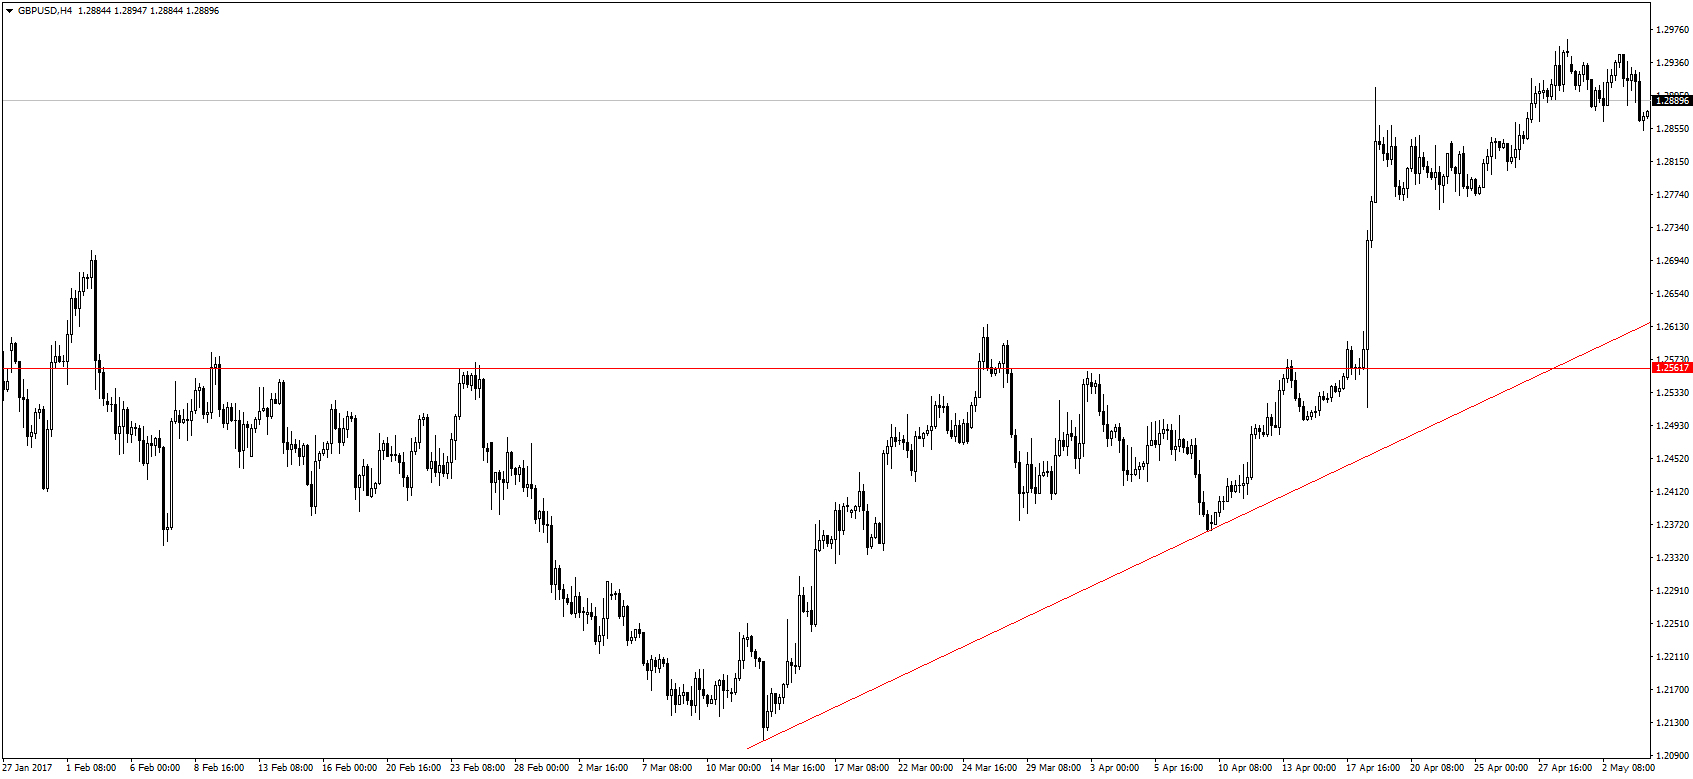
In this triangle pattern, we see the ascending trendline consistently touching higher lows, but the prices are unable to break through the level of resistance. What this pattern shows is that after the downtrend, the bulls are flexing their muscles and pushing prices higher. However, there aren’t enough bulls to break prices above the resistance level, yet.
As the ascending trendline shows, more and more bulls are getting into the market and shifting market sentiment. The final push at the resistance level should come as the triangle is almost forming an apex. In this case, we see that the bulls finally overpowered the bears and prices shot up above the resistance level.
The descending triangle pattern
This pattern is the opposite of the ascending triangle, and it should look like this:
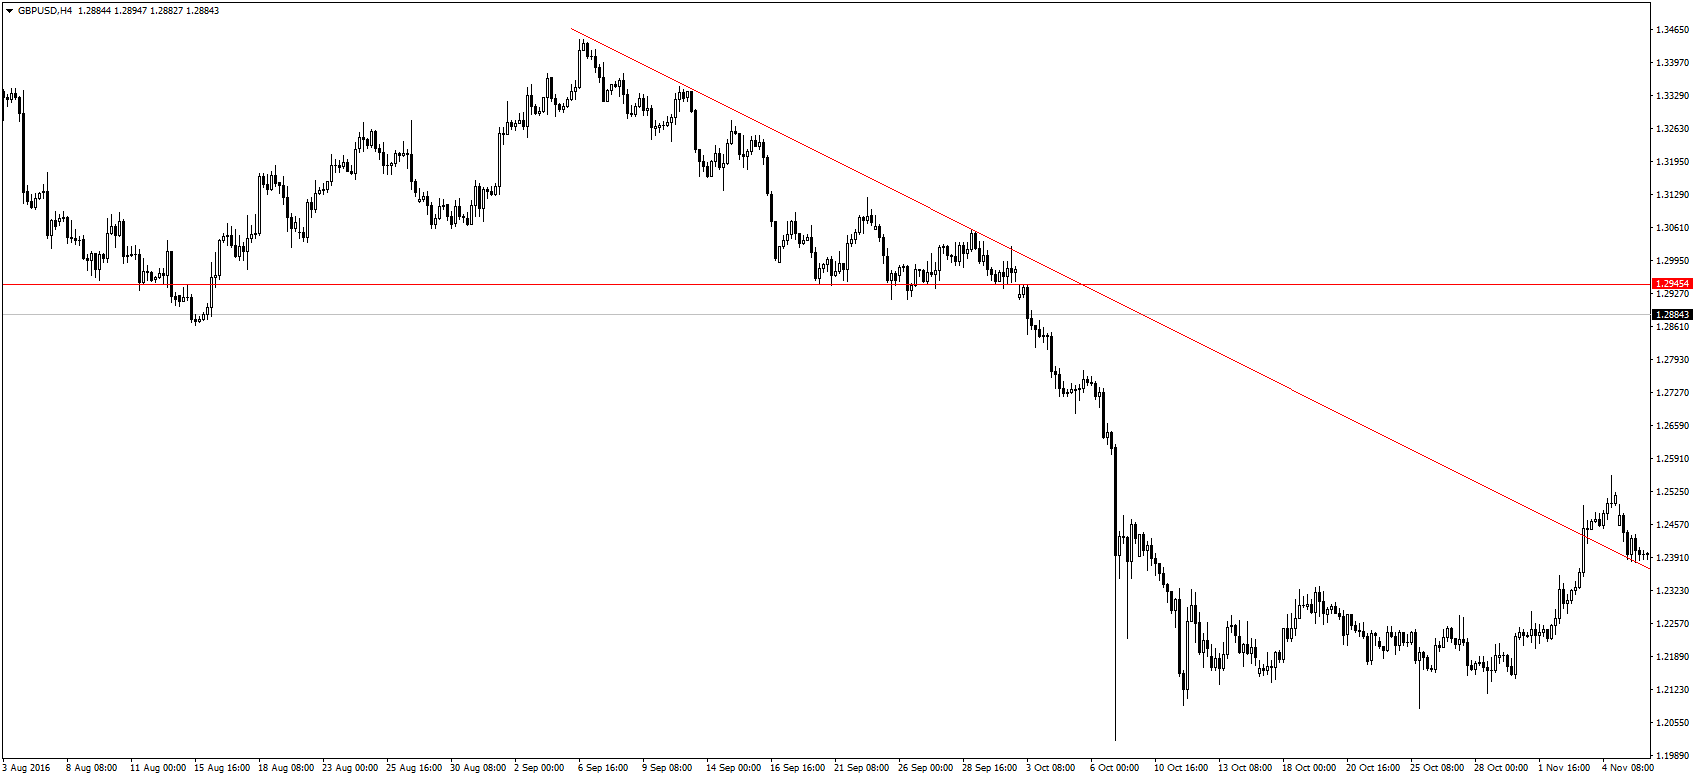
In this pattern, the bears finally beat the bulls after a struggle to the downside. The opposite is going on in the markets compared to the ascending triangle pattern, showing an increasingly bearish market sentiment. (Forex market sentiment indicators)
How to make trades using the triangle patterns
Now you can see the patterns, I’m sure, they are one of the most common patterns and you should be able to see them frequently. It would also be worthless if you could see it but don’t know what to do about it. Fortunately, it is a very powerful tool and can be used in various ways:
To trade the breakouts
In all the examples above in the screenshots, you can see how the markets broke out of the triangle as prices approached the apex of the triangle. The breakout occurs when either the bulls or bears finally give in to pressure from the other side, and just like the cork popping from a bottle, the markets react strongly. This is the most effective use of triangle pattern formation, and it can make you many pips.
Let’s take the first example of the symmetrical triangle pattern formation. You draw the ascending trendline by connecting the troughs in the charts while connecting the peaks to form a descending trendline. By now, you should know how to draw trend lines, and if not, check out the DeMark trend-trading method for some tips.
As long as prices remain within the triangle, don’t make any trades, but as soon as prices break any of the trendlines, watch out for the breakout. This is where it gets a bit tricky, When do you enter the trade? Immediately after a break? No. Remember to be patient with the breakout because sometimes there may be a fake-out. Look at this example:
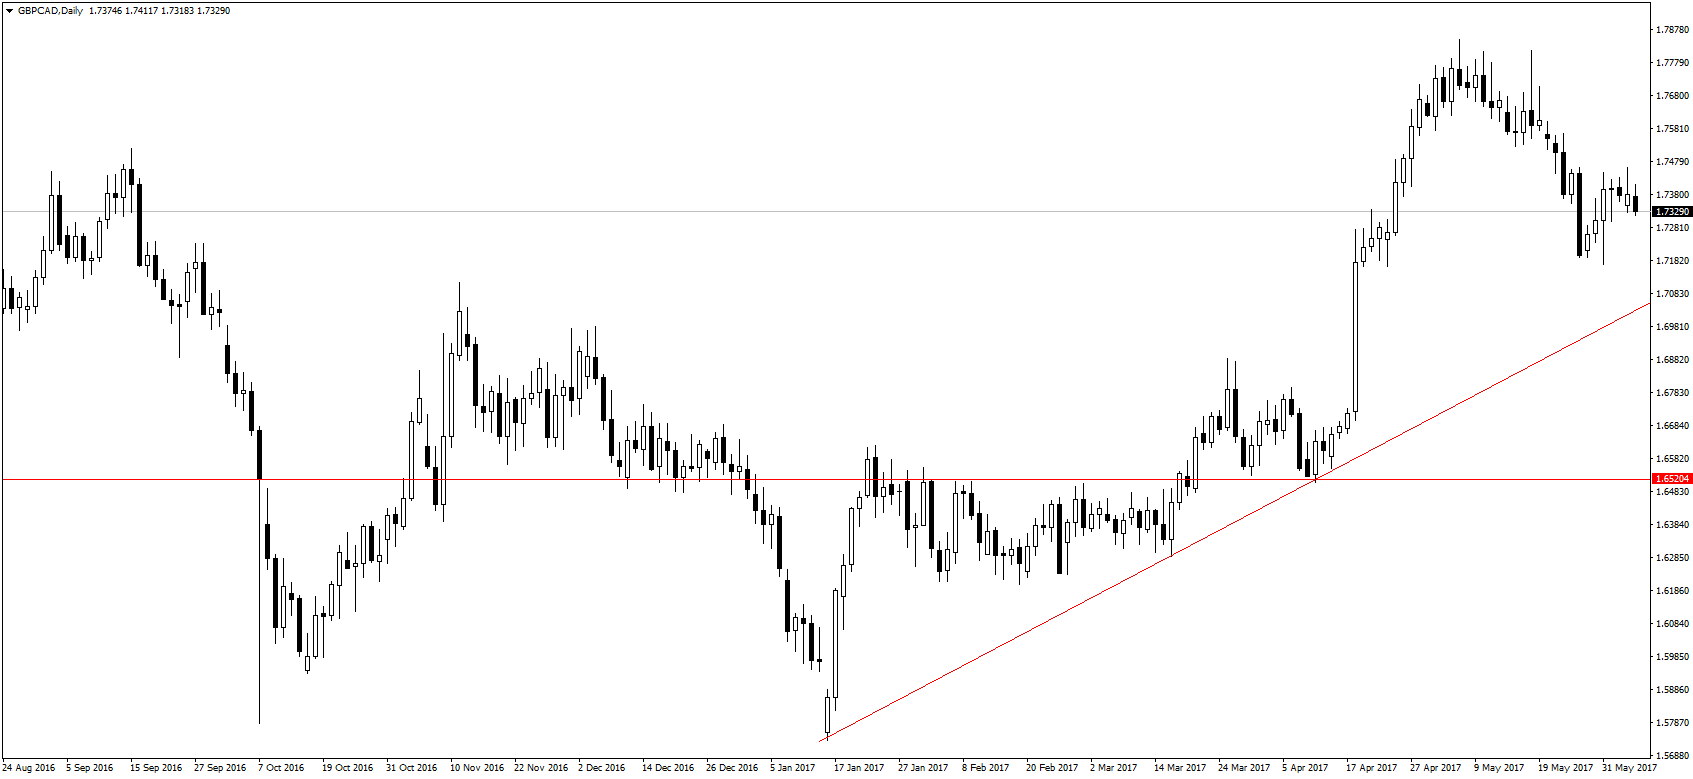
Here, prices closed above the resistance level, but after a short-lived uptrend, the prices came back down. However, after testing the support level, the bullish sentiment was confirmed and a strong uptrend followed.
So, to enter a trade for the breakout, give the markets some room to move around a bit instead of placing an order the second a candle pops out of the triangle. This conservative, careful approach may cause you to lose part of the trend, but it’s better to be careful and only enter a trade when you’re certain of the trend.
Still, there may be some aggressive, renegade traders out there who can’t wait for a confirmation. To you, I say go ahead, but remember the risk management principles so that you avoid any significant losses just in case you were wrong (Risk-management on Forex). This should involve using a stop loss to minimize losses.
The ideal position for placing a stop loss, for example, in the chart above, should be around the highest low created by the ascending downtrend. This would be in the case of an aggressive trader who opened a position the first time prices broke above the resistance level. On the other hand, if you had waited until prices were a few pips above the resistance, the resistance level should have acted as your stop loss level.
Once you’re in the trade, you still have to keep managing your profits because we want to catch the entire trend. The best way to do so, in my opinion, is through the use of a trailing stop. As you can see, all my charts are 4-hour charts, which is a swing trader’s timeframe and a long-term strategy. In my case, I wouldn’t be able to keep watching the trade, so a stop loss would be my best choice. For shorter timeframes in the case of a scalper, you can manually move your stop loss as the trend continues. (How to earn money through scalping)
In both of these cases, just remember to give the trade some room, and not to put your stop loss or trailing stop too close to the market prices.
To trade the ranges
Let’s say you can see the triangle pattern forming on your charts and you just can’t wait for the breakout, why not trade the range? The same trendlines you have drawn to mark the triangle define the limits of the trading range, and you can use these to buy low and sell high.
Let’s use the same example in the first screenshot at the top – every time the prices touched the descending trendline, you would know that it would be a resistance level and short the markets. Consequently, the triangle would also determine when the downtrend would stop, so you would know when to close the position and take some profit. On the other hand, when prices touched the ascending trendline, it would tell you you’re at a support level and that you should buy. Your take profit could be set around the descending trendline.
You can follow this constant up-and-down motion for as long as prices remain within the triangle, making a profit as you do. Finally, when the breakout occurs, you can then trade the breakout and make even more profits from the same chart. By mastering the triangle pattern, it is possible to make a lot of pips without having to even look at other charts.
Some things to remember about this trading strategy
Just like other Forex trading strategies, there are always some disclaimers, but there are very few for this one since it is such an effective and reliable strategy. The most important is to wait for confirmation for the triangle. For a complete triangle pattern to be confirmed, you need at least 2 points for both the ascending and descending trendlines. Until your trendlines touch at least 2 peaks and troughs, do not say you have just noticed a triangle pattern formation.
There are no other disclaimers/warnings, that’s it! Besides, you can use this trading strategy on any currency pair and timeline because it’s that versatile. Enjoy making a lot of pips folks.