 Alpari
 XM
XMEvery experienced forex trader has observed certain currency pairs moving in sync or opposition to one another. I noticed this pattern early on and thought I had discovered something groundbreaking. However, I soon learned this is an actual trading concept known as "currency correlation."
Initially discouraged that I had not uncovered something new, I decided to research currency correlations more deeply. Here is a comprehensive guide covering everything you need to know about this crucial trading phenomenon.
Understanding which major currencies tend to move together and which move conversely can significantly improve trading outcomes. This correlation cheat sheet provides critical data to help forecast potential market moves. By incorporating currency correlations into trading strategies, the odds of success greatly increase.
Whether you are new to evaluating currency correlations or looking to expand existing knowledge, this guide explores need-to-know details that can elevate trading analysis. Read on to uncover how to utilize currency correlations when making informed trading decisions.
What exactly is currency correlation?
Let’s start at the root – the strength of a currency depends on the economy it represents, thereby a stronger economy makes the currency stronger, and vice versa. Meanwhile, most countries’ economies rely on each other, and this makes their currencies related in some way.
For example, in the European continent, the UK and other European countries rely on each other because they trade various commodities to each other as well as services. Due to this, the strength of the sterling pound is affected by any changes in the economies of other European countries. This is why the Brexit poll affected Forex trading on the 23rd of June 2016 weakened the pound against the euro. Other similar relationships can be seen all over the world, and this is what creates a currency correlation.
Data about currency correlations are usually represented in the form of a chart, with the intersecting points representing the correlation coefficient. Such a chart would look something like this:
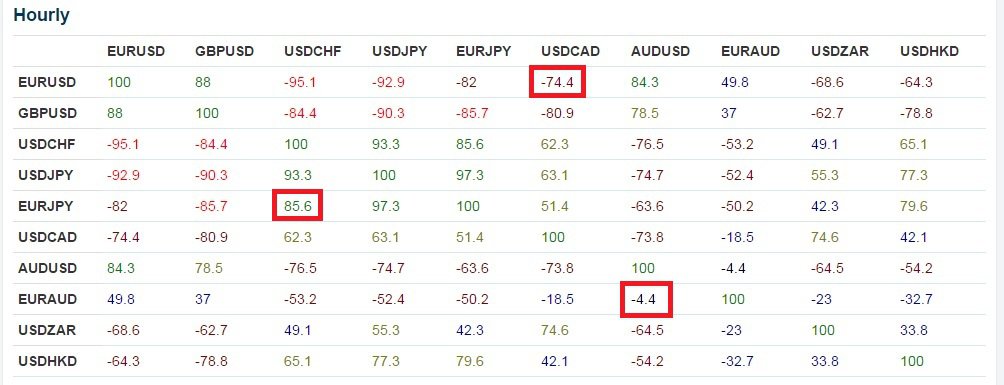
The coefficient chart represents the correlation percentage between currency pairs, ranging from -100% to 100% (some charts range from -1 to 1 instead). The closer the coefficient is to the extremes of 100% or -100%, the stronger the currency pairs are correlated in a positive or negative direction, respectively. Coefficients closer to 0% indicate weak or no correlation.
In the chart, the EUR/USD and USD/CAD pairs have a strong negative correlation of -74.4%. This means that 74.4% of the time, when the EUR/USD is rising, the USD/CAD is falling. On the other hand, the USD/CHF and EUR/JPY have a strong positive correlation of 85.6%. So when USD/CHF rises, EUR/JPY rises as well 85.6% of the time. The EUR/AUD pair has a near-zero correlation, meaning the currencies shift independently.
Knowing which currency pairs are strongly correlated, whether positively or negatively, helps predict how one pair will move relative to the other. For example, if the EUR/USD chart shows an uptrend, the USD/CAD will likely be on a downtrend with a 74.4% probability. Using correlations allows traders to make better-informed decisions on trades and positions.
The key points are using extreme correlation coefficients close to 100% or -100% and understanding how positively correlated pairs move in the same direction while negatively correlated pairs move in opposite directions.
How to use this forex correlation cheat sheet information
I like to think of the currency correlation charts as a cheat sheet that you can use to draw quick conclusions about how certain currency pairs will move against each other.
Let’s see how this works with an example, the EUR/USD and AUD/USD pairs are strongly related, 84.3% on the hourly chart as you can see in the image above. Thus, if I see an uptrend on the EUR/USD chart, I don’t have to study the AUD/USD chart afresh to know that the trend will also be heading up, and I can place a long position immediately. Some other benefits include:
Increasing profits
When your Forex broker offers you more than a hundred currency pairs to trade, it is not easy to study all of them in detail. With the currency correlation charts, though, you can have some idea about how pairs are moving without having to analyze them. Say, you have spotted a potential move on the USD/CHF pair and have just placed a trade, you can quickly shift to the EUR/USD pair and place the opposite trade because they have a strong negative correlation. In essence, you would be studying a single chart and making money on 2 or even 3 currency pairs with very little effort.
Simultaneous trading
Compared to fundamental analysts, technical analysts have to carefully analyze every chart using technical indicators before determining a good trading position. This can limit the number of trades you can make in a day if you have to study every chart before placing a trade. Again, the currency correlation helps you to avoid a repetition of the chart analysis, thereby allowing you to place more trades at the same time.
Hedging risk
We all know that even with the most in-depth analysis of the charts, we sometimes get it wrong and end up losing. Now imagine you have a long position GBP/USD and after a few minutes, you realize you were wrong. You can watch as the trade gets stopped, or you can find a pair with a strong negative correlation to hedge the loss. Going long on the USD/JPY, which is negatively correlated, can provide the profits to offset the loss you just suffered. This hedge may not cover your entire loss, but it might minimize the hit your account takes. (Read more about hedging)
Confirming breakouts
If you use a pivot points strategy to identify when prices have reached support or resistance levels, currency correlations can assist you in confirming your predictions. Say, you find that the EUR/USD is around a resistance level and are not sure whether it’s going to break out or bounce off the pivot point. Checking out other correlated pairs can help you do this. It will involve both positively and negatively correlated pairs.
The EUR/USD pair relates positively to the GBP/USD and AUD/USD pairs, so you can check whether these pairs are also at a resistance level. At the same time, the USD/CHF and USD/JPY pairs are negatively related to the EUR/USD, you should look for the opposite, whether they are at a support level. If all the data matches up, then you know you are onto something, otherwise, you would know it was only a fake-out. Therefore, the relationship of the currency pairs can help you to confirm your analysis and avoid getting into fake-outs.
What to remember about currency correlations
There are a few things to keep in mind before employing currency correlations in your trading strategy:
Correlations change
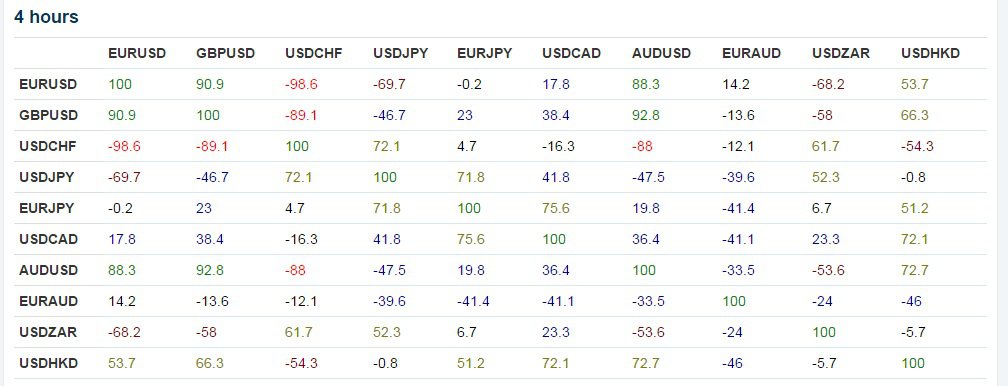
Currency correlations only offer a guide as to which currencies have strong positive or negative relationships, but these relationships change with time. If you look at the images below, you can see the correlation coefficient changing as you shift from one timeframe to another. This is something you should always be aware of if you’re going to include currency correlations in your trading strategy.
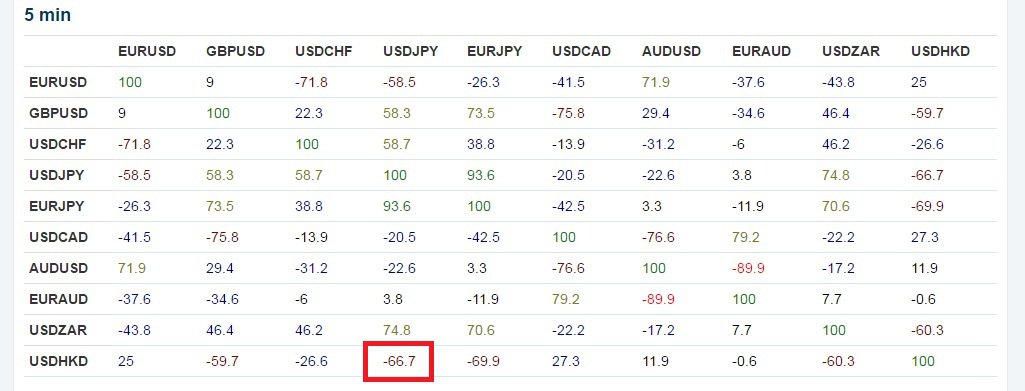
At this time, the USD/JPY and USD/HKD pairs were strongly negatively correlated, and the value of one pair would move opposite to the other.
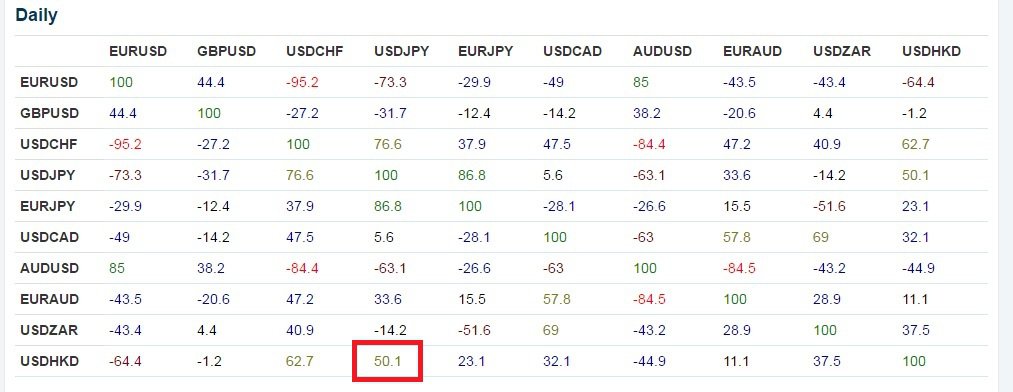
However, if you look at the entire day, you would see that the pairs were consistently positively correlated, despite a few moments within the day when they moved opposite each other. If you had worked with the data from the 5-minute correlations throughout the day, then you can see how that could have worked against you.
With this in mind, it is important to have the latest correlation table so that you’re not working with the wrong data. You should check your Forex broker’s website for the latest correlation data because they constantly keep these figures updated. Otherwise, you can perform a quick Forex broker comparison to find the one who offers this information, for example, you can check our Alpari Trading Accounts Comparison for more.
Additionally, even the figures from a single timeframe will change from one week to the other. The charts provided above show a correlation for this week, but the figures for the next week may be different. The coefficient changes for many reasons, among them changing economic policies in the countries involved in the pair. For example, a rise in interest rates in the US can change the way the US dollar relates to other countries. Other factors that influence the coefficient include changing political environments and market sentiment about particular currency pairs.
Not too many eggs in one basket
Finally, like everything else about the Forex market, things don’t always go according to plan, and sometimes even the currency correlation charts get it wrong. Knowing this, you should not place too many trades simultaneously just because the correlation coefficient tells you that the currencies move together. In case the prediction is wrong, you may find yourself with multiple losing trades that may put a huge dent in your capital. My advice is never to place more than 3 trades based solely on the currency correlation, and always remember to manage risk in case the prediction is wrong.
Have you seen our helpful guide?
Before you employ currency correlation, you need to understand more about it, and this video will help you do that: