Don’t be scared by the name, I promise you will have a different perspective by the end of this post. This is a trading strategy named after its looks, and you’re probably going to understand why after scrolling down further.
Technical indicators used
All the technical indicators used in this forex trading strategy have been archived below and are free to download. There are a number of them, but I’m going to detail the use of the main ones – the essentials. Once you have them all installed on your trading platform, you get something close to sorcery. Scary at first, I know, but bear with me…
XMA
This will be the main indicator for the Alchemy trading system, and it combines several indicators that come preinstalled with most forex trading platforms; but with a few modifications. In it are moving averages that have been modified to become more effective.
Within the main trading window are a pair of moving averages that trend close to the candlesticks. The brown one is a fast-moving average and the other a slow one, but it changes color depending on the direction of the markets. In a downtrend, it is purple, then it turns blue in an uptrend. Besides the color change, a cross between these two moving averages represents a trading opportunity – a selling opportunity when the purple line crosses the brown one to the upside and vice versa. (Forex strategy based on MAs)
Besides this pair, there is another even slower moving average in red. Several others are formed from this after the values of the red moving average deviate. Together, they act as moving support and resistance levels, within which prices fluctuate. The further prices approach the outermost line, the higher the chances of a trend reversal. Prices are repelled by these moving averages. (Breakout forex trading strategies)
If you find these concepts difficult, don’t worry, because the XMA indicator does this for you automatically. On the bottom-left corner of the window is a text box that indicates whether the confluence of signals represents a trading opportunity or not. Then on the top-right corner is another text box showing various useful market details.
Semafor and ZZ indicators
There are two sets of Semafor indicators, A and B. Both of them are used to show turning points in the markets, but Semafor A marks major turns while Semafor B marks minor turns. Depending on your trading strategy, you can choose to focus on either Semafor A or B, where Semafor A is more suitable for long-term traders and Semafor B for short-term traders. (Long-term vs. short-term trading)
ZZ indicators also show turning points in the markets, just like Semafor indicators, only these are represented by continuous lines instead of bubbles. ZZ-NEN A is used to show turning points on longer trends while ZZ-NEN B shows the turning points on shorter trends.
Regardless of which pair of indicators you choose, both can be used to identify support and resistance levels in the markets. Of course, the long-term pair of indicators would show stronger S/R levels compared to the short-term indicators. (How to draw S/R levels like a pro)
MT4 daily targets and M-Math
Before placing an order, you need to look at these two indicators for further market information. MT4 daily targets automatically draw several daily pivot points where trends may reverse. It’s thus best to trade at these points because trends form and reverse there, allowing you to catch market moves. Meanwhile, M-Math shows how likely market trends are to shift to either side depending on the average daily range (ADR). (Pivot points forex trading strategy)
Other indicators
The above are the main indicators you are going to need, but several more are attached in the archive. Those are just auxiliary indicators, but they may come in handy depending on your forex trading strategy. The breakout box indicator, for example, marks a region when markets are ranging, and you can trade when prices fall out of the highlighted box. MT4 channel, on the other hand, can be used to identify S/R levels and possible trading opportunities.
The indicators window
Below the main trading forex charts are several more indicators. The XMA cycle indicator shows points where market trends reverse direction, and the Trend Pro tells us of long-term market trends. The stochastic indicator acts just like the typical stochastic, but it has been colored so it’s easier to tell when markets are overbought or oversold, and by how much.
Combining all the indicators
Looking at a chart with all the indicators included can seem a lot like… well, alchemy. And that’s why the trading strategy is named that way. I admit it can be quite overwhelming to have so many indicators, and usually, I don’t recommend adding so many indicators at once, but in this case, it’s worth it.
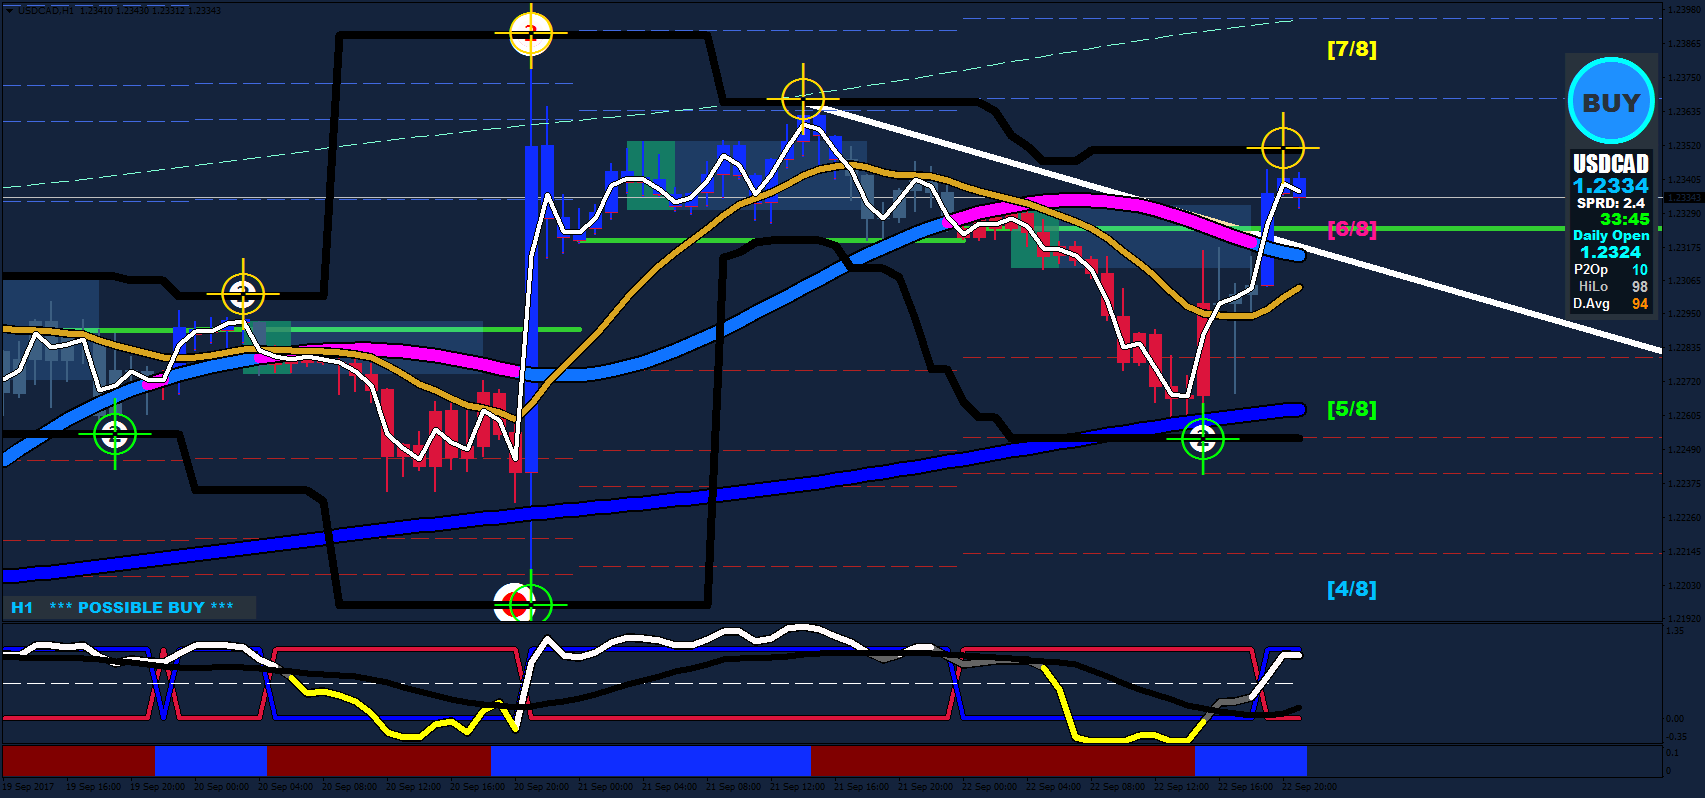
The chart above represents a buying opportunity based on the signals generated by the indicators used. Starting from the bottom, we see that the Trend Pro indicator has shifted from red to blue, and the XMA cycle now has the blue line above the red. The stochastic indicator had reached oversold regions and is now heading upwards.
On the main trading window, the signal to buy is clear from the XMA indicator, begging us to place a buy order. Just to confirm, we can see that the candles have turned blue from the Candles indicator and prices are above the central red line of the XMA moving averages. There are already more than 5 signals, but just to be sure, you can check out the others. For example, prices just crossed above one of M-Math’s and Daily Targets’ key levels, while also being above Semafor B’s trend line.
Now onto trade management; it’s best to set the take profit at the dotted line of the XMA indicator MA, and a stop loss at the lower level of the Daily Targets. However, a long-term trader may choose to hold on to the trade until the long-term indicators below tell them otherwise. For such a trader, they can hold on to the trade until the Trend Pro turns back to red and the stochastic reaches overbought regions. As long as the fundamentals hold up, assuming there is nothing new on the economic calendar forex, the trend can keep going upwards until the second dotted line of the XMA indicator. Such a long trend with plenty of pips. (How to earn money through scalping)
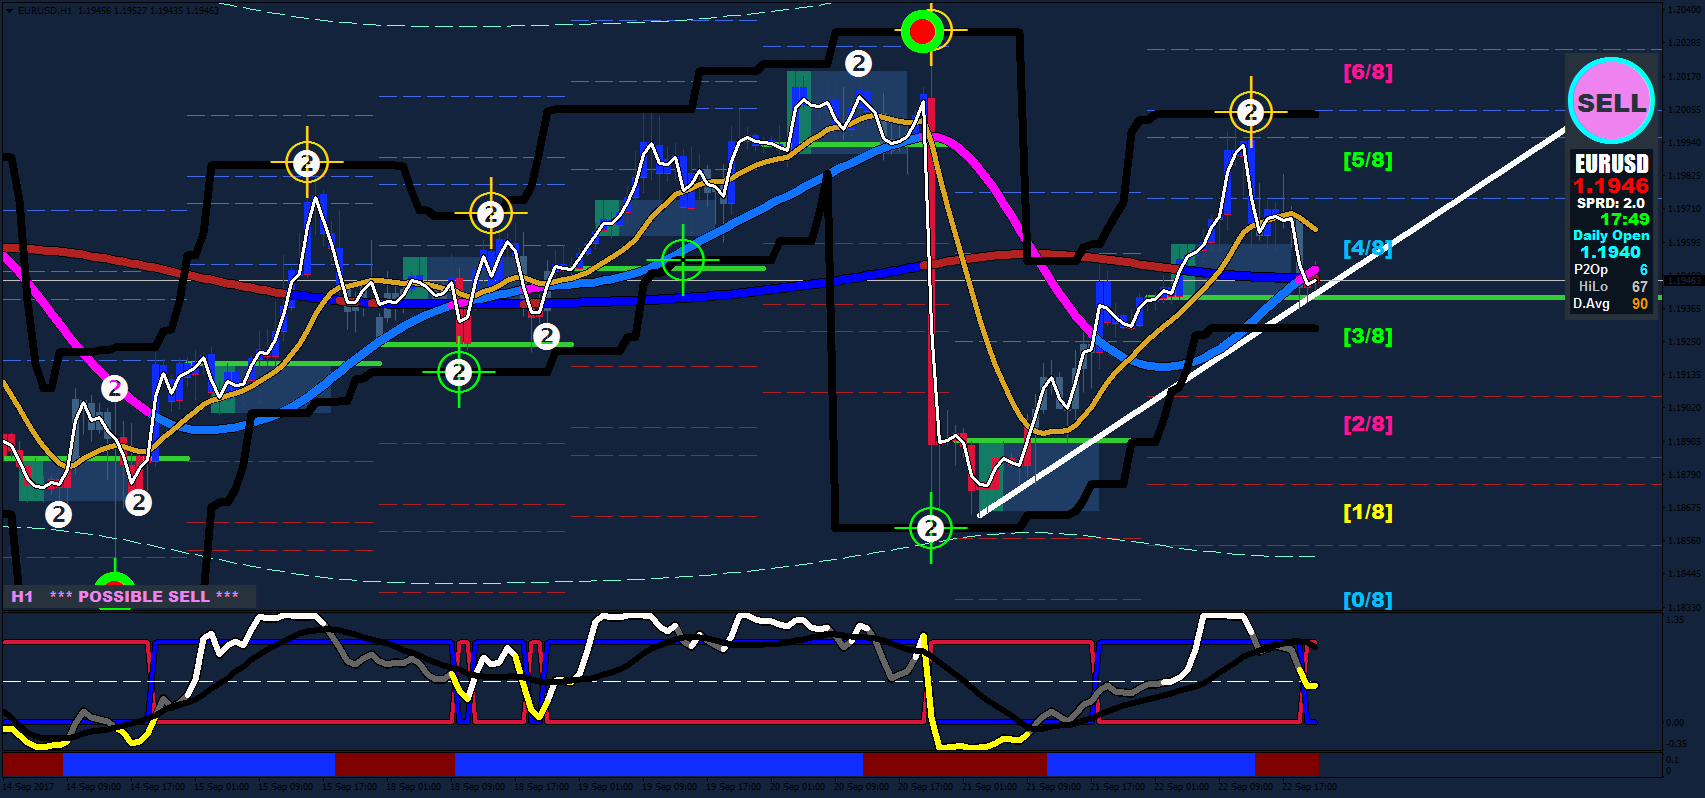
In this chart, there is a selling opportunity, and it can be identified by reversing the signals indicated in the previous example.
Alchemy trading system indicators
Before using any forex trading strategy, it’s important to test whether it works. You can either do this on a demo account, or by backtesting. If you don’t know how to do that, then here’s a quick tutorial: