Here is a forex trading system custom-designed to help you identify and track long-term trends in the markets like a pro. We have tested it ourselves on various markets and timeframes, and it appears to be very successful in any market and timeframe. We had some problems with low timeframes like the M1 and M5 timeframes, but it was best on the D1, H4, and H1 charts where trends are more defined and predictable. Whether you’re a scalper looking to make quick money, an intraday trader, or a swing trader, this is the ultimate Forex trading system for you.

As you will see, this particular trading system is both easy to understand and versatile, fitting into every trader’s preference from start to finish. We start with the technical indicators.
Technical indicators used
Here, we’re going to rely on 8 technical indicators to identify trading opportunities in the forex market. They may seem like a lot, but you won’t need any others. The selection of these 8 indicators has been done carefully to ensure all aspects of the market are covered.

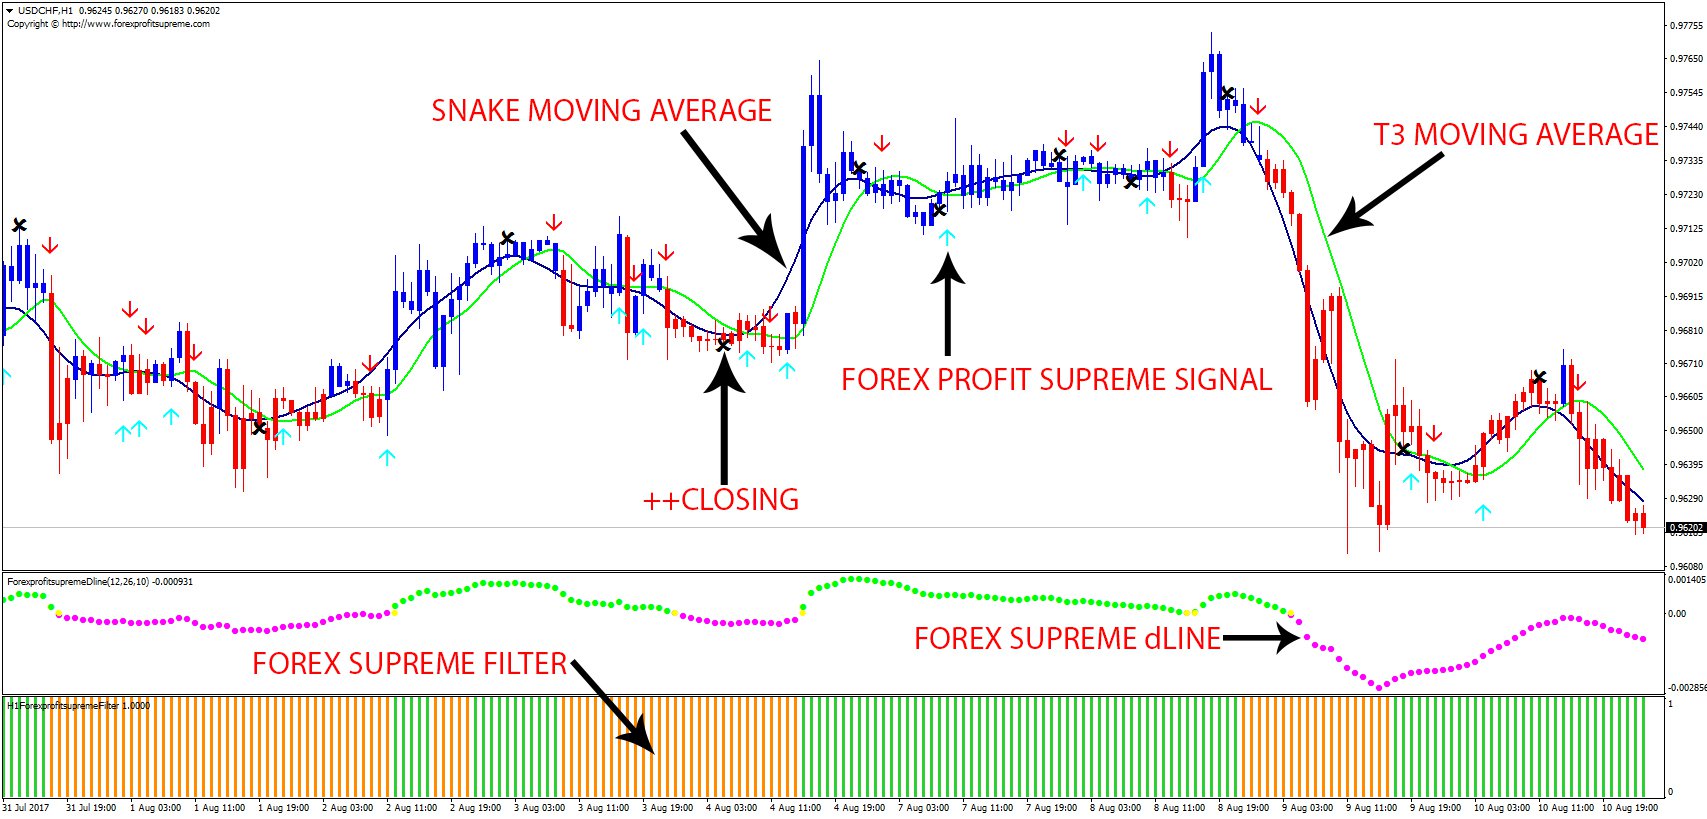
Snake moving average
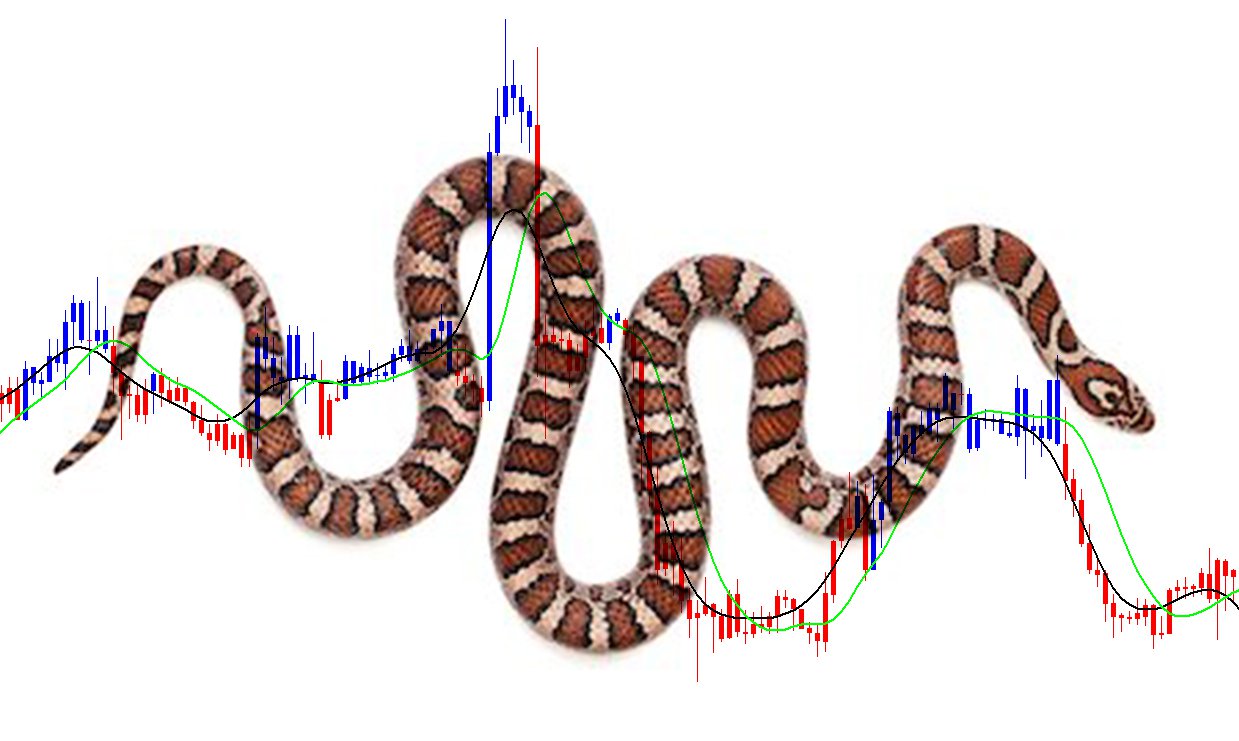
This will be our main indicator, and that’s why the trading system is named after it. It’s named Snake because it winds around like a snake, Although all moving averages do so, What can we say, we thought it would catch your attention. Nevertheless, this is no ordinary moving average, and it has been calculated by a special algorithm. (Forex strategy based on MAs)
As you may know, moving averages plot the average of the closing prices for the past period specified. For example, a 100-period moving average will take the average closing price for the past 100 periods. If you’re on a daily chart, this will be the past 100 days, on an H1 chart, it will be the past 100 hours, and so on depending on the set timeframe on your Forex trading platforms.
The reliance on past data leaves the typical moving averages lagging, but not the snake. Instead, this moving average stays up to date and provides insights into current trading decisions. On our chart, it is displayed by the black line, and for the most part, it works just like a typical moving average. When prices cross downwards, that is a signal to sell and vice versa.
T3 moving average
This one accompanies the snake, and it gives clues on the current market sentiment. For example, market sentiment is bullish when prices are trending above the T3 moving average and bearish when they are below it. This is the first way of identifying the general trend in the market long before you even have a look at the other indicators.
You can also spot trading opportunities by watching the cross between the snake and the T3 moving average. A buy signal happens when the snake crosses the T3 MA to the upside and a selling signal when the snake goes below the T3 MA. Additionally, while the snake is above the T3 MA, you should only look for buying opportunities in the markets and search for selling opportunities when the snake goes below the T3 MA.
This indicator is in green on our chart, but you can always change the color to whatever you prefer.
Forex profit supreme signal
On the chart, this is represented by the red and blue arrows pointing down and up respectively. This indicator will also generate a popup window when it senses a trend change, just in case you weren’t staring at that particular window. Their role is to signal trend reversals and notify you of potential trading opportunities. A red arrow appears when an uptrend is ending, telling you to sell, while the blue arrow tells you to buy in an uptrend.
Closing indicator
Seen as the black X marks, indicate ideal closing prices. Working together with the Forex profit supreme signal, they help you open a profitable trade and tell you when you should close it.
Forex profit supreme bar
Used to paint the candlesticks, making them blue in an uptrend and red in a downtrend. Its purpose is mainly visual, but it does make it easier to see the direction of the markets through color rather than black and white.
Forex profit supreme dine
The first indicator on the indicator windows acts similarly to the MACD to tell whether markets are bullish or bearish. It oscillates around the zero (0) level, with values above here representing a bullish market and values below showing bearish market sentiment. While the Forex profit supreme dLine remains green, you should search for buying opportunities, because there’s bullish momentum. However, as the indicator goes farther up and away from the zero (0) level, it shows possible overbought market conditions, in which case you should start selling. It is a crucial indicator for this trading system, especially when you know how to use it together with the other indicators.
Forex profit supreme filter
Also used to indicate market sentiment but on a slower magnitude. It tracks sentiment over a long period, which slows it down but also makes it very reliable. It is an excellent indicator for tracking long-term trends while ignoring the smaller, minor corrections in the market. (Looking for market correction)
Other indicators
From the package provided at the end of this piece, you will find these and other technical indicators that you can also use with this system. However, the above are the most important, and you can do without some like the Forex profit supreme clock, which only tells you how long you’ve got before the next candle starts. You can probably figure this out for yourself.
When you’re first adding these indicators to your MT4, I recommend adding them one by one so that you can modify the colors of each indicator to your preference. But, if you want to see all of them together under the same colors as seen in the screenshots above, then you will also find a template attached. Loading the template on MT4 will automatically add all technical indicators for this trading system.
Working with all indicators together
The best way to see how a trading system works is to look at actual examples in the market rather than talk about them. So, let’s see how one would have used this trading system a few weeks back and the results:

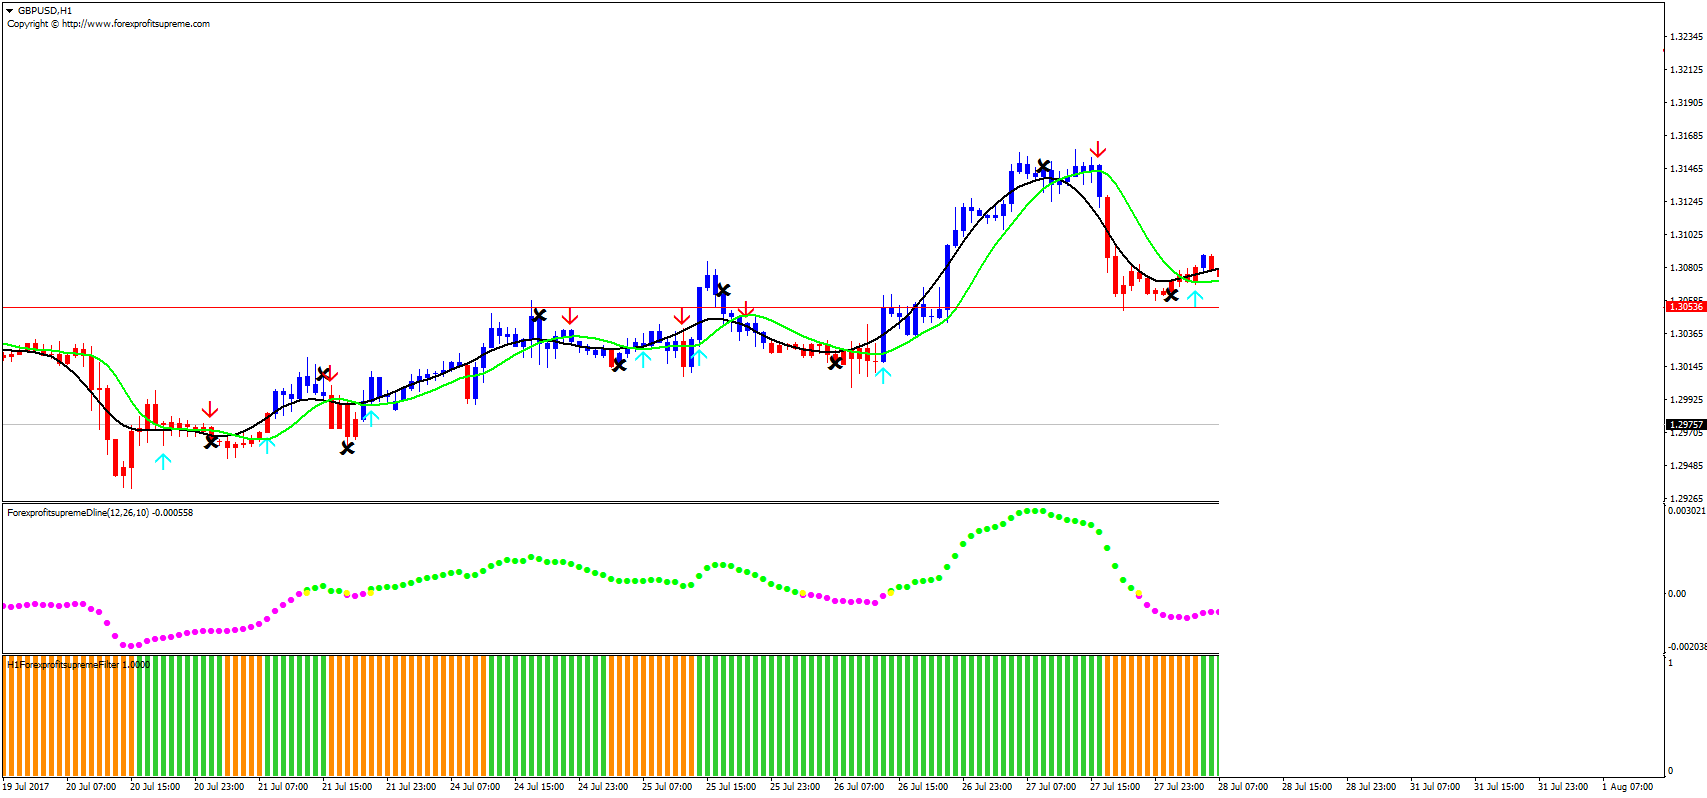
Alright, I’ve blocked a portion of these Forex charts so we can see if the indicators work (Spoiler alert: it does). At the point where the candlesticks end, already several technical indicators have fallen into place. The snake indicator is moving up and the prices are above it, our first bullish signal. We also see a cross between the snake and T3 MA where the snake crosses the latter upwards, another sign.
There is already some upward movement, and we can see this comes after a strong and sudden downtrend, perhaps spurred by a news announcement on the economic calendar Forex (How to work with the economic calendar). Whatever it was, it triggered the closing indicator first so any open short positions would be closed, and the Forex profit supreme signal thereafter to signal a buying opportunity. (Use Twitter to follow Forex news and events)
Down to the indicator windows, the Forex profit supreme dLine is still in the red, meaning that most of the market is still bearish, but looking at its direction shows it’s moving upwards toward the zero (0) level. Typically, when the line crosses above the zero (0) level, it indicates shifting market sentiment. At the lowest window, the Forex profit supreme filter has already turned green to indicate buying signals.
At this point, with all but one indicator signaling possible buying opportunities, it is possible to open a trade with success. If you don’t mind taking on some risk, this would be the best entry point. However, for those cautious traders, you may prefer to wait until ALL indicators have the same reading. So, let’s see what happens next:

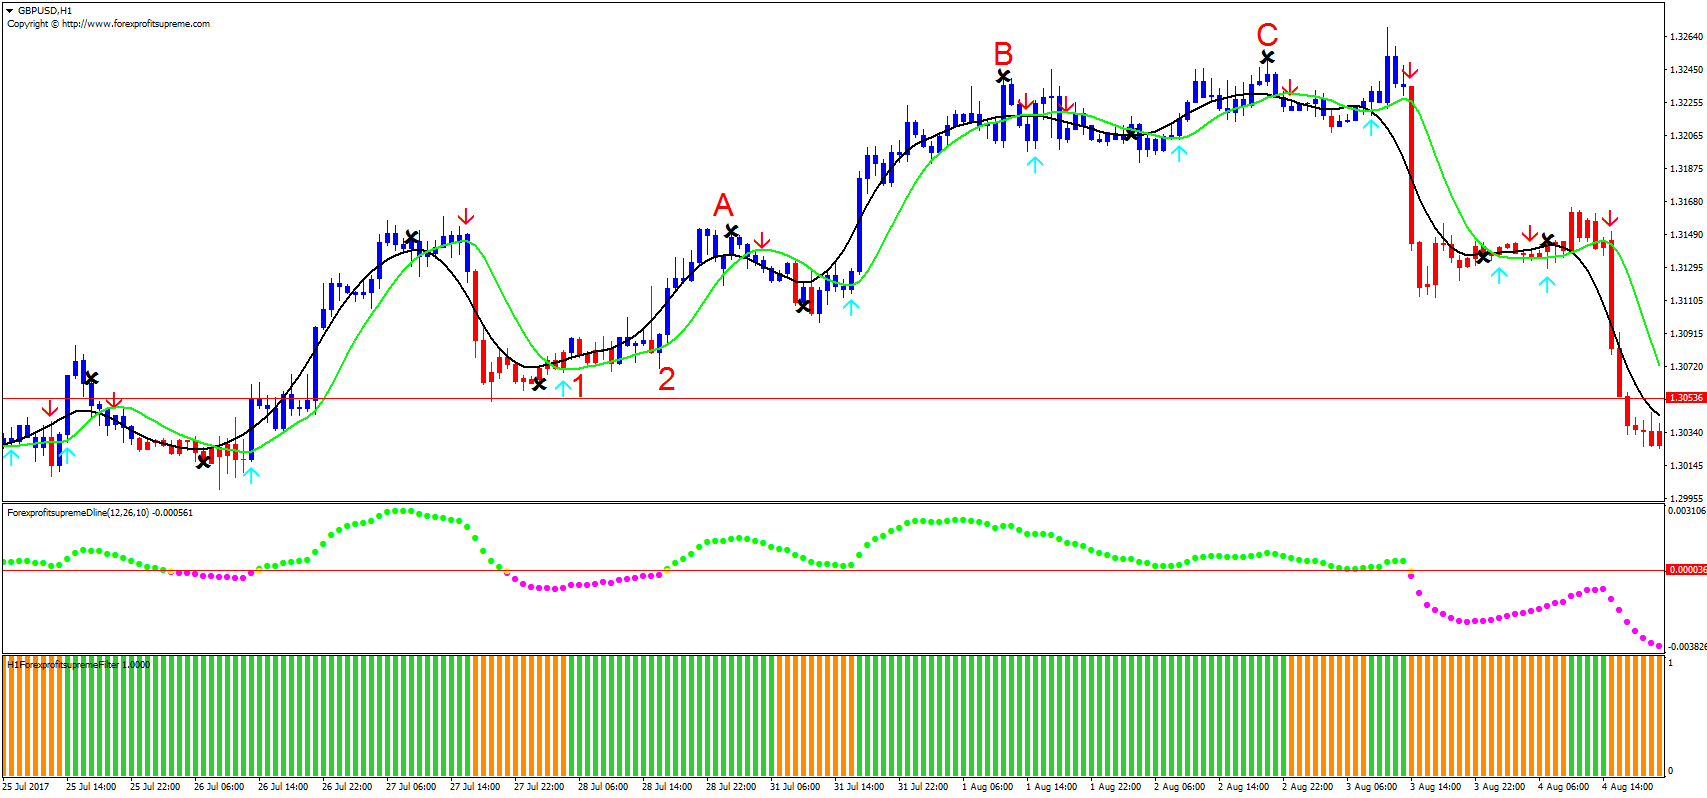
Whereas a risk taker would have bought the pair at Point 1, a cautious trader would have waited until Point 2 when the forex profit supreme dLine crossed above zero (0) and turned green since it’s the last to change. Either way, the markets went up sharply, with the first opportunity to close at Point A, where a short-term trader could have left the market with a good profit. (Long-term vs. short-term trading)
However, the dLine and filter indicators were still bullish, indicating that this was just a correction, and that’s exactly what it was. The next closing opportunity was at Point B when the forex profit supreme signal and the closing indicators showed a possible reversal. This would be another excellent position to leave the markets, but a patient trader could have waited until Point C when the dLine dipped below zero (0) and the filter turned orange.
Download the template and indicators
See how it all comes together for a successful trading experience in this short video:

 New ZealandUS