After numerous posts about trading strategies for short-term traders back to back, I thought I’d throw one in for long-term traders like myself. If you’re like me, then you know you don’t need to employ different strategies because you only make a few trades. Allow me then, to introduce the Autotrend channel trading system, which you will probably love using.
In a previous post, we covered how to use trendlines in trading the forex market. How to draw them on your real-time forex charts and how they are used to spot trading opportunities. The Autotrend channel trading system takes those principles further by automating the whole process and introducing visual cues. Together, the trading strategy makes the identification of long-term trends easier, even for beginners, and also helps you manage your trades. (Using trendlines in your forex trading strategy)
To make all this possible, three custom technical indicators will be installed on the MetaTrader 4 platform, which will provide all the needed information. However, first, some tips to keep in mind when using this trading strategy.
Tips while using the Autotrend channel trading system
As a long-term trading strategy, the system works best on higher timeframes – the higher the better. The minimum recommended timeframe to use here is the 30-minute charts. This is because trends are clearer and more predictable over longer periods with fewer chances of fakeouts. The only thing you need to be worried about in higher timeframes is the Forex calendar, which can radically shift market trends. (Long-term vs. short-term trading)
Furthermore, for these indicators to work well, you will need to allow DLL imports on your forex trading platforms. This option should be available on all MetaTrader platforms and will allow the indicators to function fully. Other than that, you’re good to go. (How to launch an expert advisor on MT4)
What the technical indicators do
As mentioned earlier, there are three technical indicators used in this Autotrend channel trading system, and all of them play different functions.
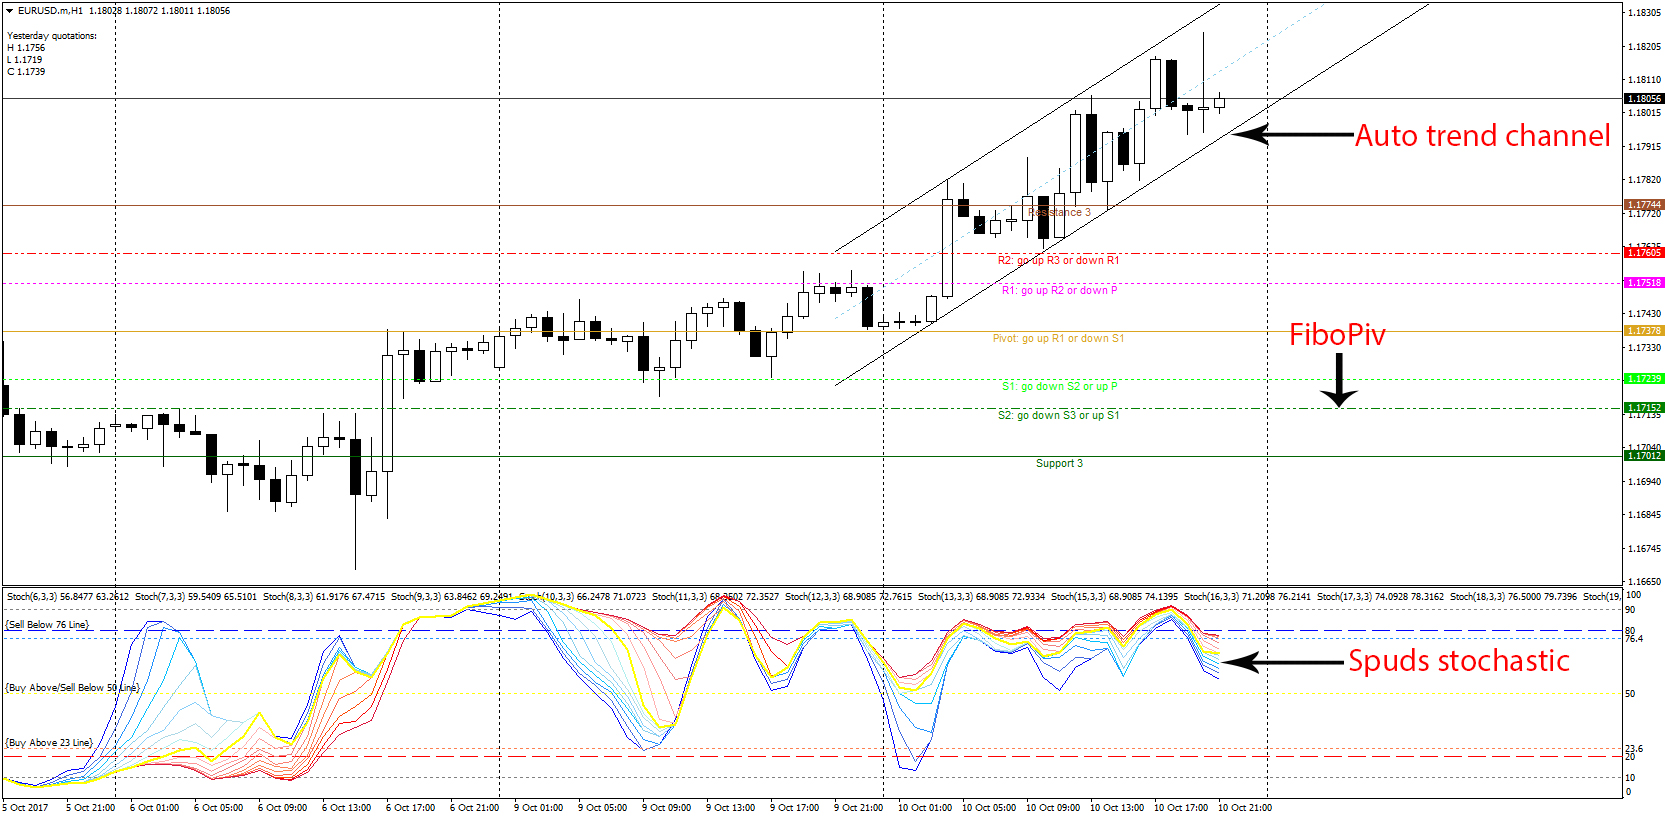
The most important one is the Auto Trend Channel, which draws the actual trendlines that create the channel. By default, the ‘Hours’ measure will be set to 24 and the colors to red and blue. The hour's measure determines how many hours back the trend is supposed to be established by the auto trend channel indicator. For example, the default 24-hour value traces the channel for the past 24 hours. This value is suitable for intraday trading and, hence is used on 30-minute and 1-hour timeframes. For higher timeframes, you will need to increase the value, for example, 60 hours for the 4-hour timeframe and 336 hours for the daily timeframe.
Other forex trading brokers will have different timeframes included, so you might have to try different variations on your own. The auto trend channel indicator will be used to indicate favorable entry positions as the market corrects itself. Here, you should be looking to trade the troughs on an uptrend and peaks on a downtrend. (Looking for market correction)
The second indicator will be the FiboPiv, which combines elements of the Fibonacci retracement and pivot points strategy. The charts will generate several support and resistance levels that you should watch for both trading opportunities and risk management. Typically, you want to buy at support levels during an uptrend and vice versa. (How to draw S/R levels like a pro)
Finally, the Spuds stochastic indicator is found in the indicator window, generating a set of 19 stochastic lines of different values. Together, they function both as an oscillator and for generating trading signals. The signal is given when there is a squeeze between the stochastic lines, showing market consolidation, as well as the level. For example, a squeeze occurring in the overbought territory signals a selling opportunity.
How to work the Autotrend channel trading system
With these three indicators understood, now it’s time to focus on how they can be put to use.
The situation in the markets right now points to a buying opportunity from the signals received. Here, the general trend is moving upwards as shown by the auto trend channel indicator lines. The bulls have been in control for the past 24 hours, and the most recent decline in prices is only a correction. We know it’s a correction because first, the FiboPiv indicator shows us that prices bounced off a support level 24 hours ago and have still not reached a resistance level. There is still a chance that prices could go higher to the level of resistance in the coming hours.
You can also notice a squeeze on the Spuds stochastic indicator below after the oscillator had reached oversold territory just about when prices had touched the lower trendline of the auto trend channel indicator. Overall, the general uptrend still holds and we should still consider upward momentum.
As for trade management due to risk management in forex, we look primarily to the FiboPiv indicator. Currently, we are awaiting prices to reach the level of resistance, and this is where we ought to place our take-profit orders. Assuming you had already bought the markets previously, now is not the time to close that position. Instead, simply move your stop loss order upward to the pivot point level just in case there is a change in tide.
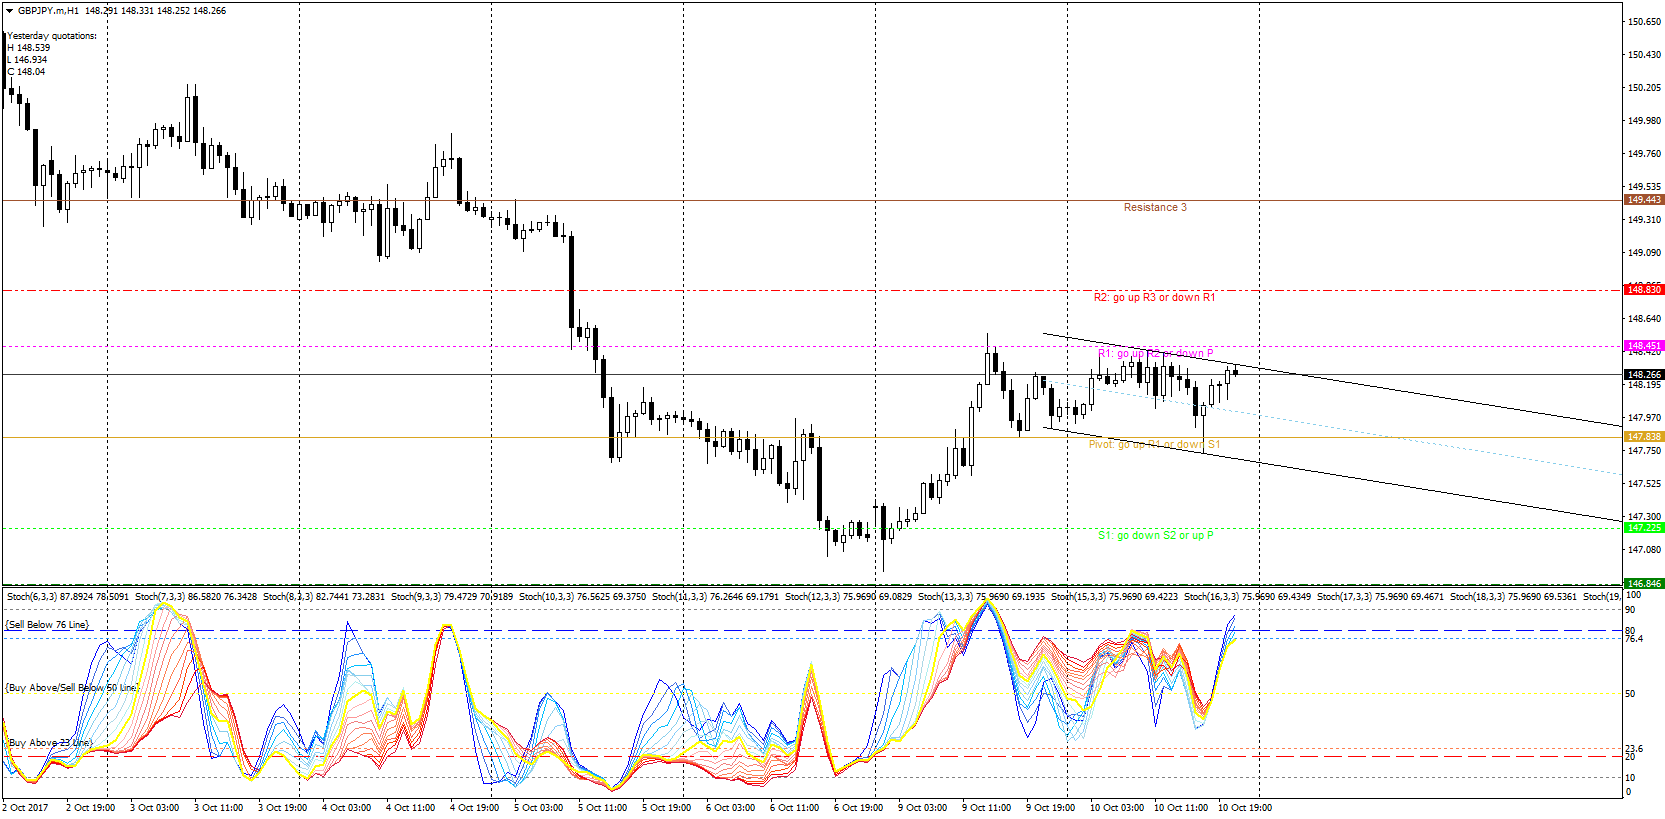
On the other hand, this chart represents an ideal selling opportunity, as you will notice the signals from the indicators are reversed. In this case, expect further downward movement, perhaps up to the support level, or the pivot point if you are a cautious trader.
Download indicators and template
There are other ways to use these indicators profitably, which can be illustrated in this video:
 VietnamUS