 Alpari
 XM
XMHave you ever been told not to be afraid of being different? Being the odd one out can benefit many areas of life, but it can be deadly while Forex trades. As a Forex trader, you want to avoid going against the tide – this is one field where crowd psychology is beneficial.

The main thing that causes the financial markets to move in a specific direction is how people think about a particular financial instrument. When many people believe in a currency, they tend to buy more of it and create a bullish market; if they don’t have faith in it, a bearish market is created when they sell that currency.
The bullish and bearish scenarios are characteristics of market sentiment, which is how people feel about any financial instrument. Don't forget to check out our detailed Forex.com Trading Services overview, after reading this article.
Understanding market sentiment
Now that you know what market sentiment is, in a nutshell, how do you identify it? You have to know your environment to succeed in it; therefore, to understand the global Forex market, you need to be aware of global financial movements from news announcements. For example, you can check our in-depth Exness broker analysis to learn more about the Forex market.
Upon comparing fundamental and technical analysis, it’s easy to see which of the two systems informs you about market sentiment. Even for technical traders, the importance of market sentiment cannot be ignored, and they still need to know about these sentiment indicators.
As the IC Markets trading conditions examined, there are probably just as many techniques as there are fundamental traders, so the actions of each group affect the entire Forex market. Understanding the Forex market sentiment becomes essential for every trader because you want to be among other traders when the markets shift.
For trading to occur, there have to be buyers and sellers, so if the Swiss Franc was bought for a long time, it becomes overbought, and pretty soon, the buyers will run out, and the sellers will take control. In this sense, market sentiment is not only for identifying trends but also for identifying signals of an overbought or oversold market.
Alright, that’s all you will need to know about using market sentiment to your advantage, but first, you will need to ‘observe’ sentiment, which is done through indicators.
Examples of sentiment indicators you should know
Traders use various measures to determine market sentiment, but we’re only going to focus on the most popular. Crowd mentality is critical here, and you want to be on the side with most participants. The three most popular indicators in the world are:
CBOE Volatility Index (VIX)
This is a measure calculated by the Chicago Board Options Exchange (CBOE), the oldest exchange for options in the world and one of the most popular in the market. I bet you’re wondering why a Forex trader should be interested in the options market if they don’t participate, but it’s all about accepting what you can get.
The Forex market is decentralized, and there is no single location from which to determine how market participants feel about any particular currency. However, if you remember the post on the history of binary options, you know that currency pairs are also part of the options market. You would also remember that they work by traders speculating whether a currency will be more or less valued. Since the options market is centralized, it is possible to know if people believe a particular currency will be more or less valuable later.
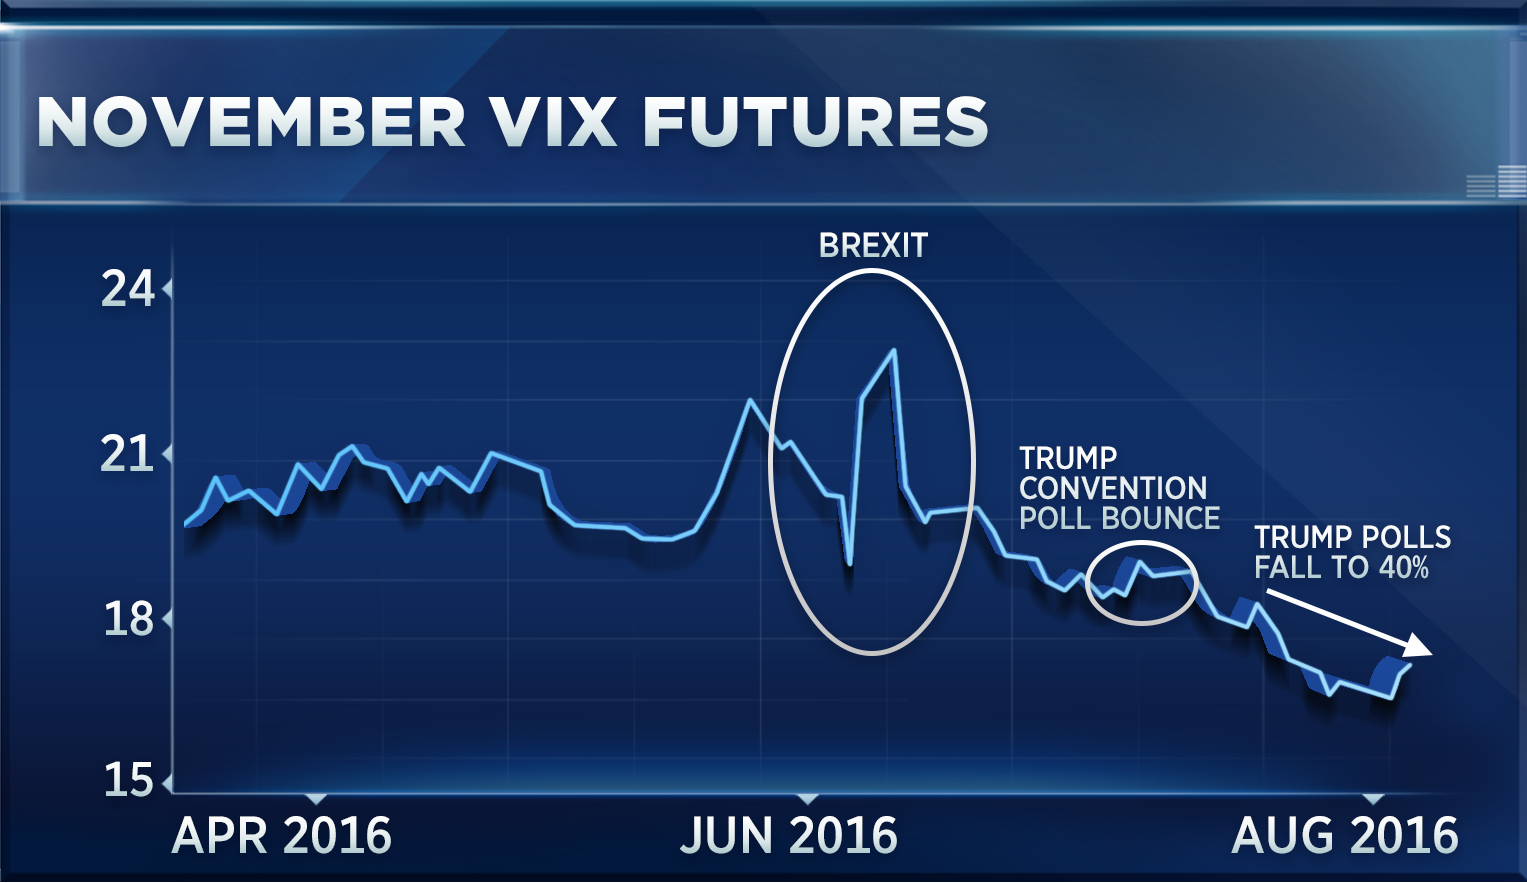
Living up to its “fear index” nickname, the VIX climbs when traders buy more currency call options and declines when more put options are purchased. Calls resemble going long, while puts mirror short positions. So, the VIX neatly encapsulates overall currency pair sentiment and expected turbulence.
While the precise VIX formula is complex, interpreting its results is straightforward. The sample chart shows that the VIX reacts strongly to major news events. This makes it a valuable predictive supplement to technical and fundamental analysis for Forex traders seeking an edge.
Though derived from elsewhere in the markets, the VIX offers traders invaluable insight into upcoming volatility and currency pair positioning. Its indirectly related origin does not diminish its utility when making trading decisions.
Since VIX is calculated based on S&P 500 index options, it represents the traders’ thoughts on the US Dollar. Hence, the good news for the dollar (bullish sentiment) is a rise in VIX, presenting an opportunity to go long on the dollar and vice versa. LiteForex Forex trading educational resources like blogs for beginners can help you find more information about VIX.
The Commitment of Traders (COT) report
The COT report is similar to the VIX in that it does not use Forex market data since it’s still decentralized. The CFTC (Commodity Futures Trading Commission) cannot get any data. However, it’s different from the VIX because instead of extracting data only from options exchanges, the CFTC finds its data from both the options and futures markets. The futures market differs from the options market but still involves currencies, and the information benefits Forex traders.
The report is published every Friday at around 2:30 pm EST (10:30 pm GMT+3) on the CFTC website. The US session of the week’s Forex trading session ends at 4:30 pm EST when major exchanges on Wall Street close for the weekend, and the release of the COT report causes a flurry of activity in the markets in the final minutes of the week. You, too, can use this information to make trades.
On the website, you will find information about various currencies, stocks, and commodities, showing how much traders have bought or sold each of these instruments in the past week. As you can imagine, this is a lot of information, and amateurs get confused by the volume of data, so I’ll cover trading with the COT reports in a separate post.
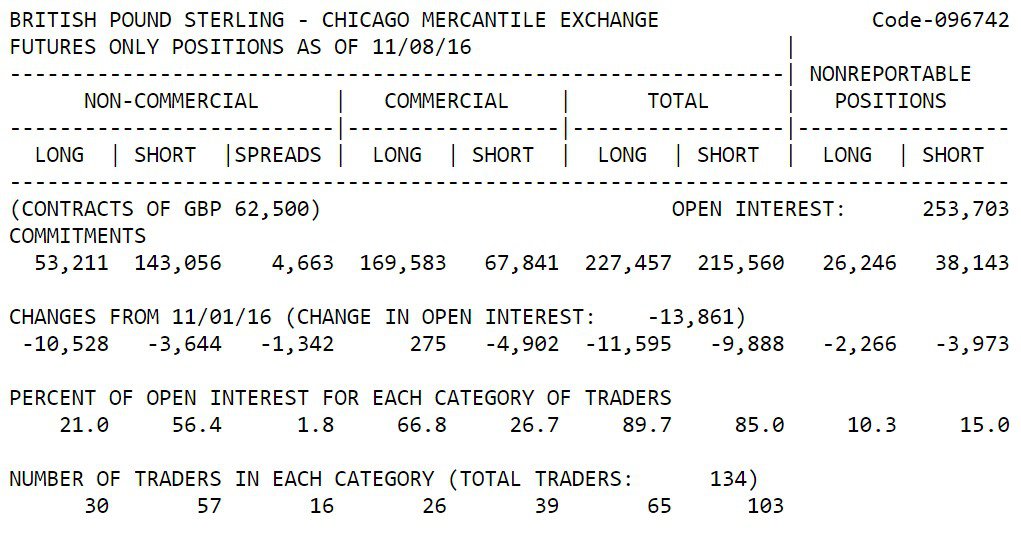
For now, you only need the basic principle – learn how much of a financial instrument has been bought or sold. Then, if a particular currency has been accepted far more than it has been sold, it may indicate that it’s been overbought and that you might look out for trading opportunities. You don’t want to be caught against the tide, so it’s only an indicator of potential selling opportunities, not that you should sell that currency immediately.
High/low sentiment ratio
This sentiment indicator compares the number of stocks reaching 52-week highs versus those reaching 52-week lows and calculates the difference as a percentage based on the total number of trades on that day. For example, the latest data received at the end of yesterday’s NYSE closing session showed 352 companies reaching 52-week highs against 320 reaching 52-week lows. The result, 32, is compared with the previous day’s high/low sentiment, and the percentage change is calculated. (Are you curious? Check the Exness Broker Leverage and Spread Options)
The results can then be converted into a visual graph showing the fluctuations for each company’s stocks or the entire exchange, the NYSE. This market sentiment is not limited to stocks, though, but can also indicate the highs and lows of futures, commodities, bonds, and interest rates, all of which can guide a Forex trader’s strategy. In the example above of the NYSE high/low index being 32, this might not be a massive indicator for a trading opportunity. On the other hand, the NASDAQ had 282 highs and 26 lows, which is a strong bullish sentiment. If you had this information before trading, you would look for buying opportunities there.
To use this indicator, you can download it from various online sources, install it against your Forex trading platforms, and use it concurrently with your Forex charts. Alternatively, you can find the information online and do your calculations. The former may seem attractive, but in most cases, you would be charged for it, so why not just do the work yourself? After all, no one ever told you Forex trading was easy, right? Besides, trading advisors have various pluses and minuses, and you should know them before downloading an indicator.
For more Top Brokers, check out our Alfa Broker, XM review, RoboMarkets review, and ActivTrades Forex Broker Review.
Listen to this to find out more about market sentiment: