 Alpari
 XM
XMStudying bare charts can be very difficult, let alone a huge bore. Most of the trading strategies we have covered in the section are quite easy to understand, but this is by far the most visual of them. Using colored indicators, it is very easy to understand what’s going on in the markets at just a glance.
Technical indicators used
At the bottom of this piece, you shall find a link to download several technical indicators and a template. These will be the indicators we shall use in this Haos visual trading strategy. When you add them all to your MetaTrader 4 platform, they are going to look like this:
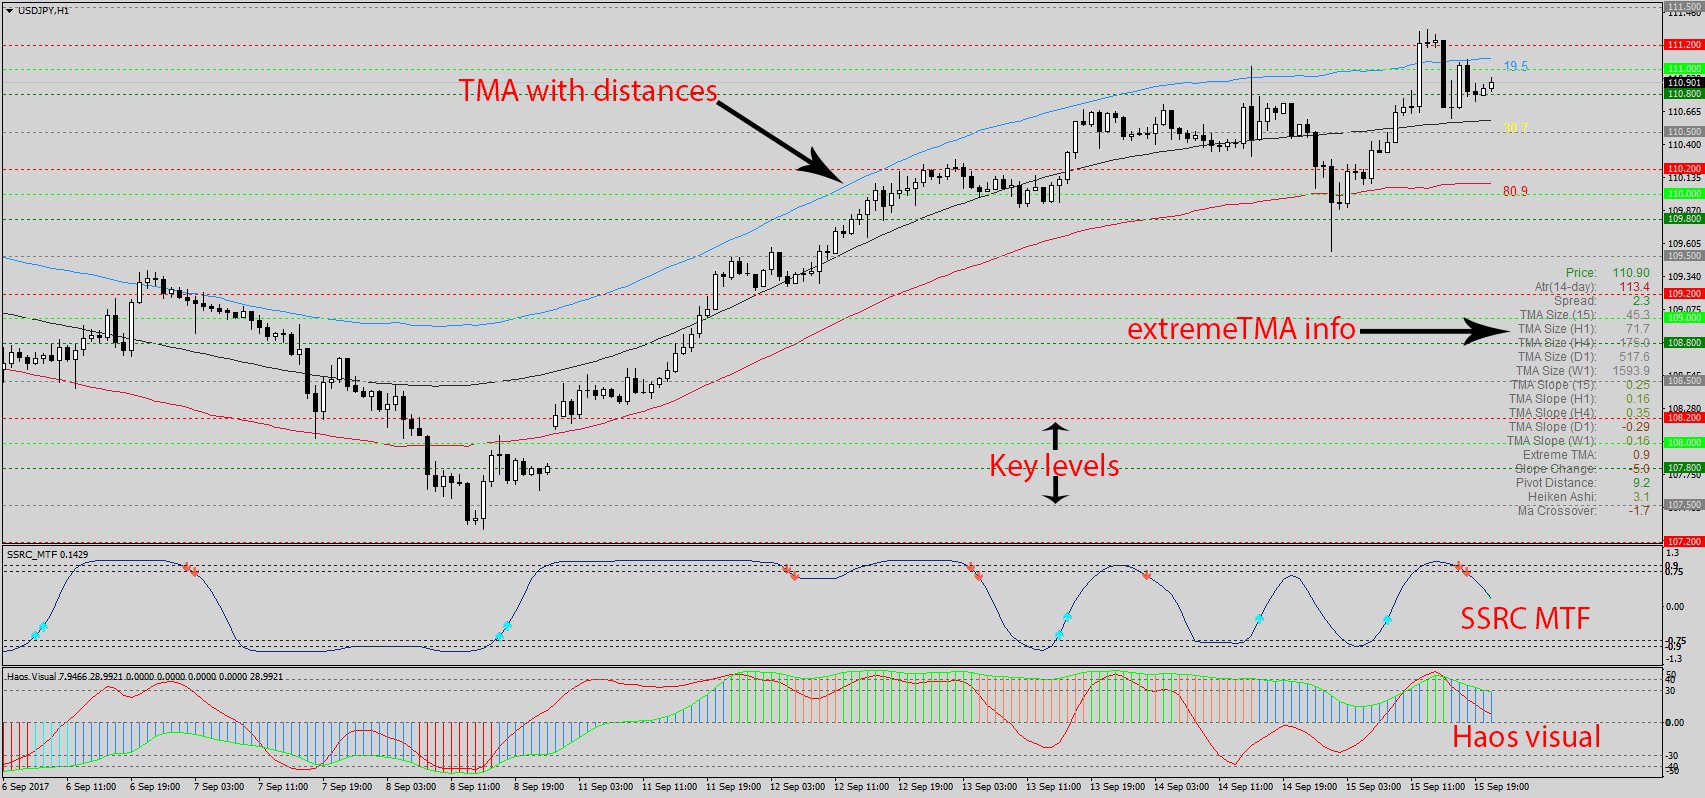
Haos visual
As the main indicator in the Haos visual trading strategy, the Haos visual indicator is going to be the most important. On the forex trading platforms, it will appear in the indicators window and not in the main trading window. There, it is represented by two lines, green and red, oscillating about a central level of zero (0). The green line is slower to react than the red line, and together they act in a similar way to the lines of the MACD indicator.
The first role they play is in indicating market sentiment whereby it is considered bullish when the two lines are above the zero level and bearish below that level. Besides their location how they relate to each other is also very important. Since the green line is slower, markets are considered to be in a strong uptrend when it is below the red line. That is so because it is a sign of market confidence both in the short and long runs. Therefore, a trading signal is also generated when the two lines cross – a cross by the red line to the upside says that the downtrend is over and that an uptrend is about to begin. When you see such a cross, it should be a trading signal to buy or sell depending on the relation between the two lines.
In addition to the lines, vertical bars radiate from the zero level to the slow green line. They are used to tell the strength of the current trend and are thus colored accordingly. When there is a strong downtrend, the bars will turn red and then green when there is a strong uptrend. In between, there will be blue-colored bars, which represent market consolidation when there is no clear trend and markets are ranging.
The best time to buy, based on all the signals of the chaos visual indicator is when the vertical bars turn green, the green line is trending upwards and below the red line while both of them are trending above the zero level. A cross between the two lines is not enough to indicate that an uptrend is underway, that only shows that such a scenario is possible. When looking to sell the markets, just reverse all the signals for a buying opportunity.
SSRC MTF
Also in the indicators window, this one shows points where markets are overbought or oversold, and when a strong trading signal occurs. The black oscillating line, showing markets are overbought when it is closer to the top and vice versa, plays the first role. The SSRC MTF indicator will also generate a trading signal both on the indicator and with a popup window. On the indicator, a signal to buy will be an upward-facing blue arrow while a downward-facing red arrow will be a signal to sell.
TMA with distances
You will find the TMA with distances indicator on the main trading window of the forex charts online. There, it will be represented by 3 lines – a black one at the center, a red one below, and a blue one above. Together, they create the TMA channel that borders price movements as they move. TMA stands for triangulated moving average, which means that it is a modification of the typical moving average. However, the values have been double-averaged to make them smoother and more accurate. By double-averaging, the TMA lines are slower and thus more reliable and less prone to fakeouts. (Forex strategy based on MAs)
Beyond creating the channel, it has the function of acting line a boundary for prices. The closer prices are to, say, the red line, the more likely they are to bounce up – as if they are repelled by it. On the upper side, prices will bounce down from the green line, but the central black line will be more of a pivot point. The purpose of the TMA with distances indicator is very similar to that of the envelopes indicator. (Uncommon technical indicators)
Other indicators
The 3 indicators above are the most important, but there are others bundled into the same archive. Key levels, for example, generate important support and resistance levels that could be applied while trading. Meanwhile, extreme TMA info just generates information about the market spreads, average daily range (ADR), etc. This is useful information that could complement the trading strategy, but not that essential. (How to draw S/R levels like a pro)
How to work the Haos visual forex trading strategy
It’s not enough to learn the indicators, you also need to know how you can apply all these principles. To make full use of this trading system, a majority of the trading signals from the indicators need to coincide, preferably all of them. Such a situation can only be witnessed by looking at an actual trading situation, in this case, a buying opportunity:
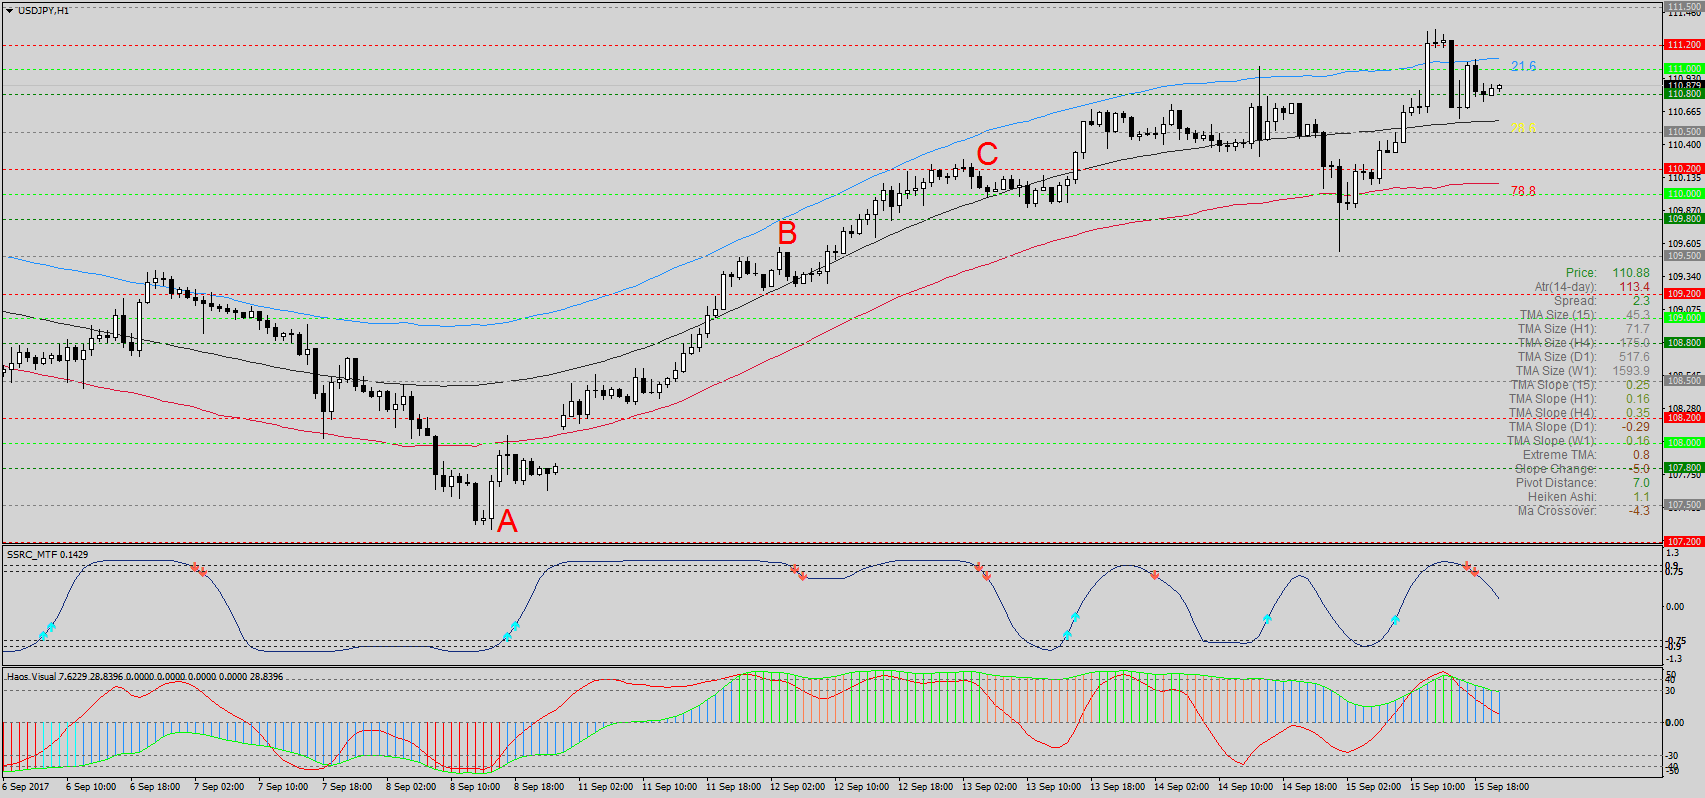
In the above image, we find a good opportunity to go long at Point C. Here, the SSCR MTF gives us a blue arrow facing up and a popup window to go long. That is enough of a signal that a short-term uptrend has formed, and a scalper can take that opportunity immediately. However, longer trends are more profitable, and for those we would need confirmation. (Long-term vs. short-term trading)
Down at the Haos visual indicator window, the vertical bars have just turned from red to blue, showing that the downtrend is fading and markets are consolidating. At this point, there is still no clear signal, but looking at the main trading window, prices have veered so far off the red TMA with distances indicator that they will likely be repelled to the upside. Now we have a good trading opportunity, but we still need confirmation, which comes a little while later when the red line of the Haos visual crosses the zero level to the upside. At this point, all indicators show bullish sentiment, and making a trade here would be safe.
To decide when to end the trade, you need to look out for reverse signals. The short-term trader who entered at point B could exit as soon as the SSRC MTF showed a red, downward-facing arrow at Points B or C. For long-term traders, though, they would wait until the majority of the signals showed bearish sentiment. So far, only a few signals show signals to sell, meaning that the current uptrend could continue. Until all the indicators coincide, you should hold on to the trade. (Forex market sentiment indicators)
However, remember to keep an eye on the forex calendar as you hold on to a trade, critical news announcements can break market trends very quickly.
If you use the Haos visual system for long-term trends, you need to know how to identify support and resistance levels. This is one way to do so described in a short video: