 Alpari
 XM
XMTechnical analysis is as much an art as it is a skill that can be acquired through practice. It is a skill because anyone can be taught a particular technical analysis trading strategy, but it is also an art because, over time, every trader will refine the original style to suit them. This is exactly what the Hama scalping system provides, a trading strategy based on price action that anyone can learn to use and over time make personal by altering some parameters.
So, if this trading system is solely based on price action, what is price action anyway? Well, it is a method of analyzing chart patterns to find some similarities in the past which might be used to establish predictions for the future. I suppose you could say technical analysts believe that history will repeat itself, and they are often right. Without further ado, let’s jump in.
How to use the Hama scalping system?
The entire trading system uses 2 primary indicators:
- the X3 Semafor – these are the red, green, and cyan circles at the top of the highest and lowest price points
- the FTI Hama System – represented by the vertical bars in blue and red that tend to follow the direction of the candlesticks provided by the reliable and proven Forex broker.
As I mentioned, everyone makes use of these indicators differently to create their setup, here’s what my Forex charts look like:
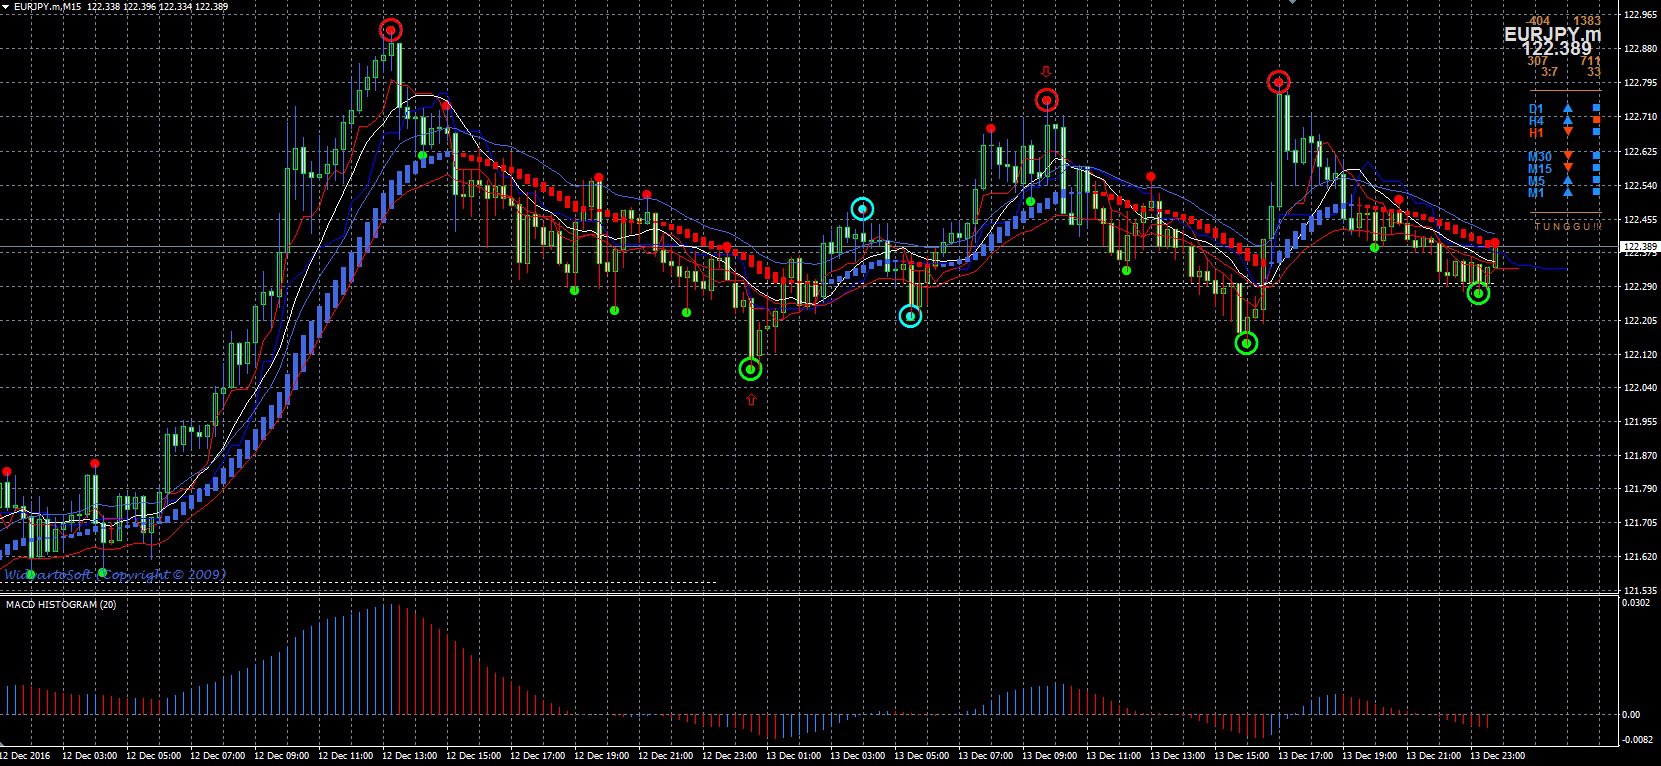
It may look messy to you, but that’s just because I’ve added some more indicators. As we all know, it’s important to have a few more indicators to confirm the information provided by the first 2, so the following 6 indicators may be added according to your will:
- Kijun Tenkan – the small blue and red lines following the direction of the candlesticks
- Daily open line – the horizontal line stretching from the time the Sydney session begins up until the New York session ends
- Mini sinyal – On the top-right-hand side are a bunch of figures representing the direction of the markets on various timeframes from the M1, M5, M15, M30, H1, and H4 to the D1
- The MACD histogram – is set to an oscillating period of 20
- The simple moving average (SMA) is set to 11 periods to catch minor trend changes
The above are my indicators, but there are several more bundled with the archive file provided, and these include:
- The exponential moving average (EMA) is set to 200 periods which is perfect for a swing trader looking to catch long trends after awaiting confirmation of the trend
When to place trades
Price action is about taking note of moments in the past when trends changed direction after hitting crucial support and resistance levels, and pivot points and the main indicator for this is the X3 Semafor. When this indicator turns green, it shows you a possible uptrend, so you should be looking for an opportunity to buy. You can see how it worked out in the setup below:
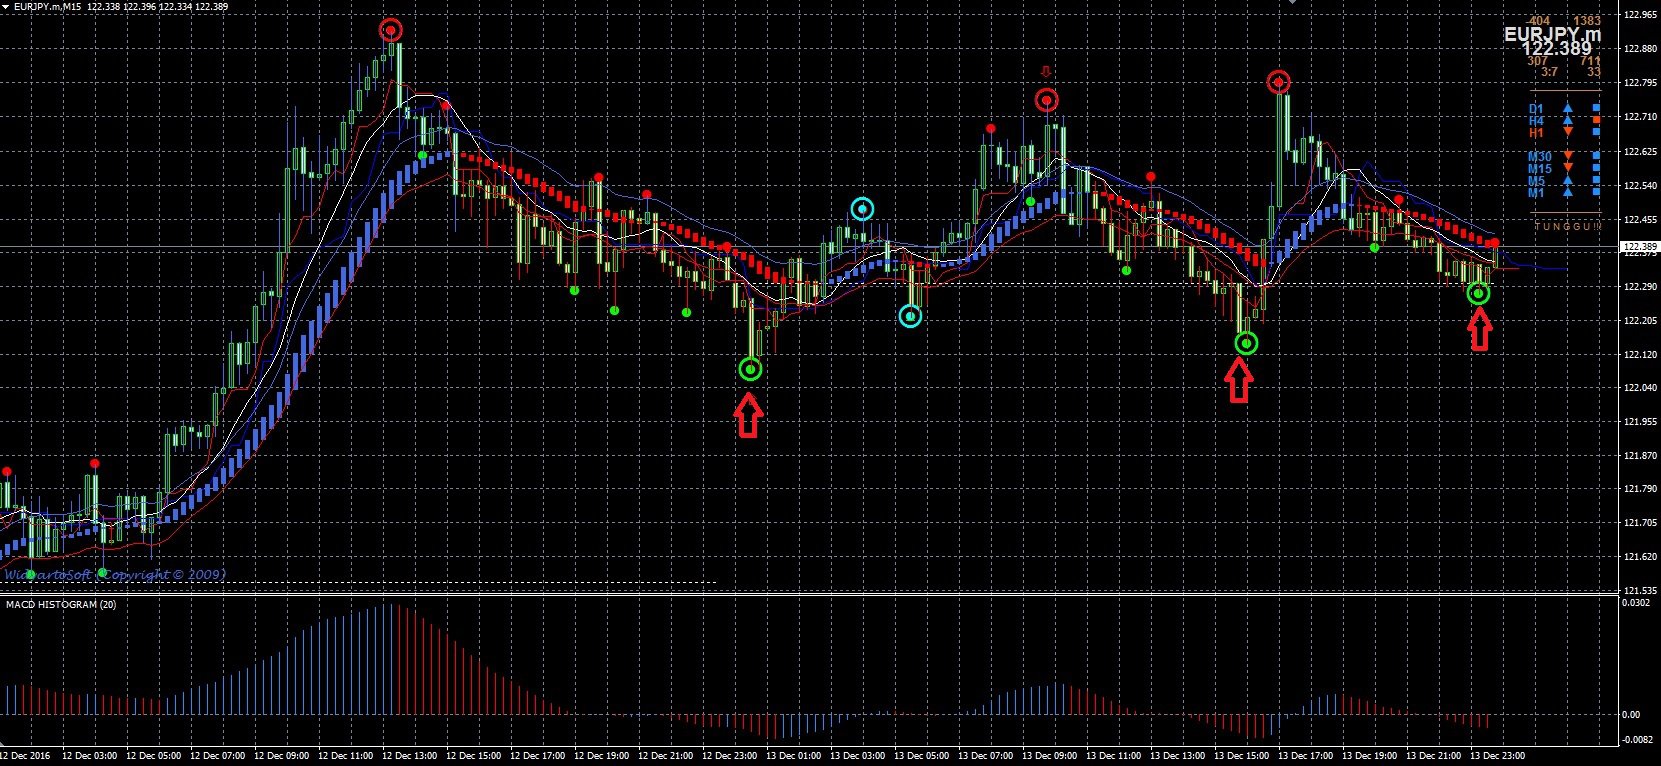
As you can see, the trend is already rising, just like the indicator suggests, and a scalper may already have made more than 50 pips, but a cautious trader would wait until the Kijun Tenkan crosses the moving average upwards. The color of the FTI Hama system and the MACD should also turn blue to confirm a bullish market.
If all these conditions have not been met, this is what would have happened just a few minutes later:
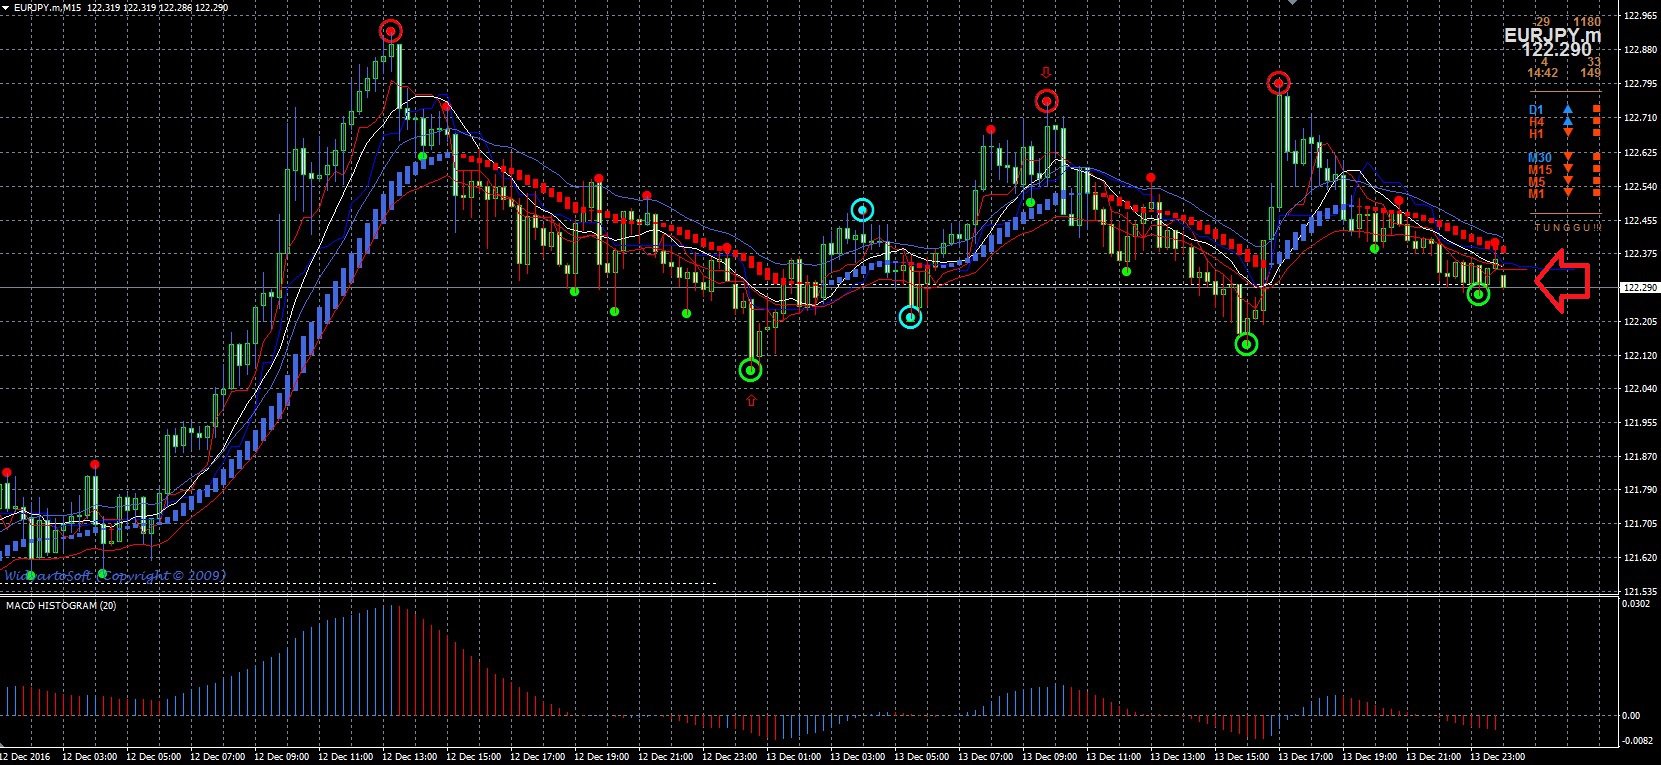
You can see that the trend reversed because all conditions were not met, this is why it’s always advisable to wait for a confirmation, even if you lose a few pips during the wait.
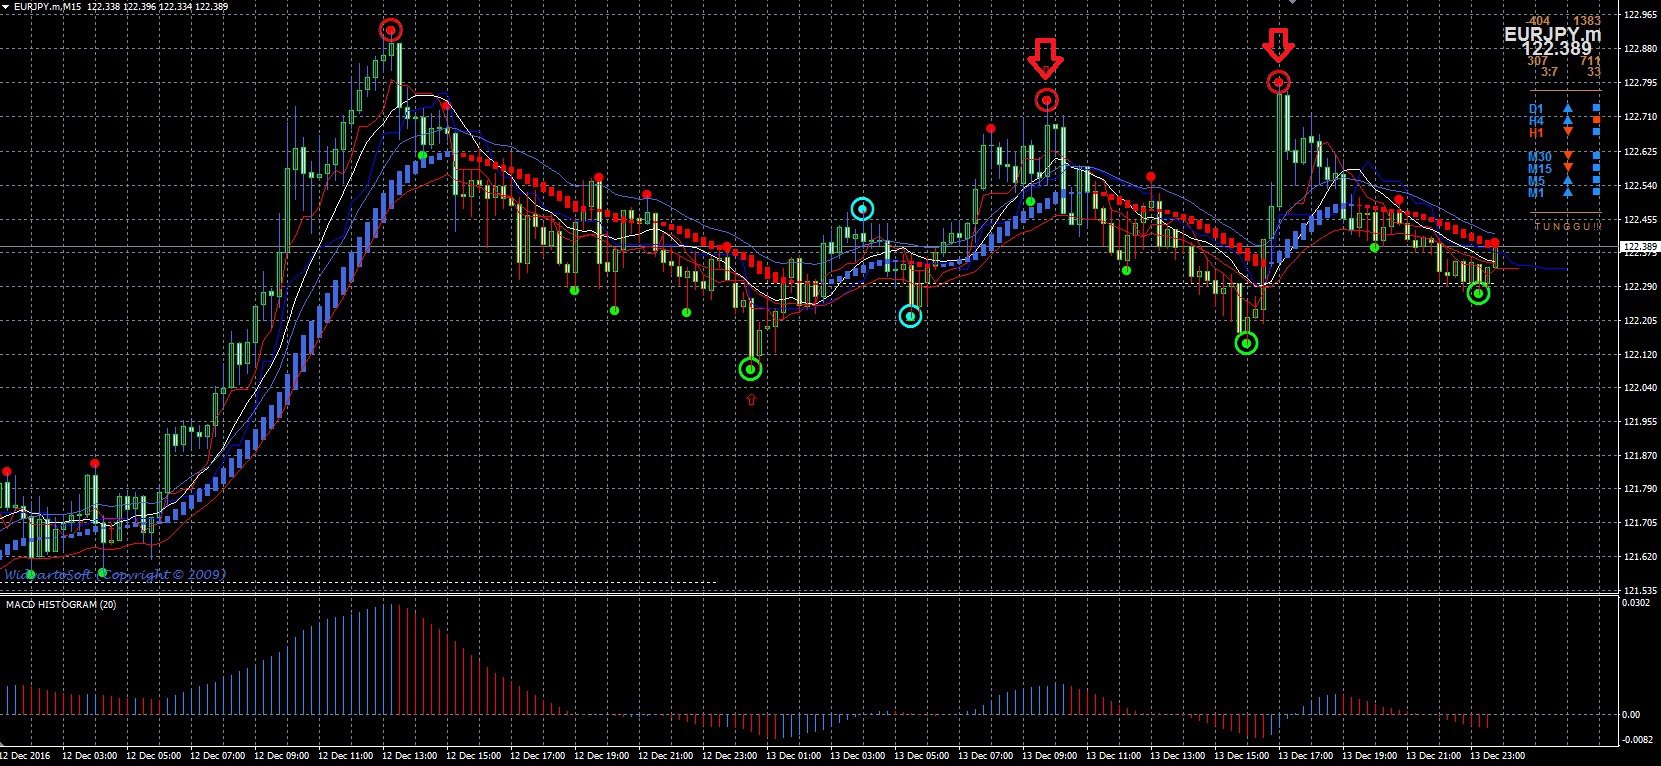
When looking for a sell order, the X3 Semafor should show a red circle, such as in the points represented in the image below. Again, you should wait for a confirmation of market sentiment, and this comes in the form of red FTI Hama System bars, the Kijun Tenkan crossing the moving average line heading downwards, and a red MACD indicator.
Of course, we’re not going to be placing any trades without taking care of risk management. The stop-loss should be placed at the previous peak in a sell order or at the previous valley in a buy order. These peaks and valleys represent critical support and resistance levels which, if broken, can lead to massive breakouts and, subsequently, massive losses. Now you can see why the X3 Semafor indicator is so important to this system.
What to remember about this system
There are always tips to keep in mind when using a new trading strategy, these are simple:
- It can work on all timeframes and all currency pairs. The good thing about technical analysis is that it works regardless of the changing factors because it simply uses price action, which is always in action on all currency pairs and timeframes
- It is most appropriate for trading with binary options. The presence of a higher period moving average, the 200 period EMA, reduces the number of short-term trades and makes it ideal for binary options with an expiry time of 1 hour and above. Given the simplicity provided by the X3 Semafor indicator, up or down, also makes it most suited to binary options which are all-or-nothing options
- While using technical analysis to make trades, you should always keep an eye on the Forex calendar for any important news announcements. These announcements always change the direction of the trend and can make the indicators irrelevant
If you’re still new to binary options, we have a list of the top binary options brokers which you can choose from and kick start your journey into binary options.
For those who are still not very familiar with technical indicators, here's a video with some of the most basic indicators: