 Alpari
 XM
XMThe best technical analysis tools have been tried and tested many times. What better way to find one than among the oldest ones? Gartley is one such tool that involves the study of chart patterns. (Comparing fundamental and technical analysis)
History of the Gartley Pattern
It was created by Harold Gartley back in the 1930s in an attempt to identify whether markets were truly chaotic as everyone thought, or if there was some order in them. This was back when the Great Depression hit the US, primarily due to the stock market crash of 1929. At that time, many people believed the markets were a gamble and that there was no way of predicting market direction.
Upon discovering the now-called Gartley pattern, Harold Gartley wrote a book detailing his analysis of chart patterns, which is now a viral strategy. Initially, he applied his theory to the stock markets and indices, notably the Dow Jones Index, but more uses for it were found in other markets, including the Forex market.
Today, you might also find it referred to as the ‘222’ pattern – the same thing.
Formation of the Gartley pattern
Now that you know what it is, how does it apply today in your Forex trading? As I mentioned earlier, it is an analysis of chart patterns to discover the direction markets might take. The Gartley pattern is used to confirm whether there is an actual reversal in a trend or if it is just a fake-out. It also involves a lot of Fibonacci, so you should be clear on using the Fibonacci retracement.
The 222 patterns are defined by five basis points – X, A, B, C, and D in a pattern such as the one below:
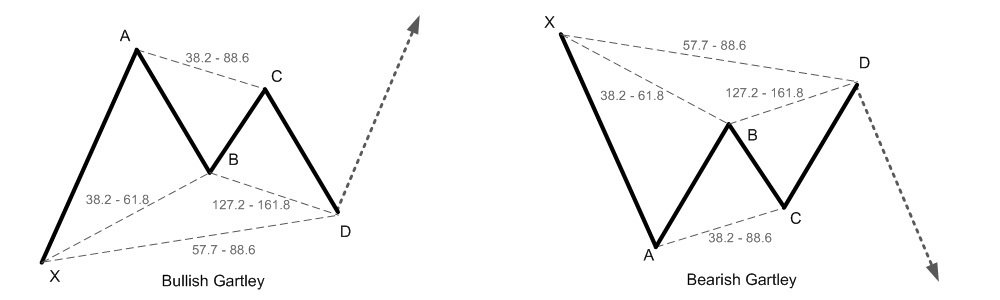
The trend between X and A represents the previous trend. At the same time, AB is the correction, BC is the recovery, CD is the second correction, and finally, the original trend resumes after point D. Market correction is standard in the Forex market, so there have to be some fulfilled conditions to distinguish the Gartley pattern from a regular market correction. (Looking for market correction)
- trend AB should reach the 61.8% Fibonacci level of the trend XA
- trend BC should reach either the 38.2% or the 88.6% Fibonacci level of trend AB
- Fibonacci levels of CD will depend on the levels reached by BC. If the trend reaches the 38.2% level, then CD should go up to 127.2% or 161.8% if BC reaches the 88.6% Fibonacci level
- trend CD should be at the 78.6% retracement level of XA
Below is a screenshot of AUD/USD Forex charts online indicating each of these 5 points:
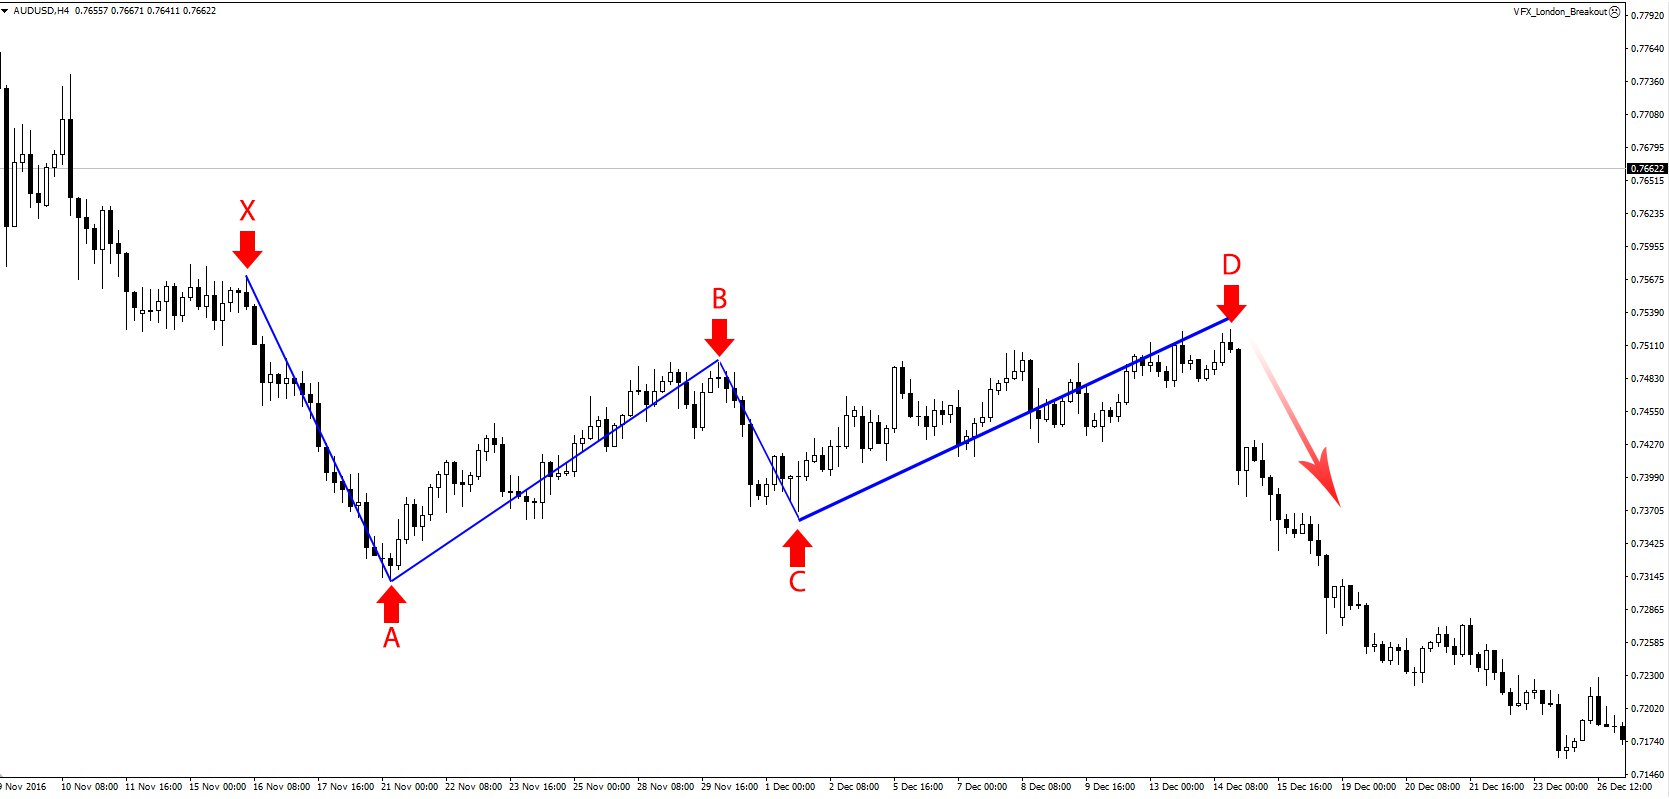
Initially, trend XA was a downtrend, and trend AB seemed to be a corrective wave. However, when BC failed to make a lower low, it seemed like a trend reversal. The CD confirmed the trend reversal by creating a higher high (D is taller than B), which usually indicates the presence of an uptrend. From D, the original downtrend in XA resumed, proving that this was a Gartley pattern and not a trend reversal. (Compare this to the Elliott Wave Theory)
So, how do you tell a Gartley pattern from a trend reversal? You have to use Fibonacci retracement levels for that. Let’s start with the trend AB – the guidelines above require that AB reach the 61.8% retracement level of XA and…
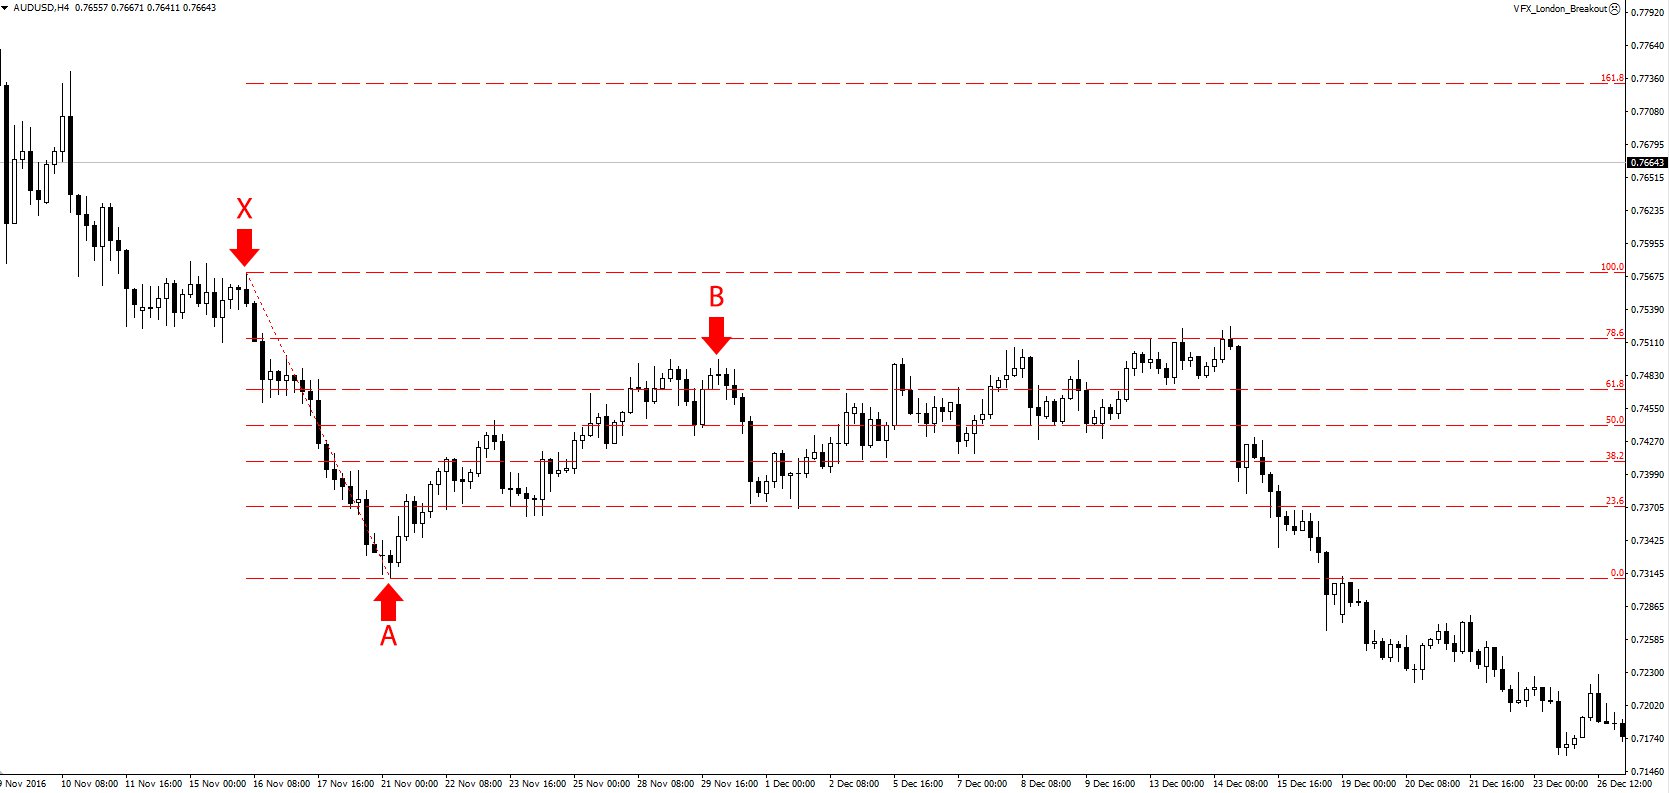
Voila! Point B attempted to break the 61.8% Fibonacci level but, after several attempts, failed to do so, turning the trend downwards. You will also notice that CD reaches the 76.8 retracement level of XA according to the guidelines of a Gartley pattern.
As for point C…
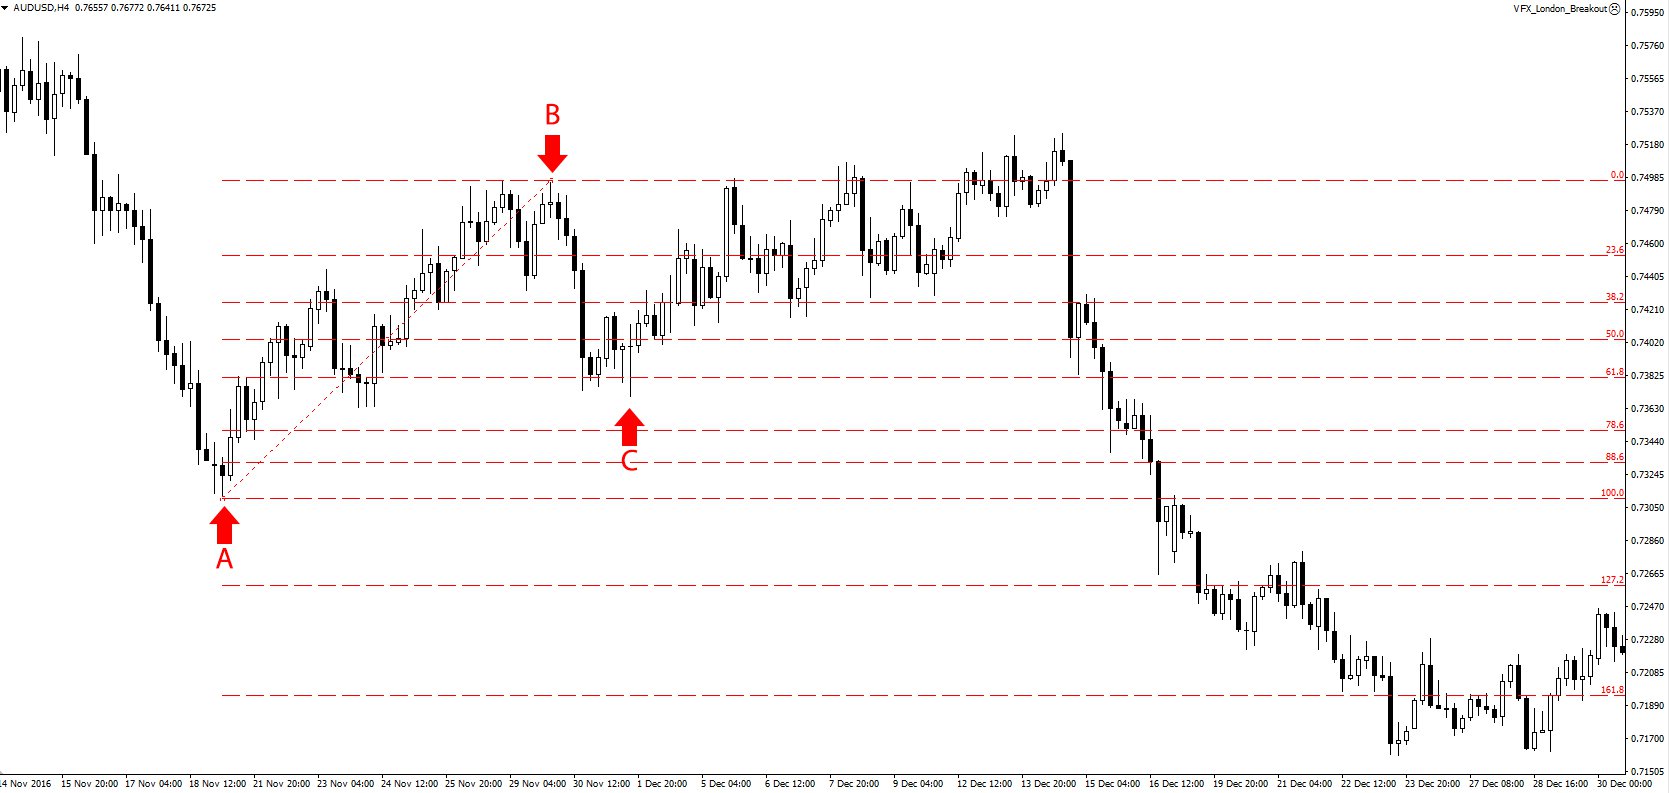
The trend broke through AB's 38.2% Fibonacci level for a while, before bouncing back and re-establishing this level with several bounces. The reason for the breakout was increasing speculation that the FED would raise interest rates, causing the US dollar to become stronger. Later on, the Gartley pattern resumed. This is why it is also essential to keep an ear to the ground and an eye on the economic calendar Forex.
Therefore, trend BC could be seen as having reached the 38.2% Fibonacci level despite the small fake-out.
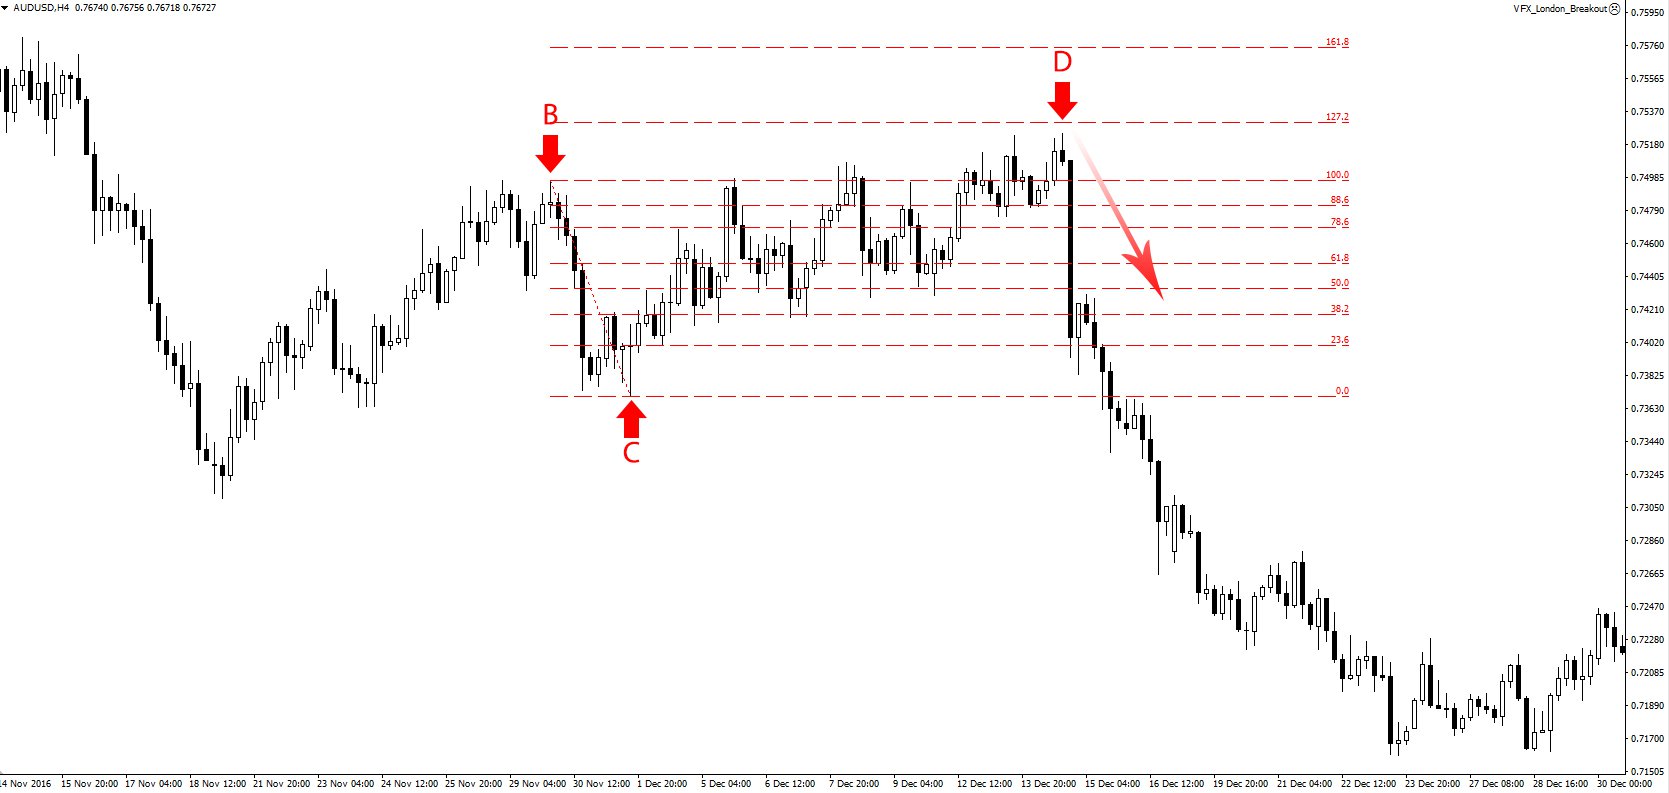
Trend CD was another uptrend, going up until it almost touched the 127.2% Fibonacci level of trend BC. Even though it didn’t get there, it was enough to prove a Gartley pattern. After reaching point D, the XA downtrend resumes, and there is a massive movement to the market downside.
This is the purpose of recognizing the Gartley pattern; a trader would know that the seeming reversal of downtrend XA is just part of the pattern. This pattern can occur in both bearish and bullish markets; the above was a bearish market, and you can reverse the trends in a bullish market.
Uses of the Gartley pattern
This technical analysis provides the most essential need to every trader: entry points to trade. Unfortunately, to determine if it is genuinely a Gartley pattern, you have to wait for the entire trend, which means you will only benefit from the final trend, not those in between. Nevertheless, this trading strategy is usually very effective and leads to a powerful trend, which makes up for the wait (How to create a trading strategy).
In the above example, a trader could place a sell order at point D and wait for the downtrend to continue. If one had, they would have made lots and lots of pips from that trade. Besides entry points, the pattern informs you where to place a stop-loss. Remember to do this because even though this strategy is usually right, it’s not always 100% correct. The best strategies, such as this one, are ‘usually’ right, and anyone who offers a 100% win is a liar.
Anyway, for purposes of risk management in Forex, place a stop loss around the level of point X. In a downtrend such as the one above, place the stop loss slightly above point X and vice versa in an uptrend. The stop loss is placed here to allow the move to develop. As we have seen in trend BC, it broke through the 38.2% Fibonacci level before bouncing back and re-establishing this level. This is a common occurrence, so you should not place the stop-loss directly above point D.
As for your profit targets, this will depend on your trading strategy (I'd like to know how to choose a trading strategy?). Short-term traders may decide to close the trade after a few hours, but a long-term trader may wait for several days. (Long-term vs. short-term trading)
This strategy does not provide profit targets; you must determine those by yourself. The best way is to use a trailing stop or manually drag the stop-loss along as the downtrend continues. Doing so will ensure you get the most out of the trend and milk as much profit from that one trade as possible.
For more of the Top Brokers, make sure you check out our best Forex Broker for Trading Gold list.