 Alpari
 XM
XMThere are so many tools that Forex traders make use of to try and predict future market movements. You can see this by checking the numerous technical indicators found in most Forex trading platforms. The point of using indicators is to identify the most ideal opportunities to place a trade, even though you can never know for sure.
Unlike most people who saw the financial markets as chaotic and without any particular pattern, Ralph Nelson Elliott thought otherwise. He believed markets move due to supply and demand forces as a result of investor psychology, and this could be gauged. The created Elliott wave theory was meant to do just this, and soon it became a very popular technical indicator. Initially, it was primarily used for the stock market, but with time it was adopted into other markets as well.
Learning this theory is crucial for any trader because it has been proven to be effective again and again, here are the basic guidelines:
How to spot an Elliott wave formation
An Elliott wave is formed by a dominant/motive trend that raises the price of the currency pair in a bullish market and lowers the price in a bearish market. Afterward, a corrective trend is formed that returns the value of the currency pair to its original position.
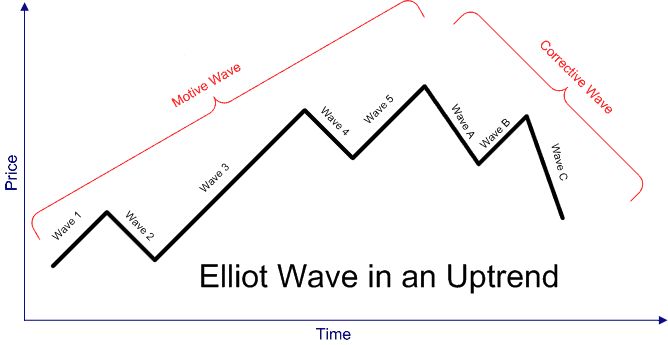
Both the dominant and corrective trends do not move consistently, but instead in a series of wave patterns. In the first part, the waves are referred to as impulse waves, and on the opposite side are corrective waves. To begin with, let’s study the formation of the dominant trend by the impulse waves:
Dominant trend
This segment of the Elliott wave can be driven by either a bullish or bearish market sentiment that pushes prices higher or lower respectively. It is made up of 5 impulse waves. In this example, we’re going to look at the Elliot wave formation in a bullish market, but it can work similarly in a bearish market if you just reverse the pattern.
Wave 1
The first wave is usually made of a relatively small movement in the price of the currency pair. This usually happens after a long bearish trend has just ended signaling that the market prices might turn.
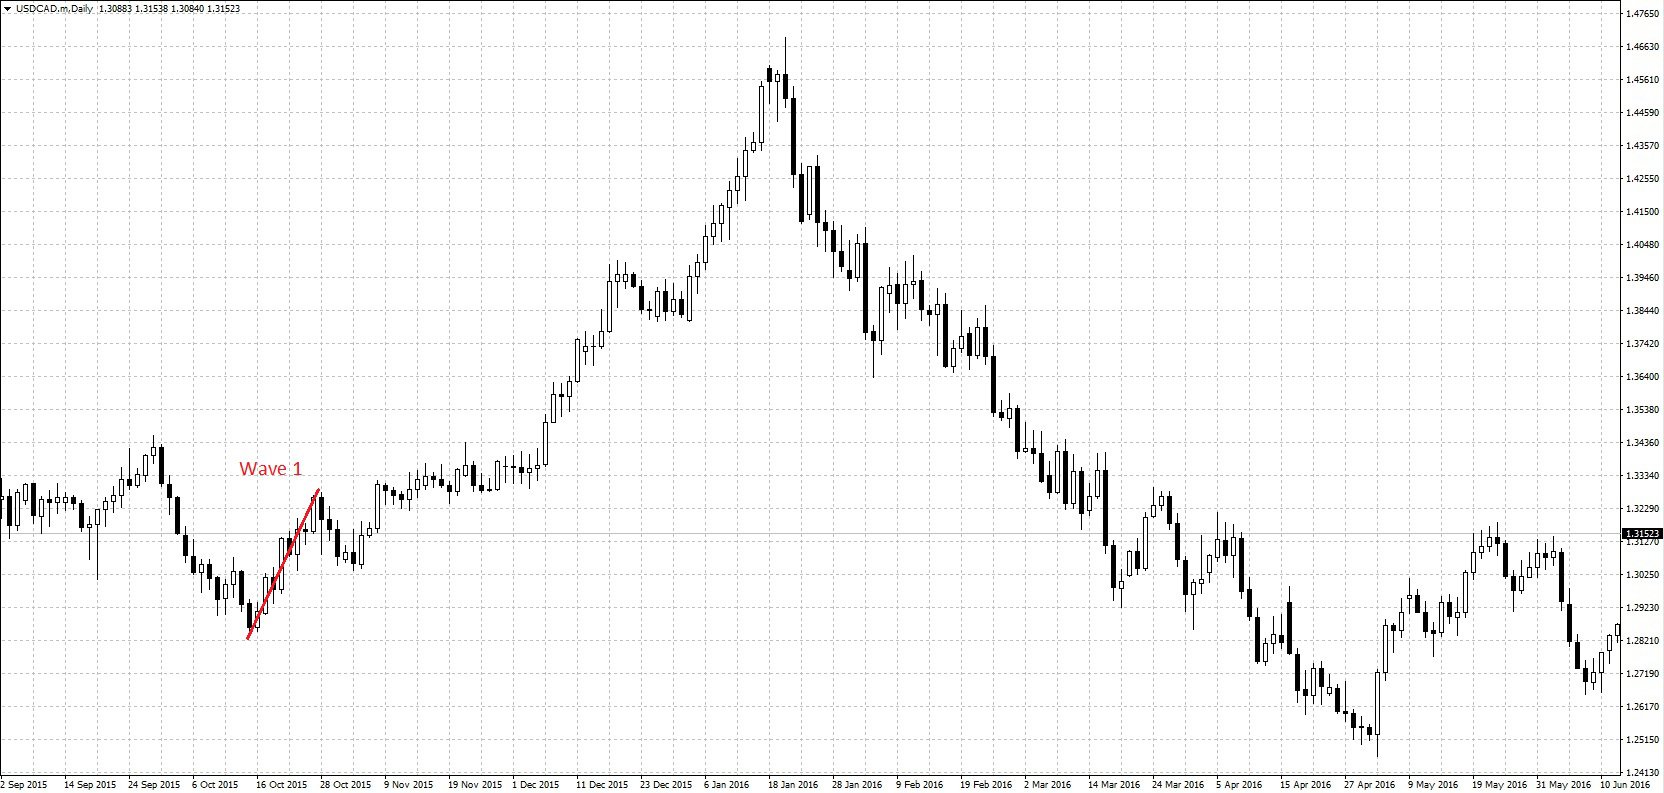
At this point, most traders view this first wave as a correction to the previous trend and believe the previous trend will resume. As a result, market sentiment is usually negative and most traders never get in on the trade at this point, and neither should you. To confirm whether an Elliott wave is truly about to be formed, you have to wait for the second wave.
Wave 2
After a rise in market prices for the currency pair, a market correction will occur with the formation of a slight downtrend. To confirm whether this is truly the second wave of the Elliott wave, this wave must be smaller than the first impulse wave.
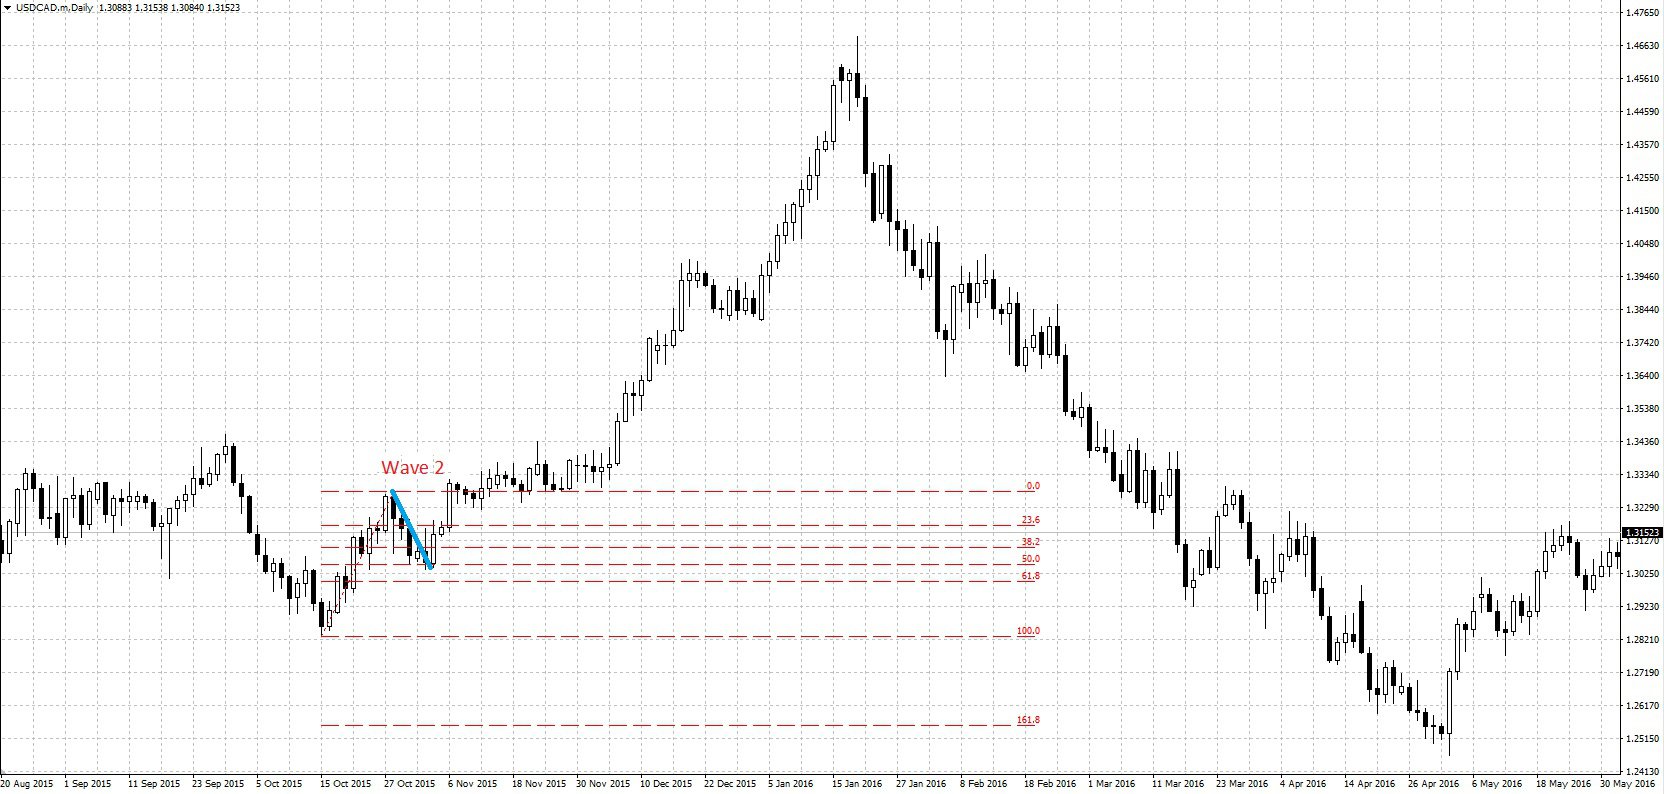
The general rule is that this wave should not be greater than the first wave – if it is, the initial sentiment of a continuing downtrend would be true. However, if the second impulse wave does not go below the 61.8% level of the Fibonacci retracement drawn on the first wave, this is a strong indicator that an Elliott wave is about to be formed. You can see that in the above example, wave 2 only got to the 50% Fibonacci level.
In some cases, though, the 2nd wave can go below the 61.8% Fibonacci level, but as long as it doesn’t cancel the 1st wave, it can still be considered to be the 2nd wave. This can happen when the market sentiment is still very bearish with traders believing the downtrend will resume and opening many short positions. Nevertheless, the market correction will bottom out and reverse into the 3rd wave.
Wave 3
This is often the longest uptrend in the Elliott wave because, at this point, traders have realized that the former downtrend is truly over and the market is bullish. Another characteristic of the 3rd wave is that it follows the golden rule of 1.618:1, which means that the 3rd wave will be 1.618 times longer than the first wave.
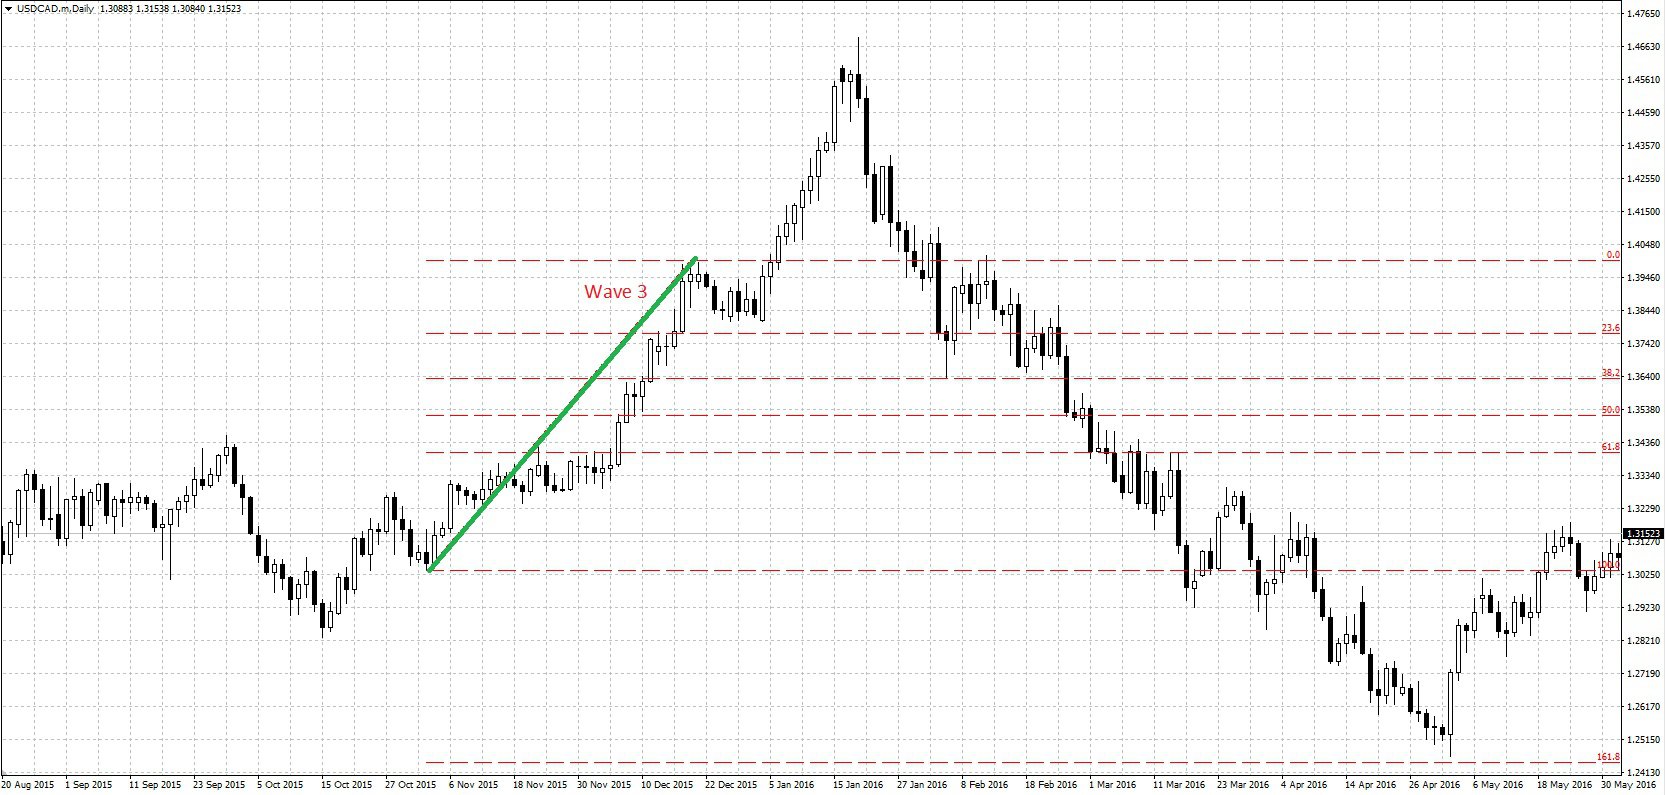
This is the best position to enter a long trade because long positions are increasing and traders have all realized the market is bullish. The trend in the 3rd wave is usually smooth as the entire market sentiment turns bullish and the news is positive. Furthermore, the 2nd wave should act as a confirmation signal to enter the market, and you can confidently do so.
Wave 4
After a long upward trend, again, a market correction will occur by reversing the trend slightly with the 4th wave. Most technical indicators will indicate that the market is overbought and weaker hands will start to close their positions and take their profits. By weaker hands, we’re talking about most day traders who don’t like holding on to trades for too long. Besides, they consider the profit they have already made to be enough, and long positions will be closed. At the same time, traders looking at technical indicators and seeing the overbought conditions will open short positions, and all this will cause the trend to reverse slightly.
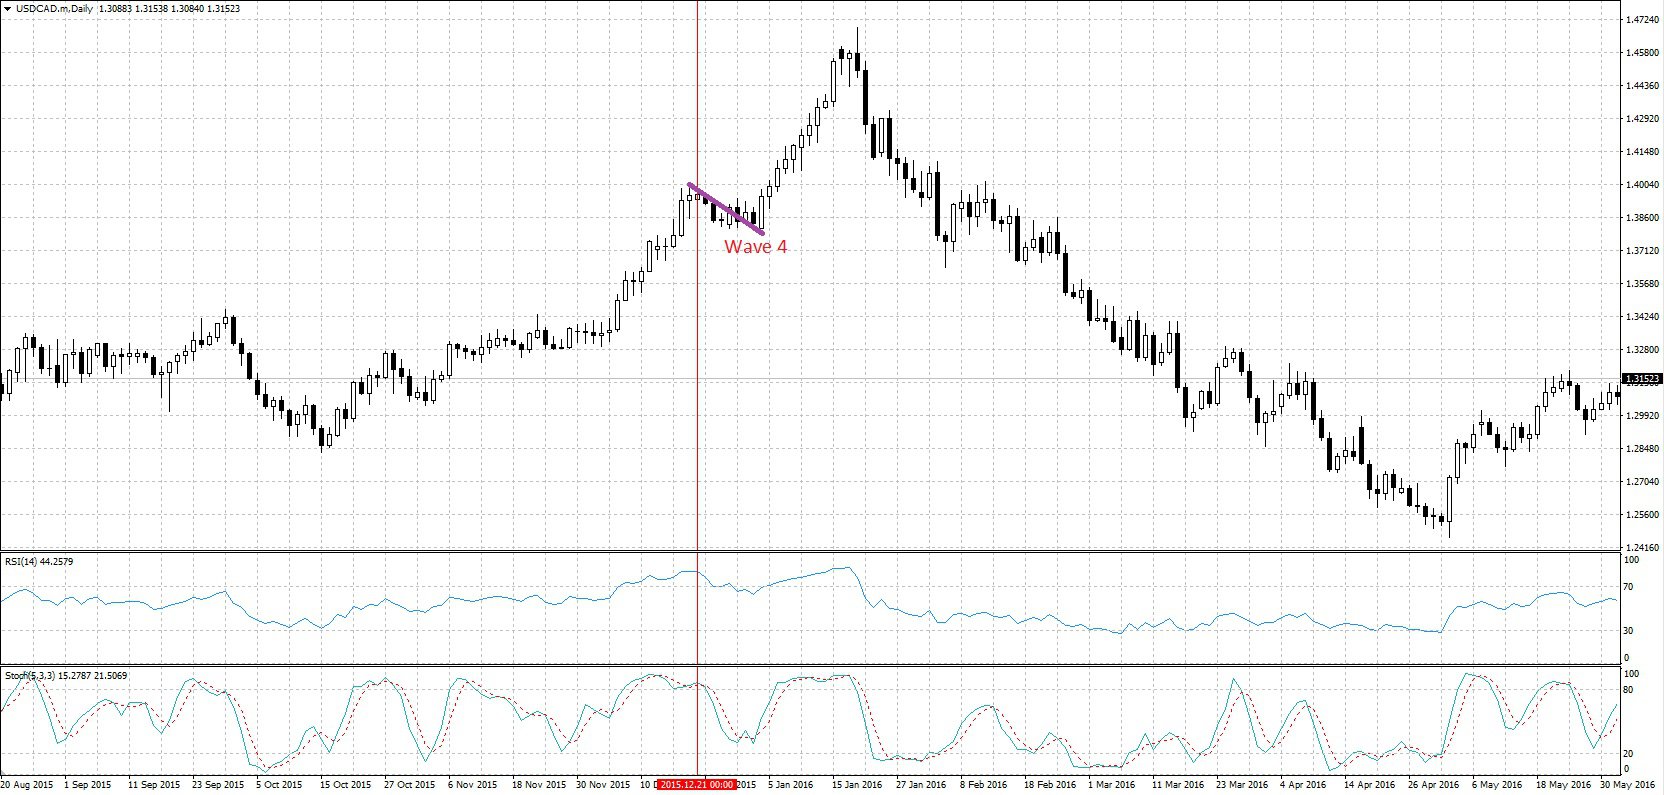
In the above example, you can see the stochastic and relative strength indicator (RSI) showing an overbought market, which would cause many to close their positions.
This 4th wave won’t last very long, though, because all the big players who know about the Elliott wave theory were expecting this reversal and will still be keeping their long positions open and opening more positions in anticipation of the 5th wave. There are also the latecomers who will start to notice the Elliott wave formation and open long positions, all these resulting in an end to the slight downtrend of the 4th wave.
Most of the market sentiment is bullish, anyway, so the dip in wave 4 will not go below the 50% Fibonacci level drawn on the 3rd wave. Usually, it only reaches 38.2% or goes sideways before giving way to the final impulsive wave. Remember that wave 4 should dip less than wave 2, otherwise, there isn’t a real Elliott wave.
Wave 5
The final upward push happens in this impulse wave, and the trend continues higher, although the trend is not as long as the 3rd wave.
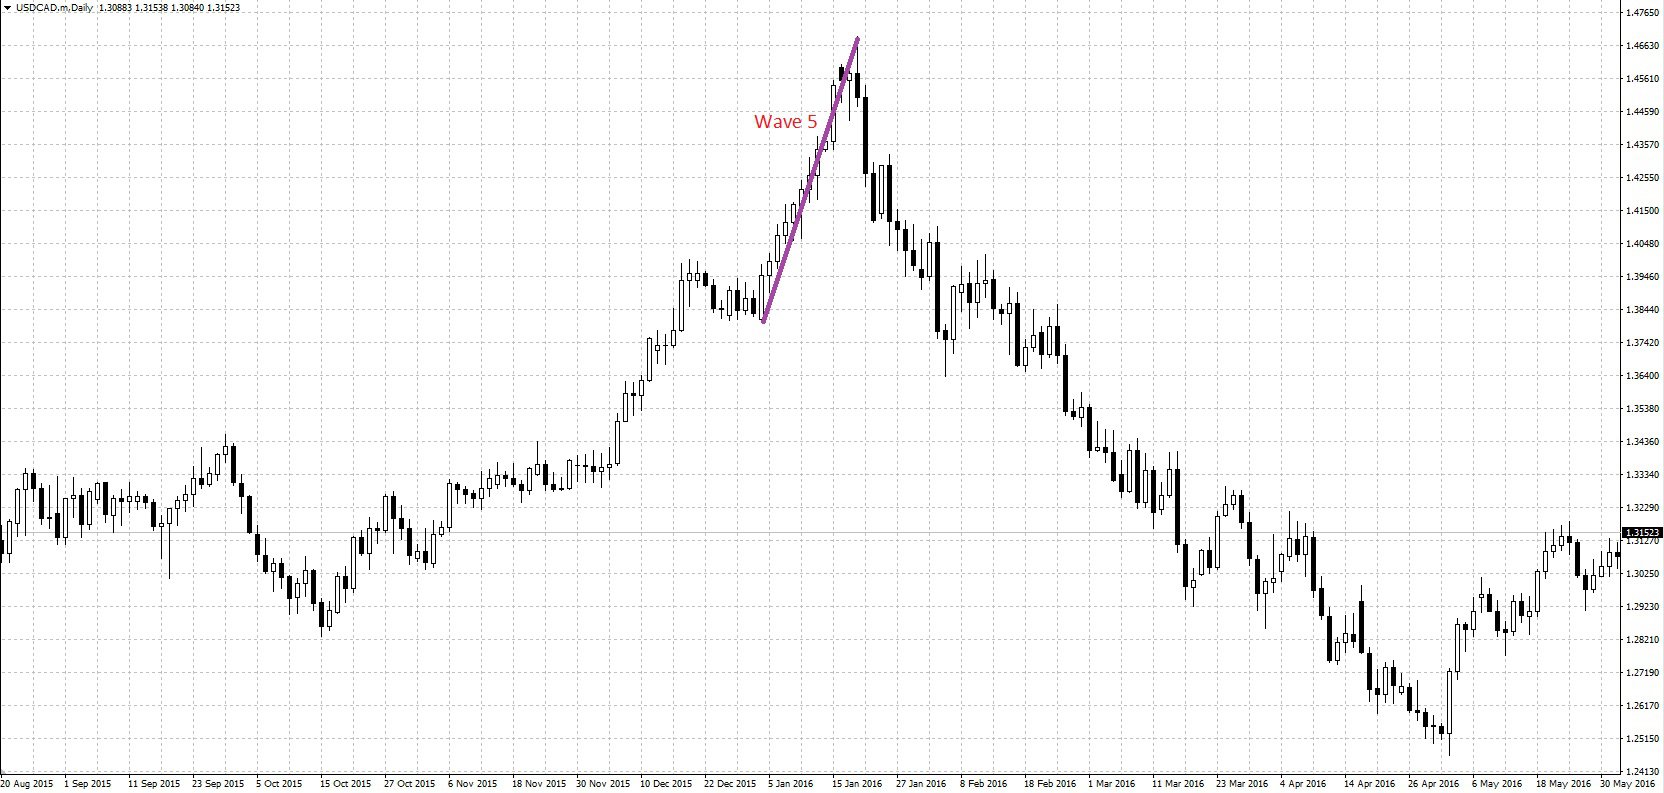
It is characterized by numerous dips as many traders are finally closing out their open long positions. Anyone familiar with the Elliott wave theory will also be gearing up for the eventual corrective trend and opening up short positions. For these reasons, it is usually difficult to tell when the 5th wave will end, and it is not recommended to enter the market at this point. You would be better off waiting for a signal of the end of the trend like the double tops, doji candlestick patterns, or critical pivot points that signal resistance.
(All you need to know about pivot points)
Corrective trend
At this point, the market truly is overbought, the bulls are exhausted and it is time for the markets to recover their original position.
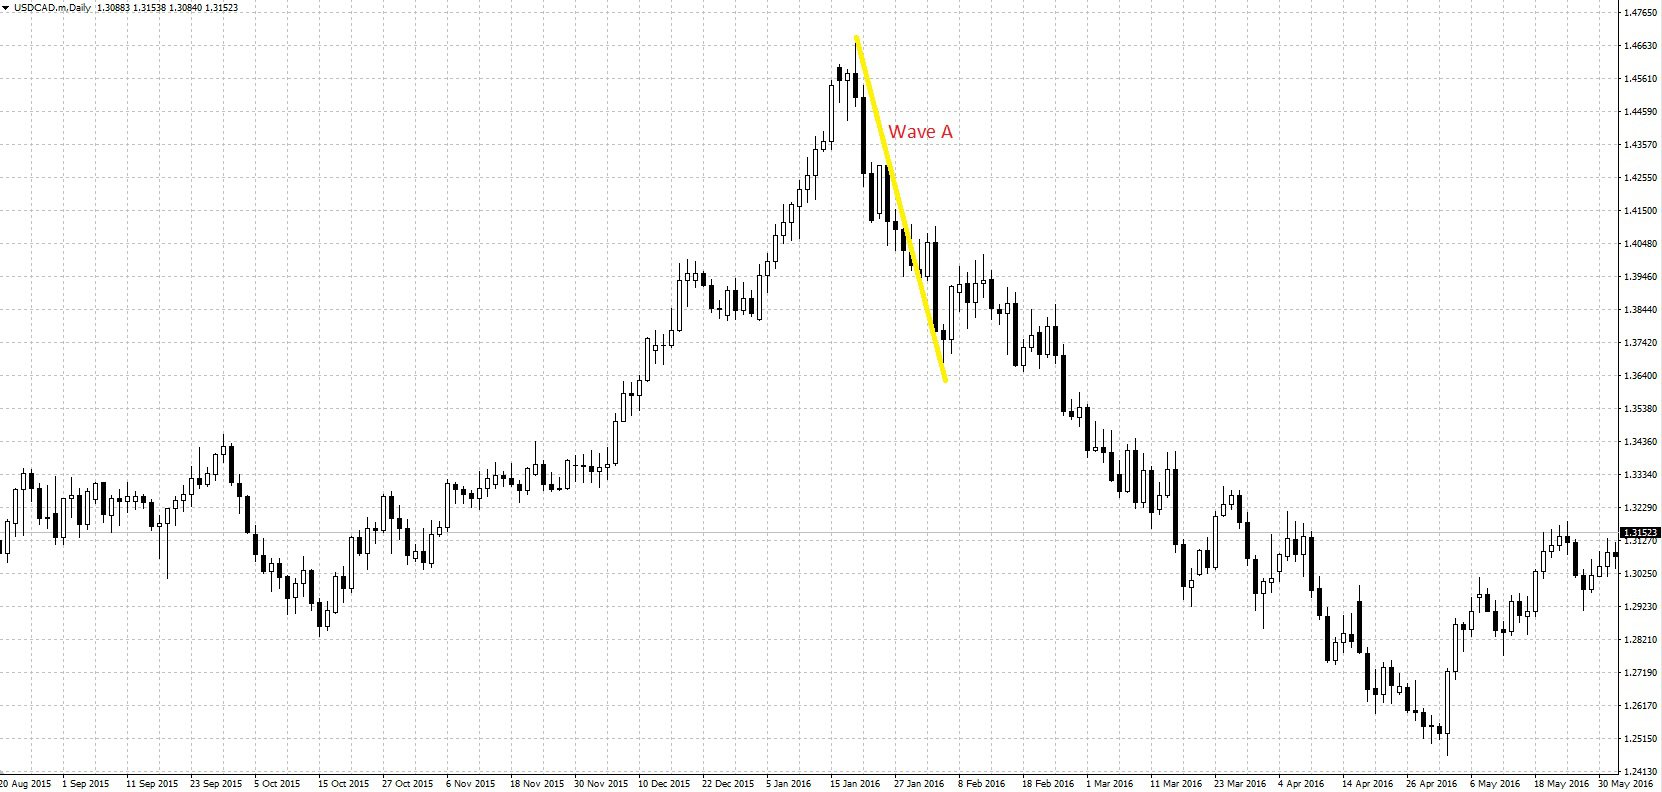
Wave A
Just like in the 1st wave of the dominant trend, market sentiment is usually still incorrect with many analysts believing that the uptrend will continue after a market correction. However, those familiar with the Elliot wave theory will know that the 5 waves are over and the market is bearish. These traders will open short positions, driving the market price lower, but only shortly.
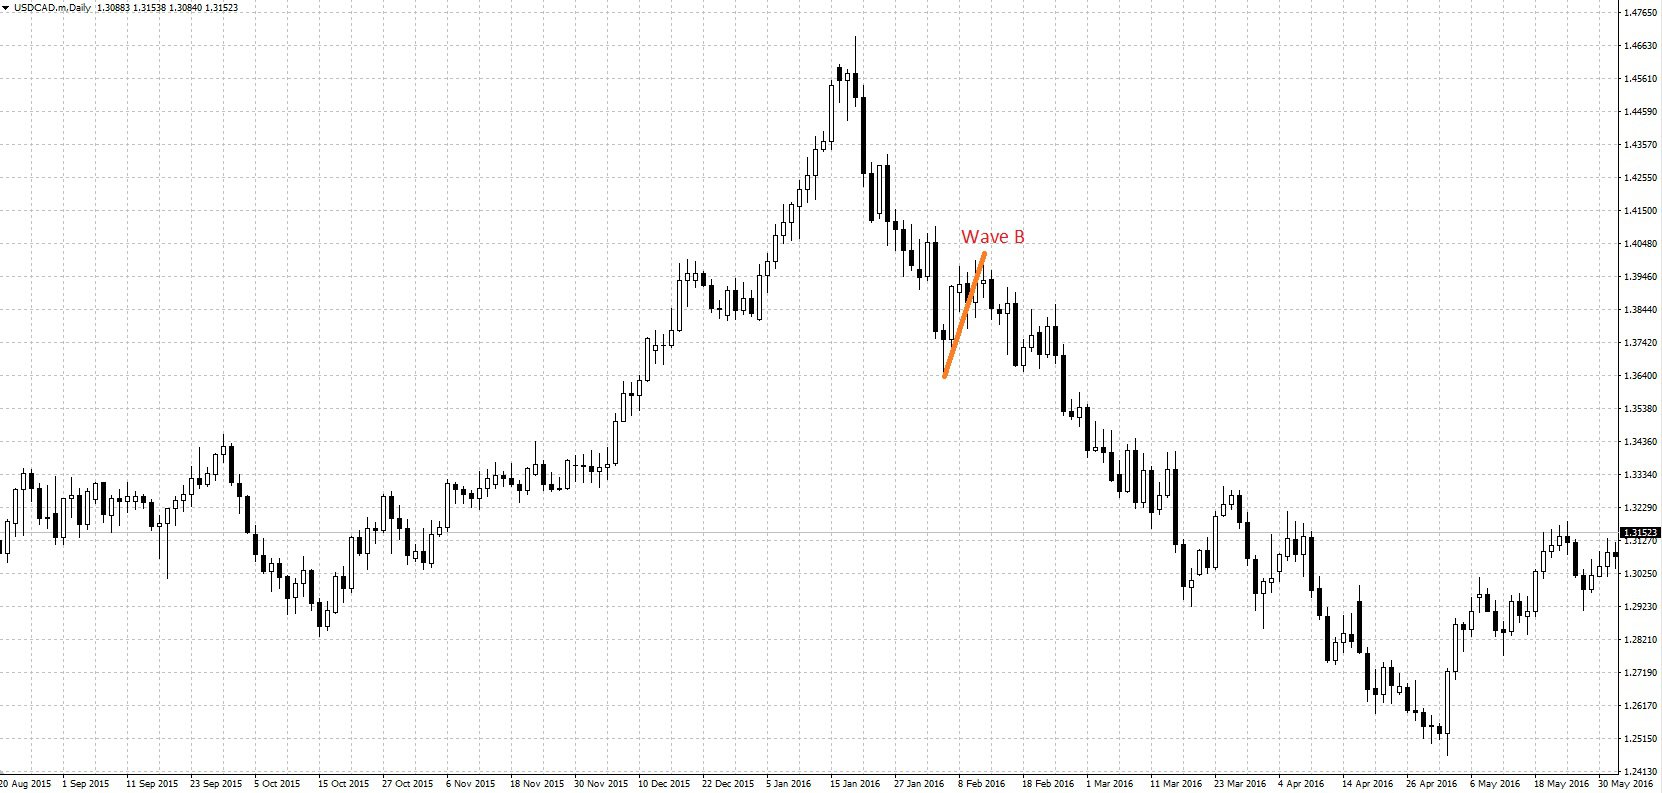
Wave B
An uptrend will begin to form again, but it shouldn’t be long enough to engulf wave A. Just like the 2nd wave in the dominant trend, it usually doesn’t exceed the 68.1% Fibonacci level, but the most important thing is that it doesn’t engulf Wave A. Remember, market sentiment is still fairly bullish and plenty of traders have long positions, so Wave B can be quite long, but not always. It is also characterized by a lot of choppiness due to the battle between bullish and bearish sentiment, and the markets are usually very uncertain.
Wave C
Wave B will eventually stop after the market sentiment turns bearish, which can be signified by candlestick patterns and other technical indicators. Most people will recognize the start of Wave C as a head-and-shoulders pattern with the crest of Wave B being about the same level as that of the 3rd wave in the dominant trend.
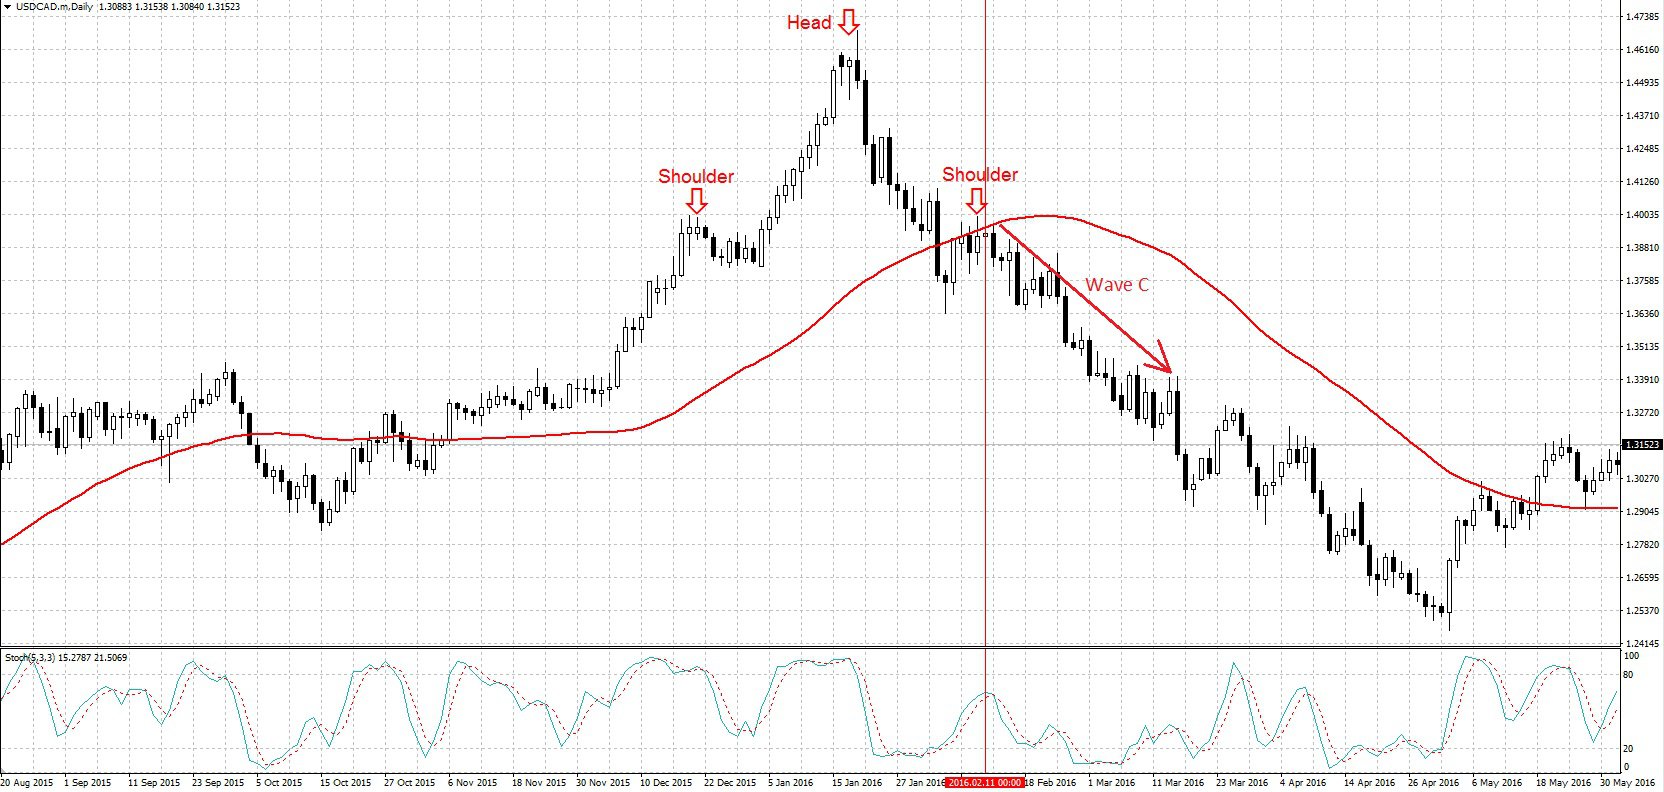
Many traders familiar with technical analysis will catch this and market sentiment will turn bearish, driving the market price down in Wave C. This wave is also very long and signals the end of the Elliott wave, but the end of the downtrend can only be identified using other technical indicators.
(Learn about Forex market sentiment indicators)
What to remember about the Elliott wave theory
Although this is one of the most widely known technical analysis tools known, there has been a lot of criticism. The main one surrounds the fact that it is very difficult to define the Elliott waves themselves, despite the guidelines. A famous quote is that 20 technical analysts working together may not identify the same Elliott wave because the guidelines are not definite. I tend to agree with this statement, but so are many other technical indicators like pivot points which every trader draws independently. To help you identify Elliott waves a bit more easily, here are a few things to keep in mind:
Use longer timeframes
Short timeframes like the 1M, 5M, 15M, and 1H used mostly by scalpers to make quick money may not be as effective with the Elliott wave principle. These shorter timeframes tend to be very choppy due to varying market sentiment from one minute to the next. As a result, it is difficult to identify the Elliott waves required to make use of this principle. Besides, Elliott wave theory is mostly used by the big players in the market like investment banks, hedge funds, and some Forex brokers. They are the ones who drive prices up the dominant trend and down the corrective trend, but they make use of longer timeframes.
The general rule by successful traders is never to go against the tide, so mimic what the big players do, and use longer timeframes. Weekly charts are the most reliable, but daily charts can work as well and sometimes the 4H chart, rarely does lower timeframes work. This may exclude some people who don’t prefer holding on to trades overnight for fear of overnight swaps, but there can be benefits to this. (Find out all about swaps)
Combine the Elliott wave with other indicators
Elliott himself who created this principle advised traders not to make use of it as the end-all, but to use it as a guideline and confirm their suspicions with other technical indicators and fundamental analysis principles. First, this will help you not to get caught in a false Elliott wave formation, but also to determine when to close your position. All the waves will be characterized by false dips or rises, which may tempt you to believe a wave is over, only to realize it was a false dip or rise. Using other indicators will help you identify points at which the trend will reverse so that you can close your position early and maximize profits.
Take note of the trading volume
While the Forex market may be decentralized and trading volume can’t be determined, other markets are traded in exchanges like the New York Stock Exchange (NYSE), Intercontinental Exchange (ICE), and Chicago Board of Trade (CBOT). These include futures, commodities, and options, all of which deal with currency trades.
Learn how to trade on the NYSE.
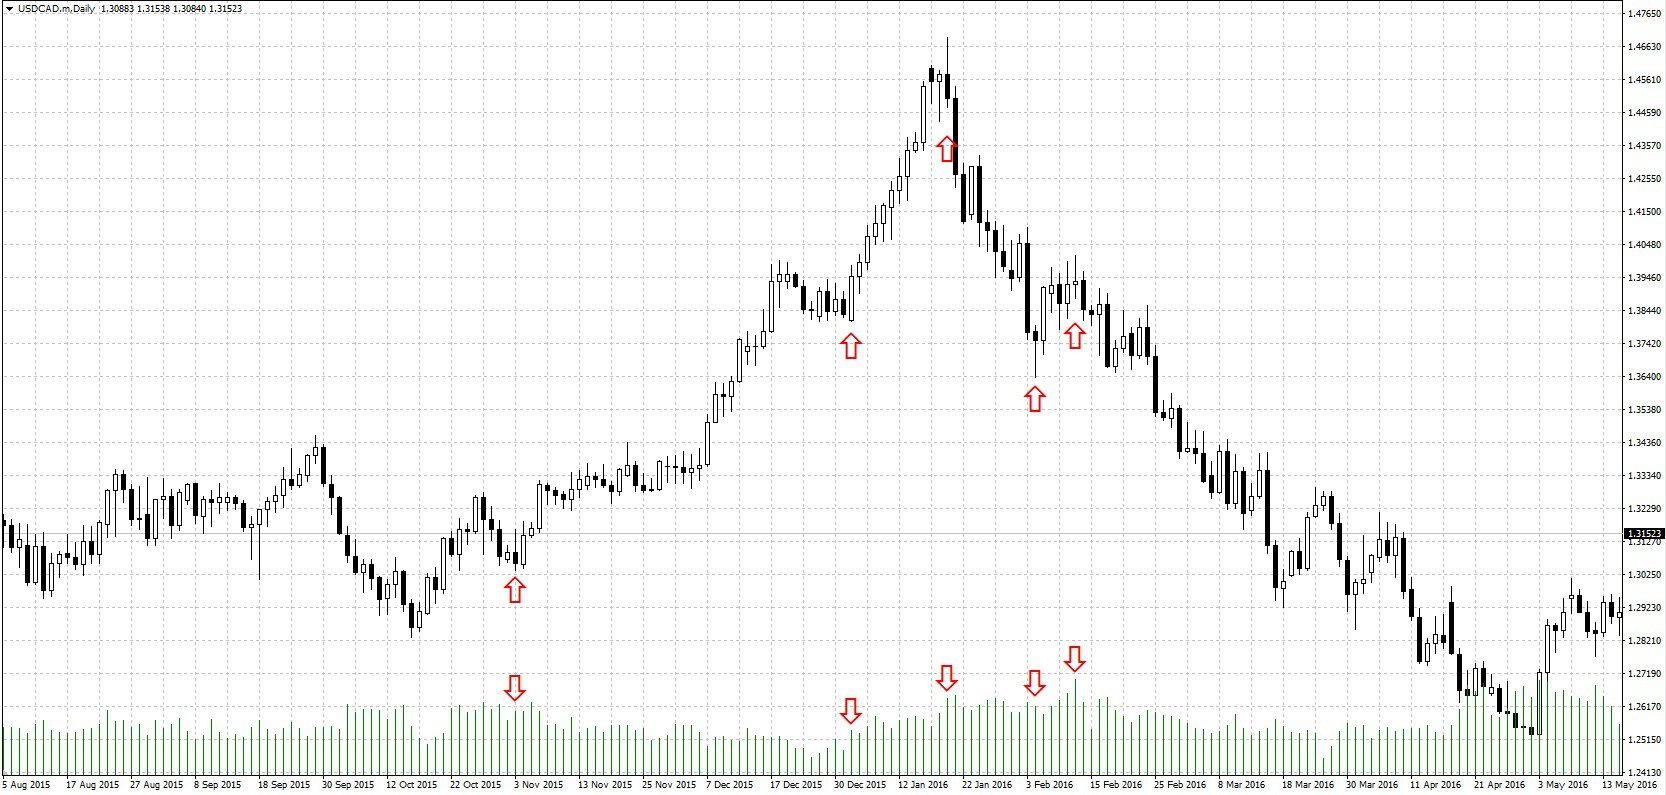
The trading volume of currency pairs from these instruments can show moments when there is a lot of activity around a particular currency pair, which can signal a potential trend reversal. You can see this happen in the above Forex charts, where there was a spike in trading volume every time there was about to be a reversal in the trend. Since most traders will be waiting for the points of reversal, the trading volume will tell you when there is a possibility of reversal. Through the trend, trading volume remains low because no new positions are being opened.
As we’ve mentioned before, the Elliott wave principle is not definite and it requires practice to truly understand all the guidelines and principles. You can find some more first-hand guidelines in this video: