Among other very useful tools in Forex trading are trendlines, which are also very common and, thus, very effective. A trendline is, by definition, just a line drawn to visually represent the trend in the markets. Yet, despite its simplicity, it can be very profitable, especially for swing traders.
What are trendlines?
Like most things in the Forex market, it’s better to just show it to you rather than talk about it too much.
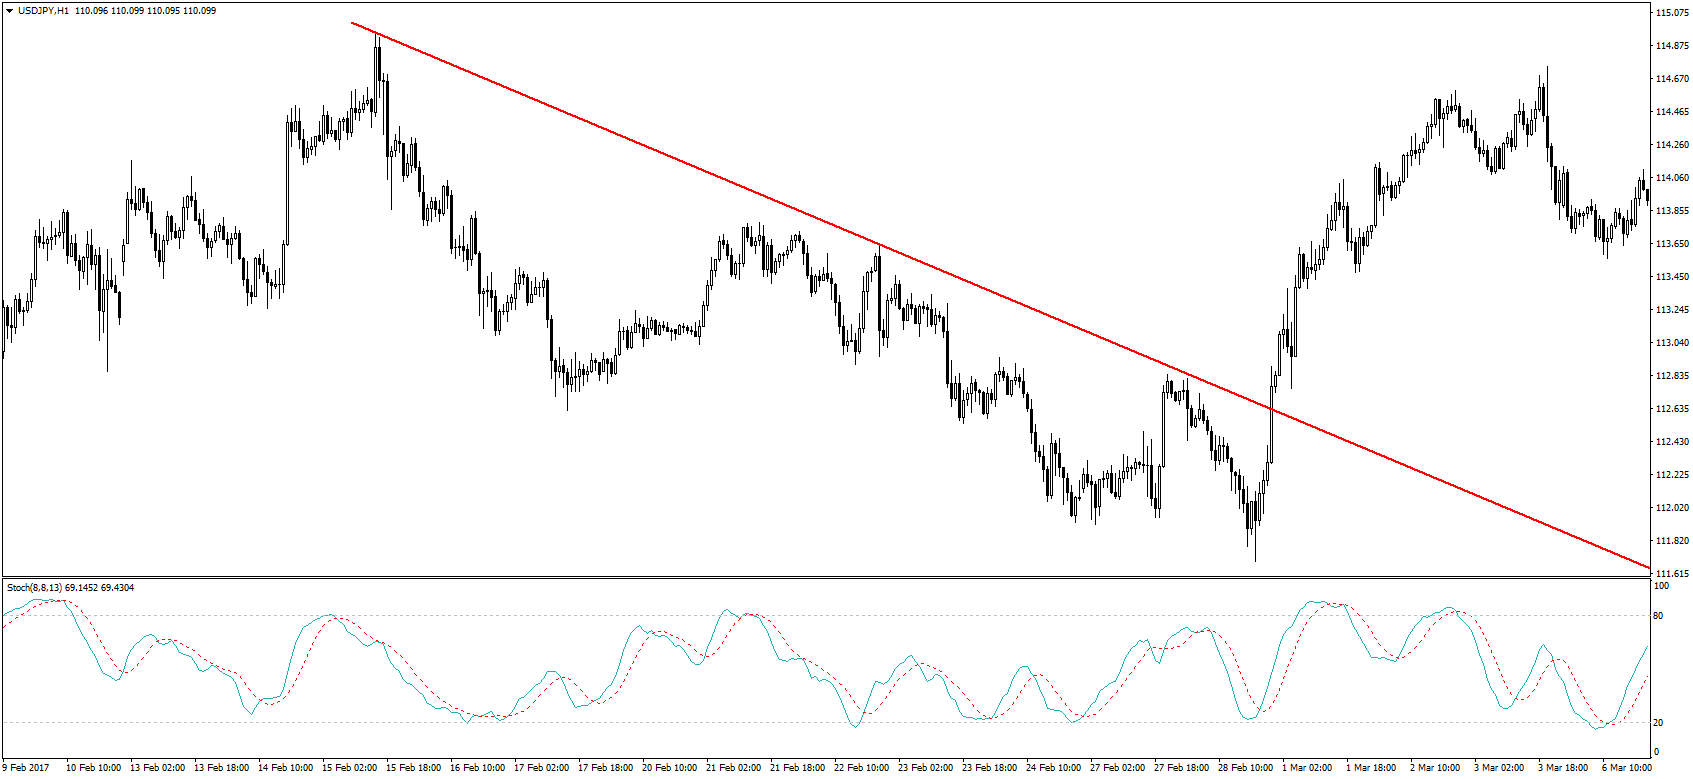
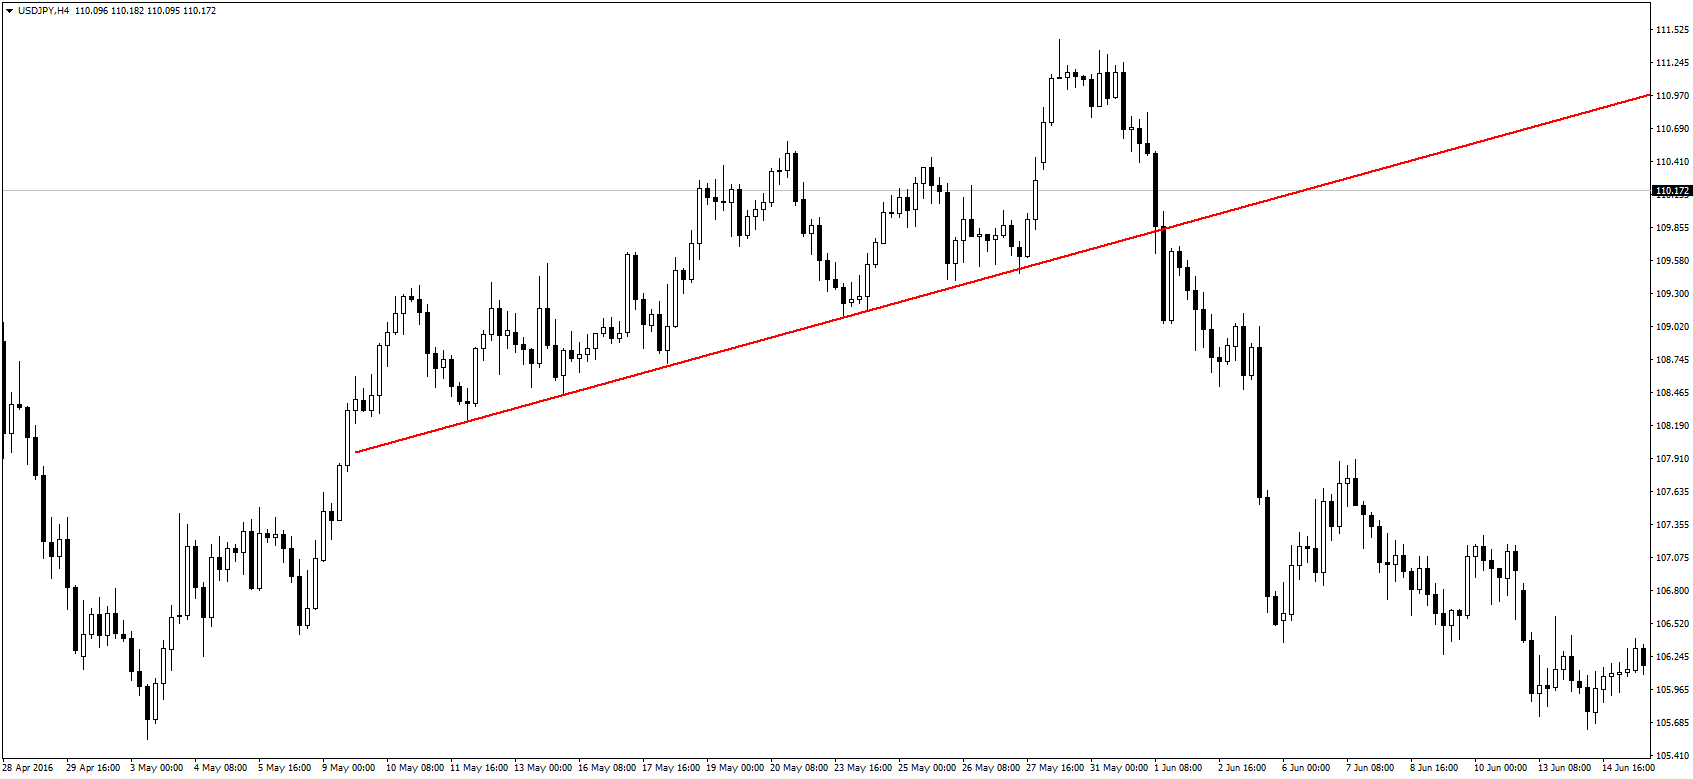
This is a good illustration of a trendline in a downtrend, and you can also draw a trendline in an uptrend – both work just as well. The trendline follows the peaks in the market, and the trendline remains active as long as the markets keep forming a lower high at every peak. In an uptrend, the trendline would follow the troughs in the market, touching every lower high formed, just like this:
Important tips on drawing trendlines
Unlike other technical indicators which only need you to drag them onto the real-time Forex charts, trendlines need you to put in some work. Don’t worry, it’s not too much work, and the reward will be worth the effort. Anyone can draw trendlines on their own, but these tips will help you make your trendlines more effective.
Make sure there is a trend
As mentioned earlier, a trendline connects troughs or peaks, but some traders make the mistake of forcing a trend. Look at this example:
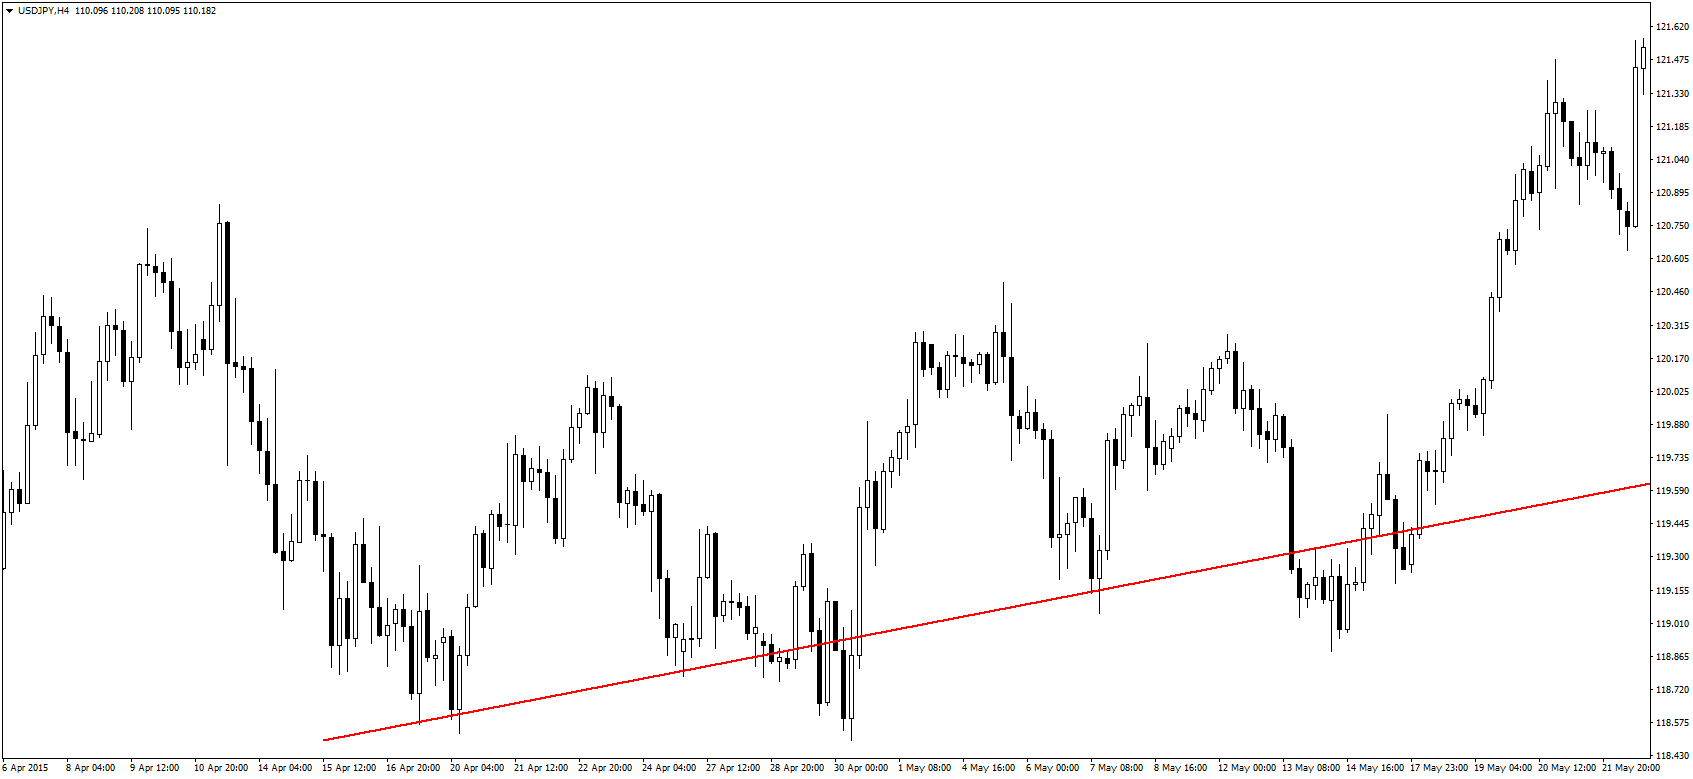
Here is someone just trying to force a trendline even when there isn’t one. A horizontal support level would have been more appropriate. Remember, a trendline must connect at least two consecutive major troughs or peaks. In the above example, the trend was broken when the second trough closed below the trendline, so even if the trendline connected the first and third troughs, it wasn’t a real trendline.
To make sure there is a trend, connect at least two peaks in a downtrend or two troughs in an uptrend. The more points, the better, but there have to be two points. When you do get a trendline that has numerous points connected to it, that makes the trend even stronger and the trendline more relevant. A good example of a strong trendline is one such as this:
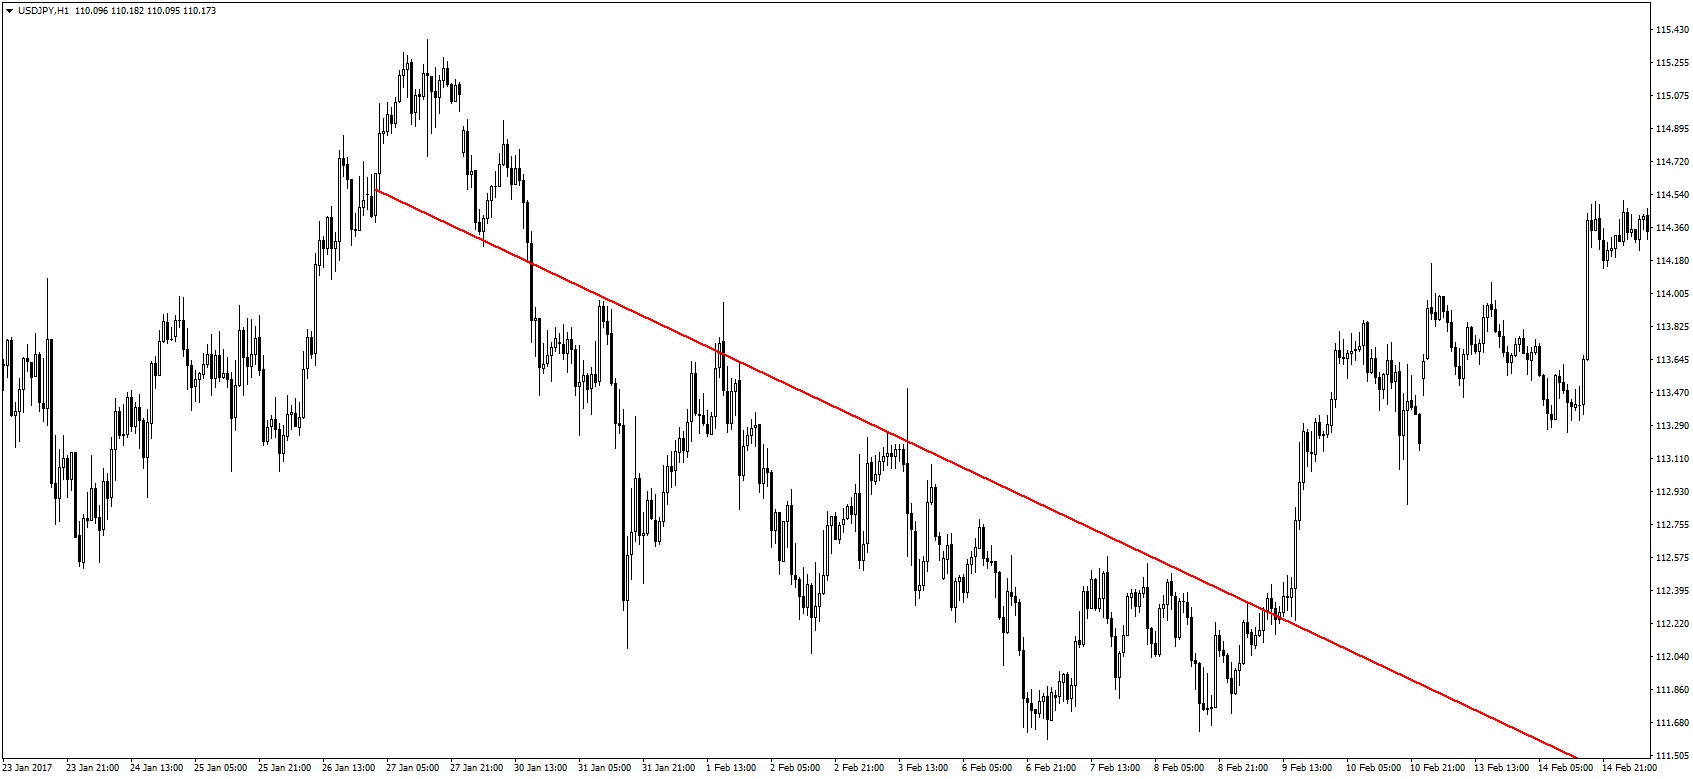
In this example, there have been many peaks bouncing off the trendline, reinforcing its strength and making it even more powerful.
Do not expect the line to be perfect all the time
Sometimes, you get a perfect trend that the trendline just perfectly fits into, but it doesn’t always happen. There are always many different factors influencing the direction of the markets, and these can sometimes lead to a seemingly imperfect trendline.
Looking at the above image; you can see how the prices frequently crossed the trendline shortly before resuming the downtrend, this is what I’m talking about. It’s more important to look at the candlestick pattern forming around the trendline than just the candle itself. In the same image, we see how the markets formed a bearish engulfing candle and an inverted hammer around where the trendline passed. These are all signs of bearish market sentiment, which echoed the trendline’s sentiment.
So, do not expect to draw the perfect trendline every time, but be aware of other indicators of market sentiment.
Make a channel
A channel is formed by two parallel trendlines, indicating an area within which market prices fluctuate during a trend. A channel is formed because markets don’t move in a perfect trajectory but there is always a struggle between the bulls and bears as both sides try to control the markets.
To make a channel, you can either draw two trendlines manually or draw an equidistant channel using the tool provided in most Forex trading platforms. The key is to make sure the lines are parallel, which is why the equidistant channel tool can be helpful. The best Forex brokers always provide this tool in the trading software. With a bit of practice, though, you will be able to draw a perfect channel like this one here:
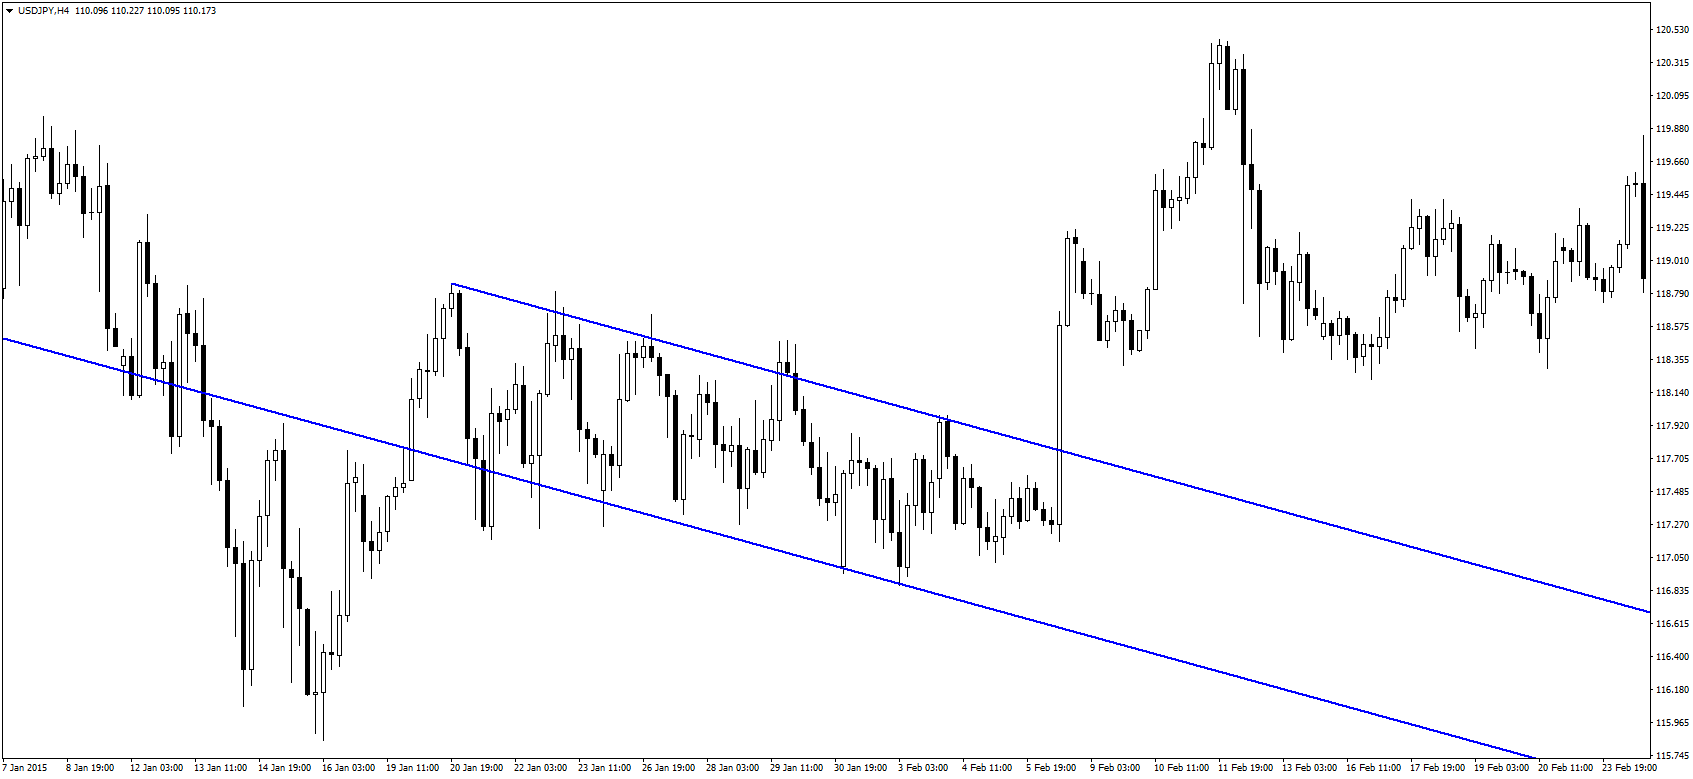
Beautiful, isn’t it? Note how the prices stay within the channel for almost two weeks, and now imagine all the trading opportunities that could have been taken…
How to use these trendlines in trading
Now to the actual point of drawing trendlines, placing the trades, and making a profit from it. Once you know how to draw the trendlines, you should be able to see how you can profit from the tool, but here are the steps anyway.
When to enter a trade
There are two ways to use trendlines to place orders, you’re either staying in the trend for the long haul, or you want to make numerous smaller trades. Let’s start with the swing trader who prefers to follow the entire trend.
This kind of trader would enter the trend as soon as the trendline confirmed the presence of a trend to either the downside or upside. Remember that to form the trendline, you would need at least two peaks or troughs depending on the trend direction. Here’s an example of a downward trendline:
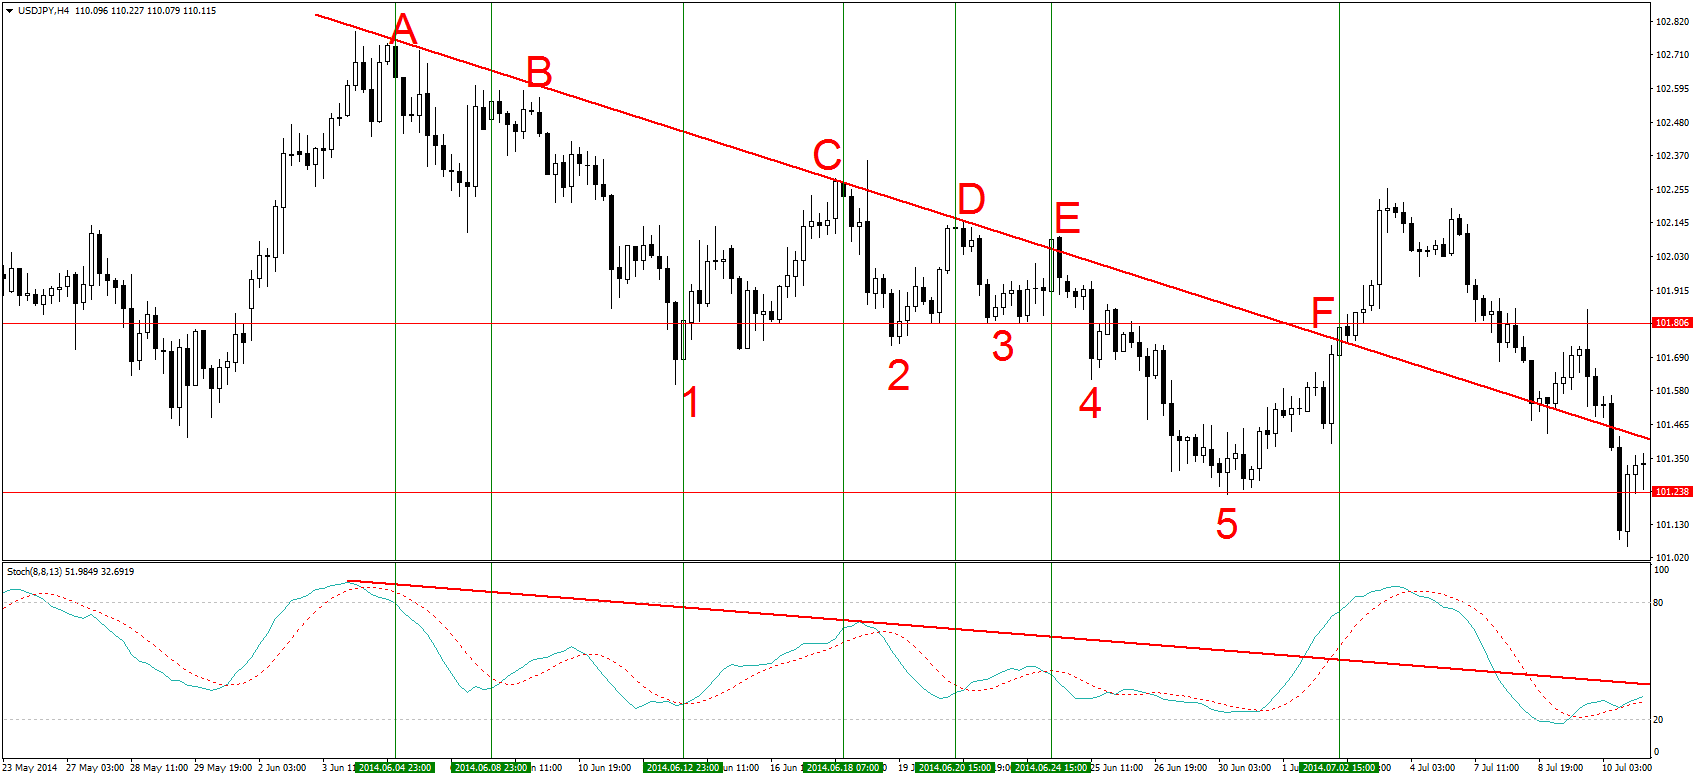
The trendline would be confirmed after points A and B were connected, showing a downward trend. Point B would have been the ideal time to enter a short position, or sometime after the downtrend resumed. It comes down to whether you’re an aggressive or conservative trader. For an aggressive trader, a position at point B would have been justified because the trendline was already active, but a conservative trader would have preferred to see the downtrend resume. Either way, you enter a trade around the second point touching the trendline.
On the other hand, is a scalper or short-term trader who doesn’t want to hold on to a trade for weeks. In their case, point B would still be the ideal time to enter the first trade, but they would close their positions sooner than the swing traders. Let’s see how that would work.
Managing and closing the trade
Let’s start with the scalper who’s short at point B. There are two options for a scalper: Make a channel, see other technical analysis tools (Best technical indicators and how to use them)
Unfortunately, there isn’t a channel formation here as you can see, but they can still use other useful tools. In the example, I’ve used the stochastic oscillator and pivot points. A scalper would want to exit their position as soon as the markets were close to a support level and when the oscillator moved into oversold territory. In the example, this would be Point 1 where the stochastic is low and prices have just hit a support level.
The same scalper could then place more short trades at points C, D, and E whenever the prices touched the descending trendline. The final trade would have been at Point E when markets broke below the support level and dropped to the next support level. These would have been four very profitable trades just with the use of trendlines.
However, a long-term trader would need to use a different set of tools and trading concepts. After entering a short position at Point B, the trader would have to take note of other signs of an ending downtrend. When prices started to go up after Point 1, the trader would wait and see what happens when prices reach the trendline. Of course, this would mean watching as all the accumulated pips were eaten up by the uptrend, but this is the life of a swing trader. (Long-term vs. short-term trading)
At Point C, there is a doji candle formed, showing that the buying momentum was running out and that bears were taking back control. The trader would also draw a trendline on the stochastic oscillator to check for divergence (5 Secrets of Divergence in Forex). A divergence would have indicated a trend reversal, but since it wasn’t there, it showed bearish market sentiment. This would tell the trader to hang on to their short position, otherwise, they should have closed the trade as soon as prices broke above the trendline.
After the markets test the trendline again at points D and E, another concept would be realized, a descending triangle pattern (Triangles Forex trading strategy). As market prices moved toward the apex of the triangle, there was a strong sign of a powerful downward push, which occurred toward Point 5 where there is a support level.
To close their position, the trader would watch out for a break in the trendlines, both in the main window and the indicators window. Soon after an uptrend began at Point 5, the stochastic indicator broke through the trendline in the indicator window, which was the first sign of a change in trend. An aggressive trader would have closed their position when this occurred, but a conservative trader would have waited for the trendline to be broken, which would be at Point F.
A bit more information on trendlines
Regardless of the strategy implemented, you can see how trendlines were used to determine the direction of the markets and place a trade. The same principles would work in an uptrend too, just by inversing the lessons learned.
For a visual guide to drawing trend lines, watch a video teaching you about mastering trend lines:

 IndiaUS