 Alpari
 XM
XMWe have seen before how one can use the Fibonacci retracement tool in their trading, but that was just as a tool rather than an actual trading strategy (Using the Fibonacci retracement). The same principles of the Fibonacci retracement can be pushed further to generate a valid trading strategy, and this is through the use of harmonics.
Since the Fibonacci numbers and the golden ratios occur in nature, they have been used by gamblers to predict how dice will fall and where the ball in roulette will land. The principle behind it is that nothing occurs by pure chance and that there is a way to predict the future – to some extent. With harmonics, this same principle is being applied, this time to determine how and when market forces affect market prices. To begin, let’s look at how harmonics can be identified in chart patterns.
How to spot harmonic chart patterns
There are various forms of harmonic patterns used by traders, but these are the four main ones:
The Gartley
The Gartley is the most basic and most often used harmonic chart pattern. (What is Gartley and how to trade with it)
It is identified by an M-shaped pattern on the Forex charts online. The M-shaped pattern is that of a bullish Gartley harmonic, but it can also identify a bearish market with a W-shaped pattern. Ideally, you should be looking for something like this:
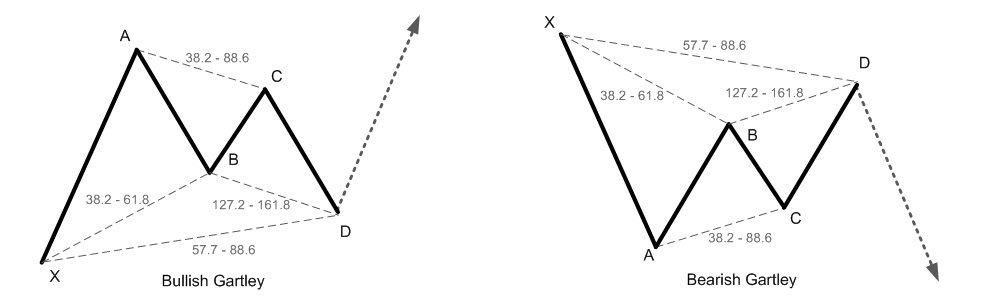
From the image above, you can see the M and W shapes formed by the Gartley harmonic and the trend that follows thereafter. 4 major drives form the Gartley, starting from X to A, B, C, and D. The trend between X and A represents the preceding dominant trend, either bullish or bearish. This is followed by a slight reversal with the formation of trend AB, which subsequently turns to resume the dominant trend at BC before being reversed once again at CD. The final trend is the goal of this strategy, and traders can get in on this.
You will also notice that each of the trends is marketed by Fibonacci numbers, and that’s because the Gartley, just like all other harmonic patterns, is guided by the Fibonacci numbers. The general rules for an accurate Gartley pattern require that the individual trends fulfill these conditions:
- the AB trend is the 61.8% retracement of the preceding XA
- BC should either end at the 38.2% or 88.6% Fibonacci retracement of AB
- CD can either be the 127.2% or 161.8% Fibonacci retracement of AB. The former if BC reached 38.2% and the latter if BC reached as far as the 88.6% retracement level
- The CD should also be a 78.6% retracement of XA
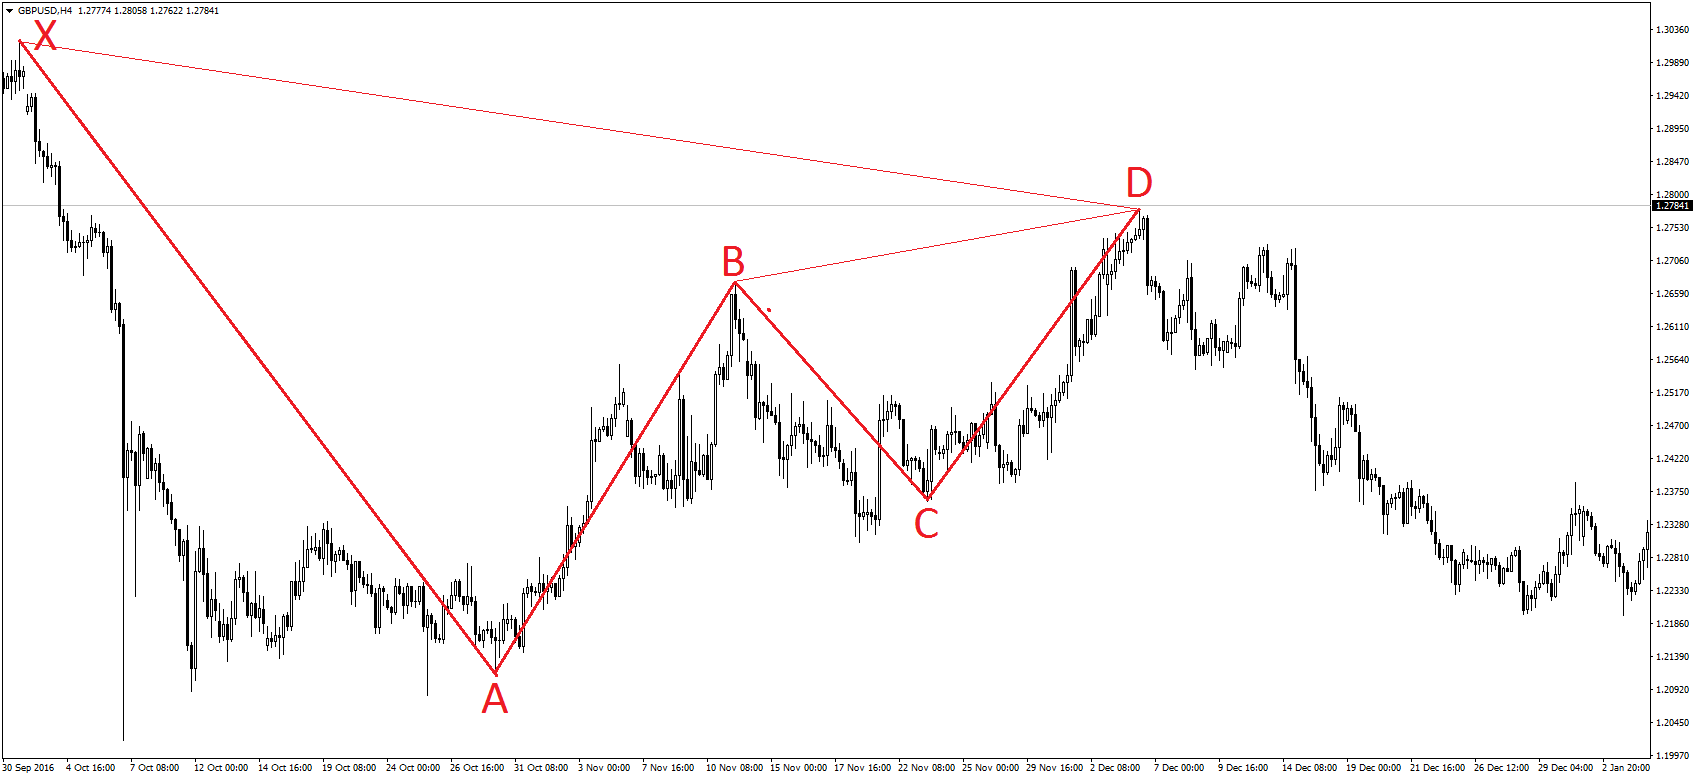
To show all these values on an actual chart, here are examples detailing each of the stages:
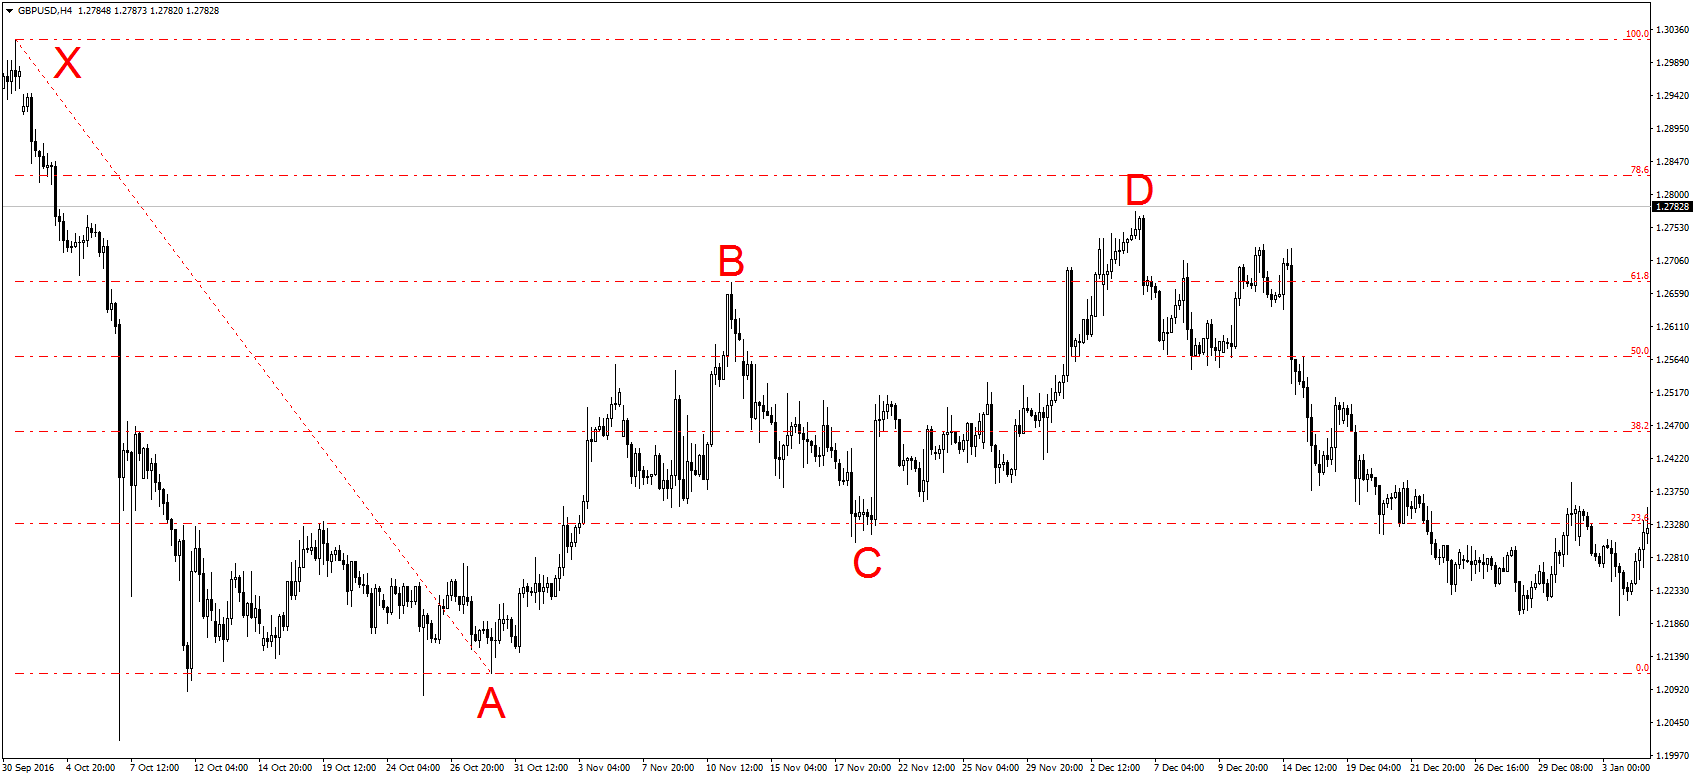
Move AB reached precisely the 61.8% retracement of move XA while CD is around the 78.6% retracement.
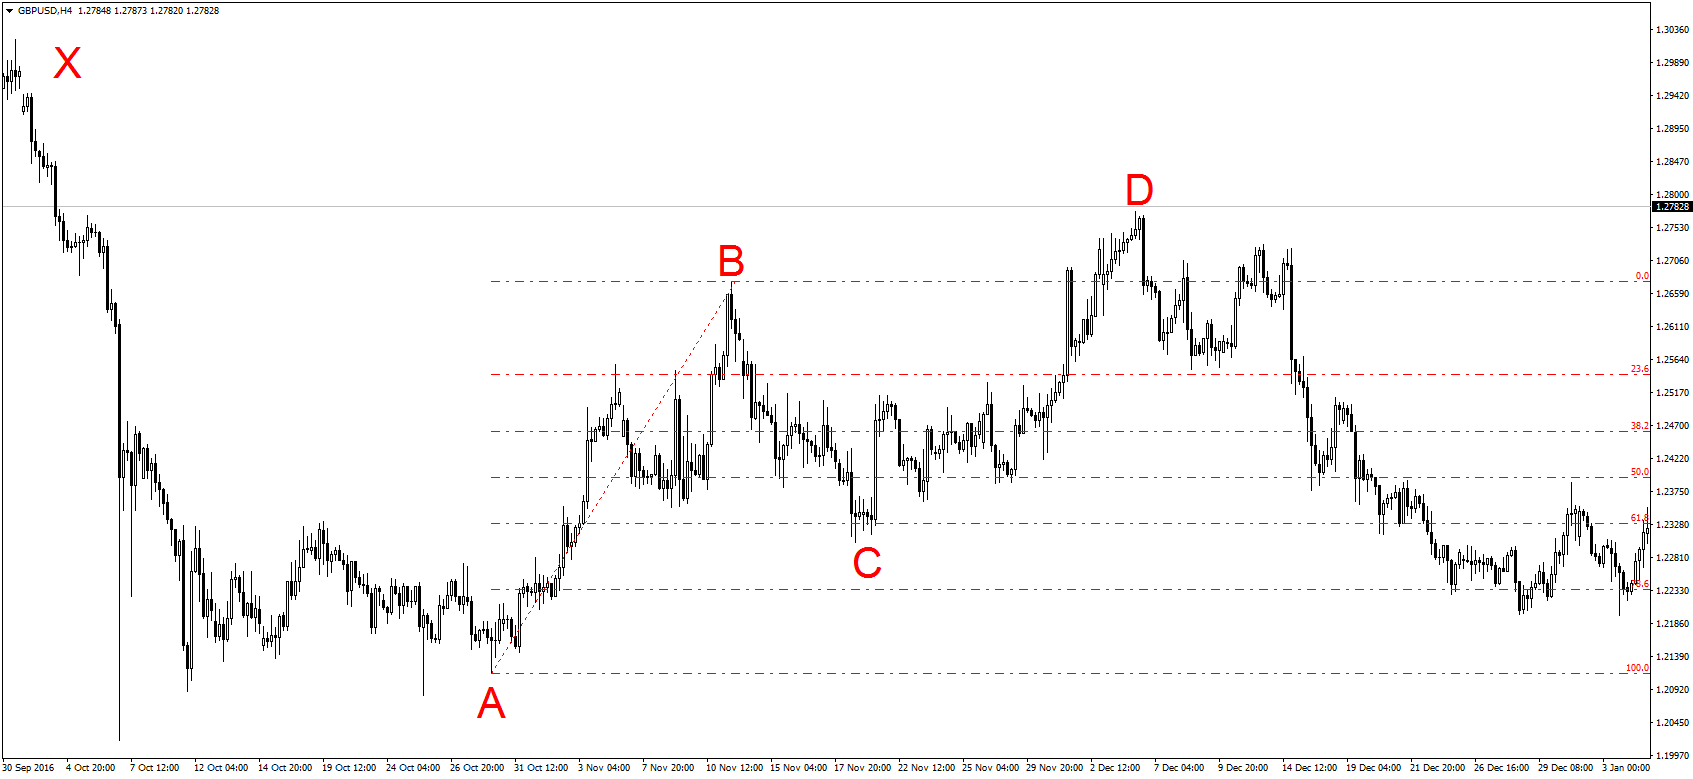
Move BC is precisely at the 61.8% retracement of AB
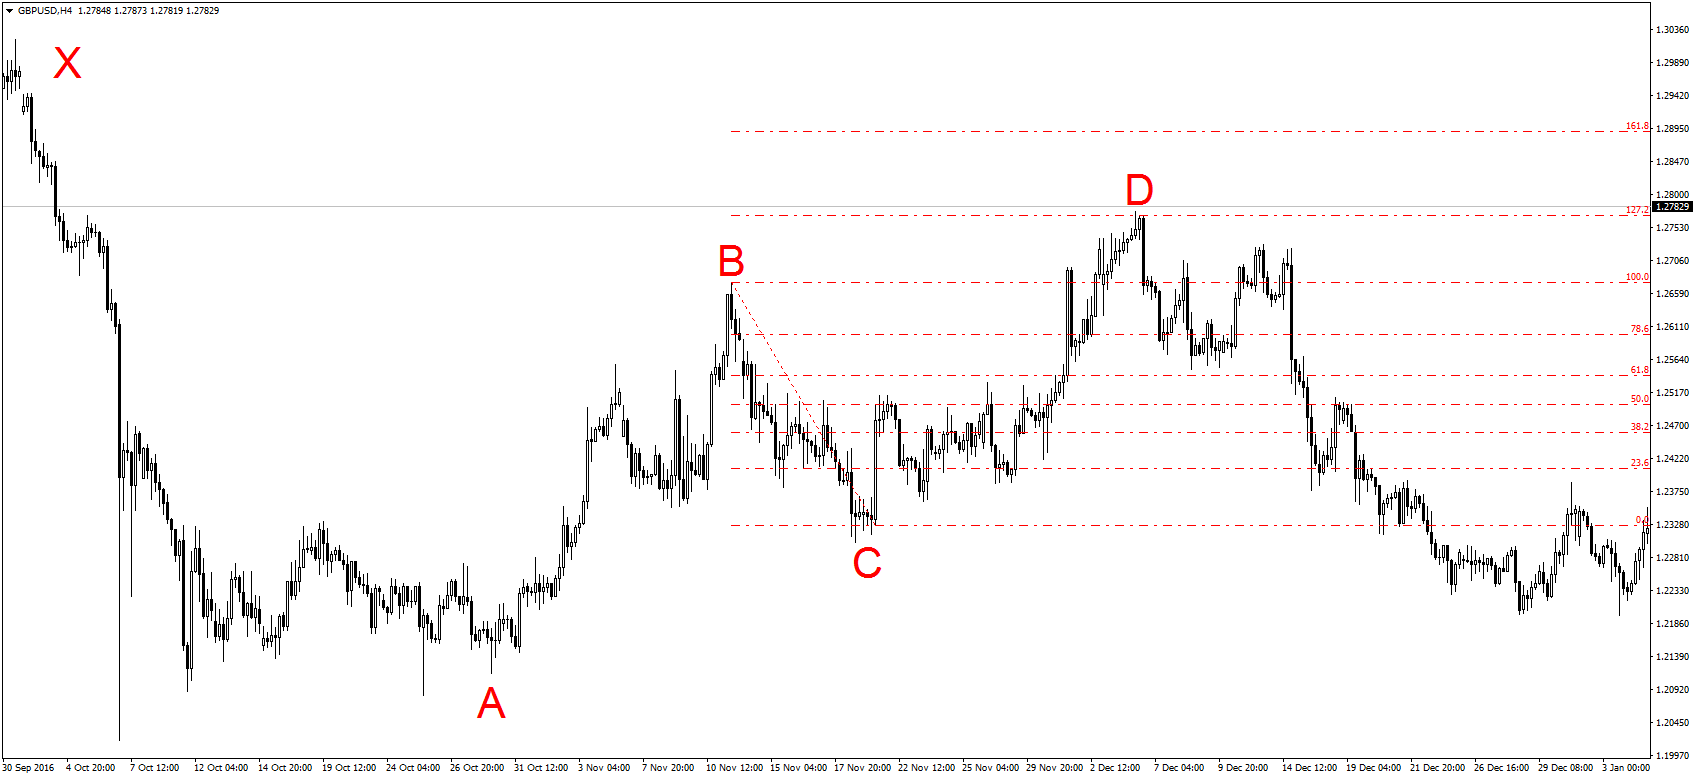
Finally, CD reached 127.2% retracement because move BC was only at 61.8% retracement.
When you see this pattern, it shows you that the preceding trend will continue because their market sentiment is still the same. In the case of a bearish market like the one in the images above, the bulls got into the markets at point A, trying to push prices higher. After a bit of correction between B and C, the bulls again pushed the markets higher to point D. However, there weren’t enough bulls in the market to keep the pressure going, which is why the initial downtrend between X and A resumed. (How to earn on corrective waves)
Another harmonic chart pattern that works, in the same way, is the bat pattern.
The bat
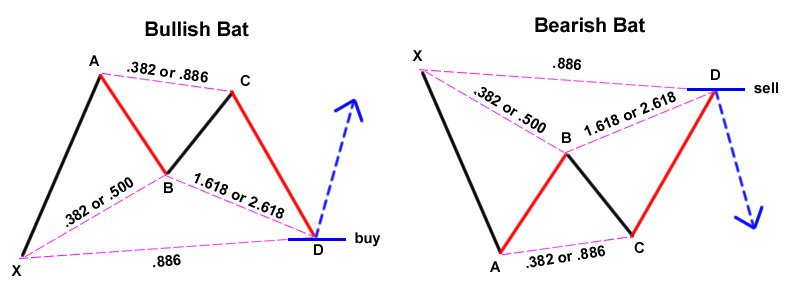
This one looks a lot like the Gartley harmonic pattern, but it differs in the conditions required to create the harmonic. For the bat harmonic, the following conditions must be met:
- After moving XA, the trend AB should get either 38.2% or 50% retracement
- Trend BC can be either 38.2% or 88.6% of a retracement for trend AB
- trend CD can be either 161.8% or 261.8% the retracement of BC. The former occurs when BC was at the 38.2% retracement and the latter if BC reached the 88.6 retracements of AB
- The final trend CD should always be the 88.6% retracement of the initial trend XA
The bat pattern will thus look like this:
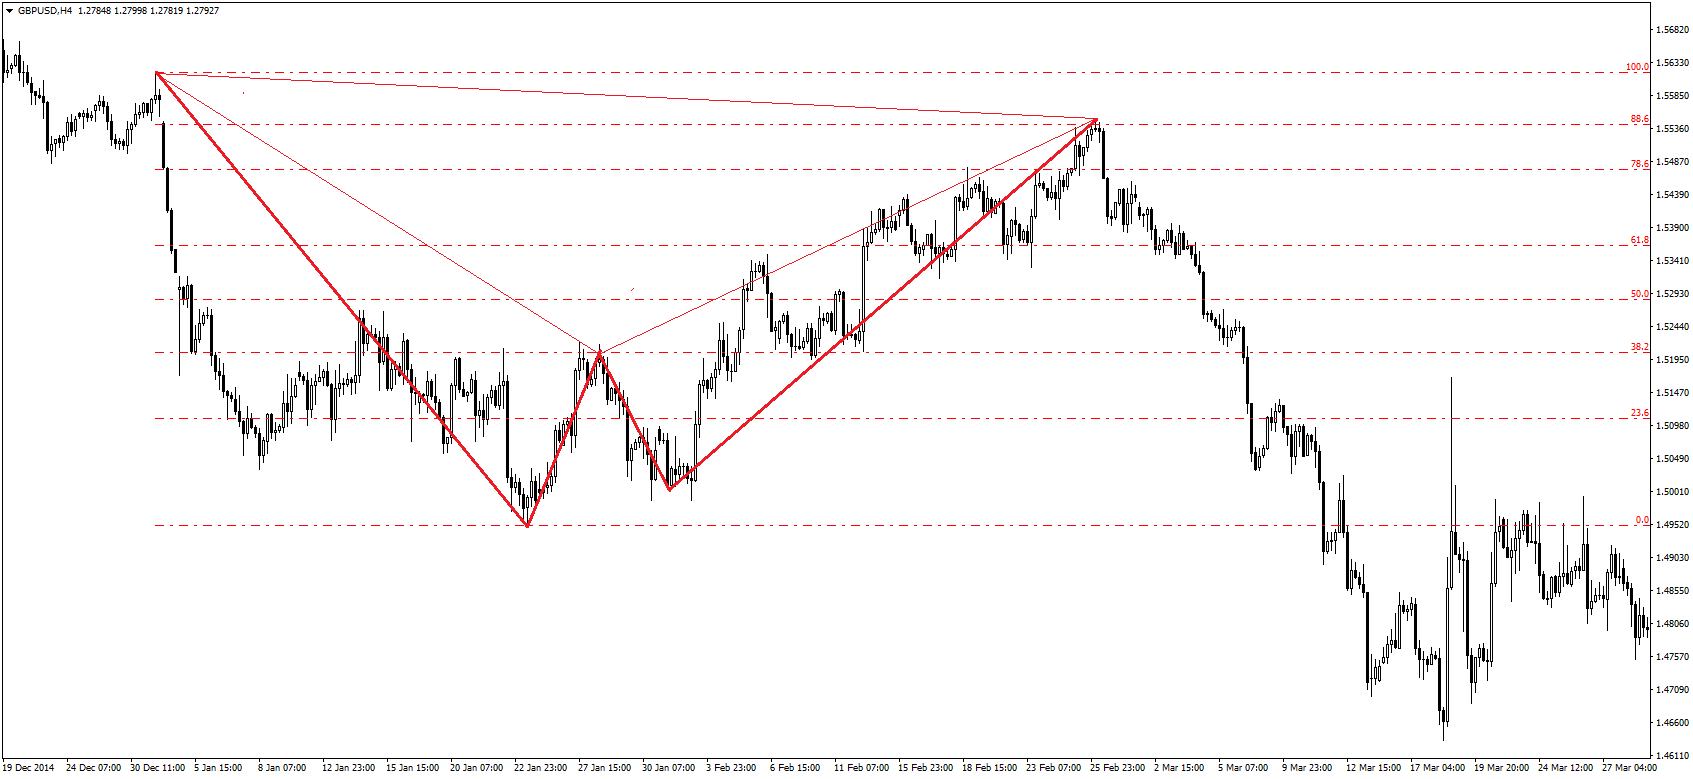
On an actual chart, this would be the general look:
The butterfly
Unlike the bat and Gartley harmonics, the butterfly works when the initial trend reverses for a while. Nevertheless, the overall pattern remains similar to all other harmonic chart patterns, except the Fibonacci retracement levels.
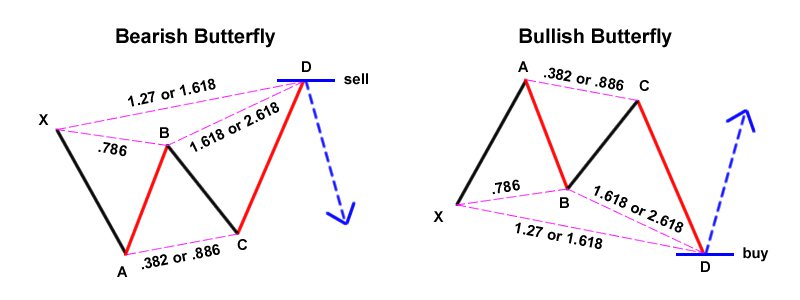
For the butterfly pattern, these rules must be fulfilled:
- After move XA is complete, trend AB is a reversal up to the 78.6% retracement level
- move BC then reverses AB up to either the 38.2% or 88.6% retracement level
- if BC managed to pull back AB up to the 38.2% level, then CD should be 161.8% retracement. If BC managed to pull back to the 88.6% retracement, then CD should be a 261.8% retracement
- Compared to the initial trend XA, CD should reach either the 127.2% or 161.8% retracement level
On a chart, the butterfly harmonic looks like this:
The crab
This is perhaps the most powerful harmonic of all because it represents some very sharp price movements in the markets. Typically, the crab formation looks like this:
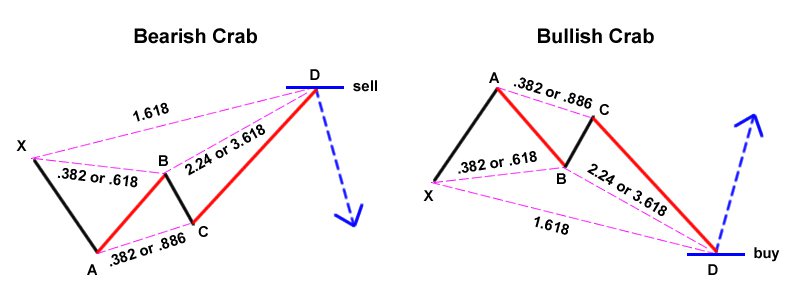
For the crab harmonic to be realized, these are the required rules:
- following the trend XA, a reversal AB should reach the 38.2% or 61.8% retracement level
- BC then follows, reaching either the 38.2% or 88.6% retracement level of AB
- trend CD is a reversal on BC, leading up to the 224% retracement if BC reaches 38.2% and leading up to 361.8% if BC reaches 88.6% retracement
- Overall, the final trend CD should be a 161.8% retracement of the initial trend XA
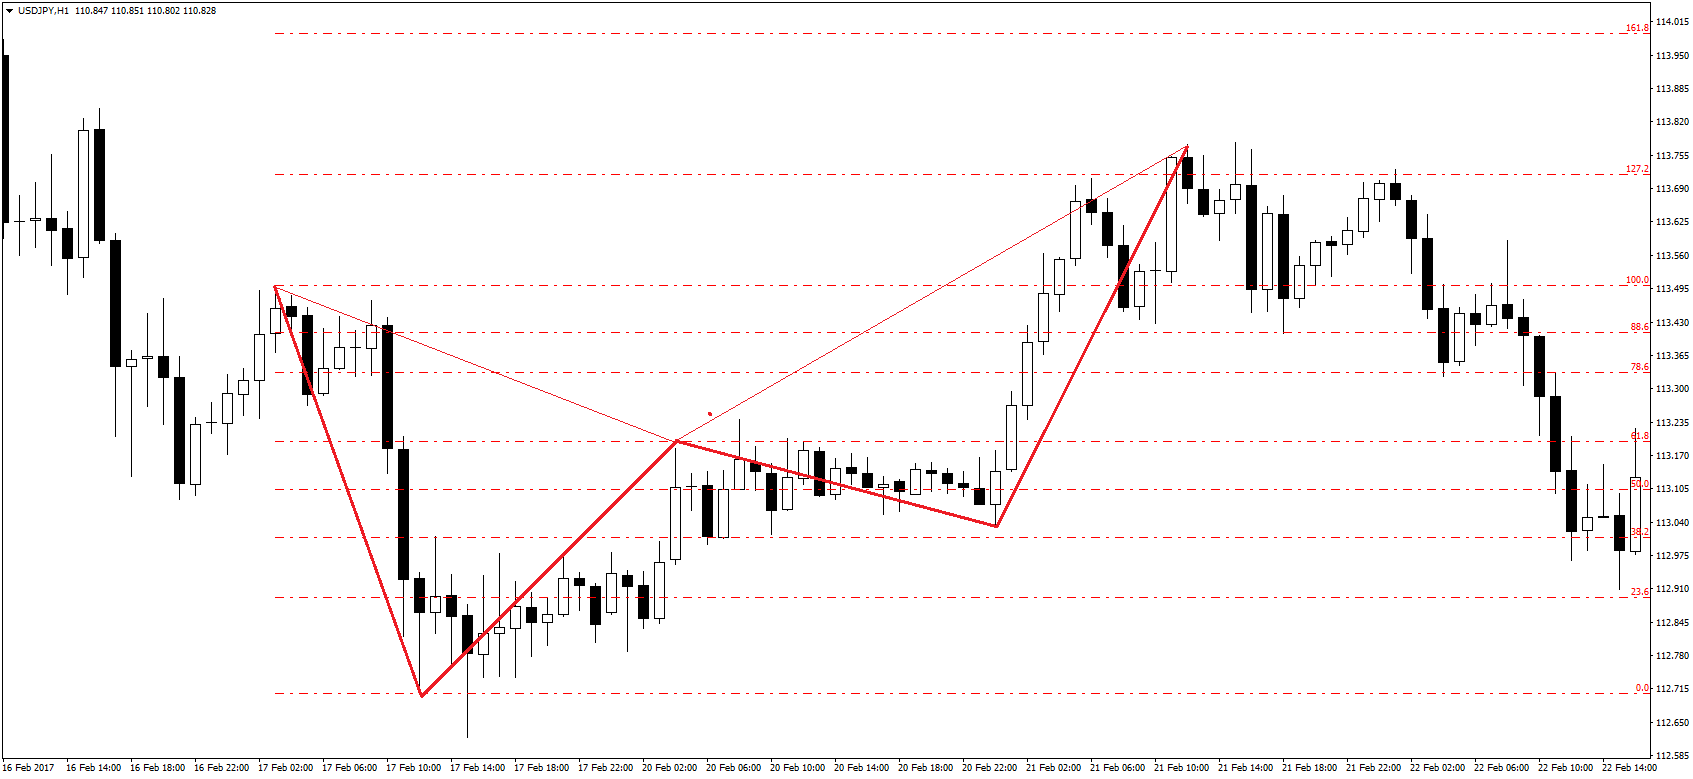
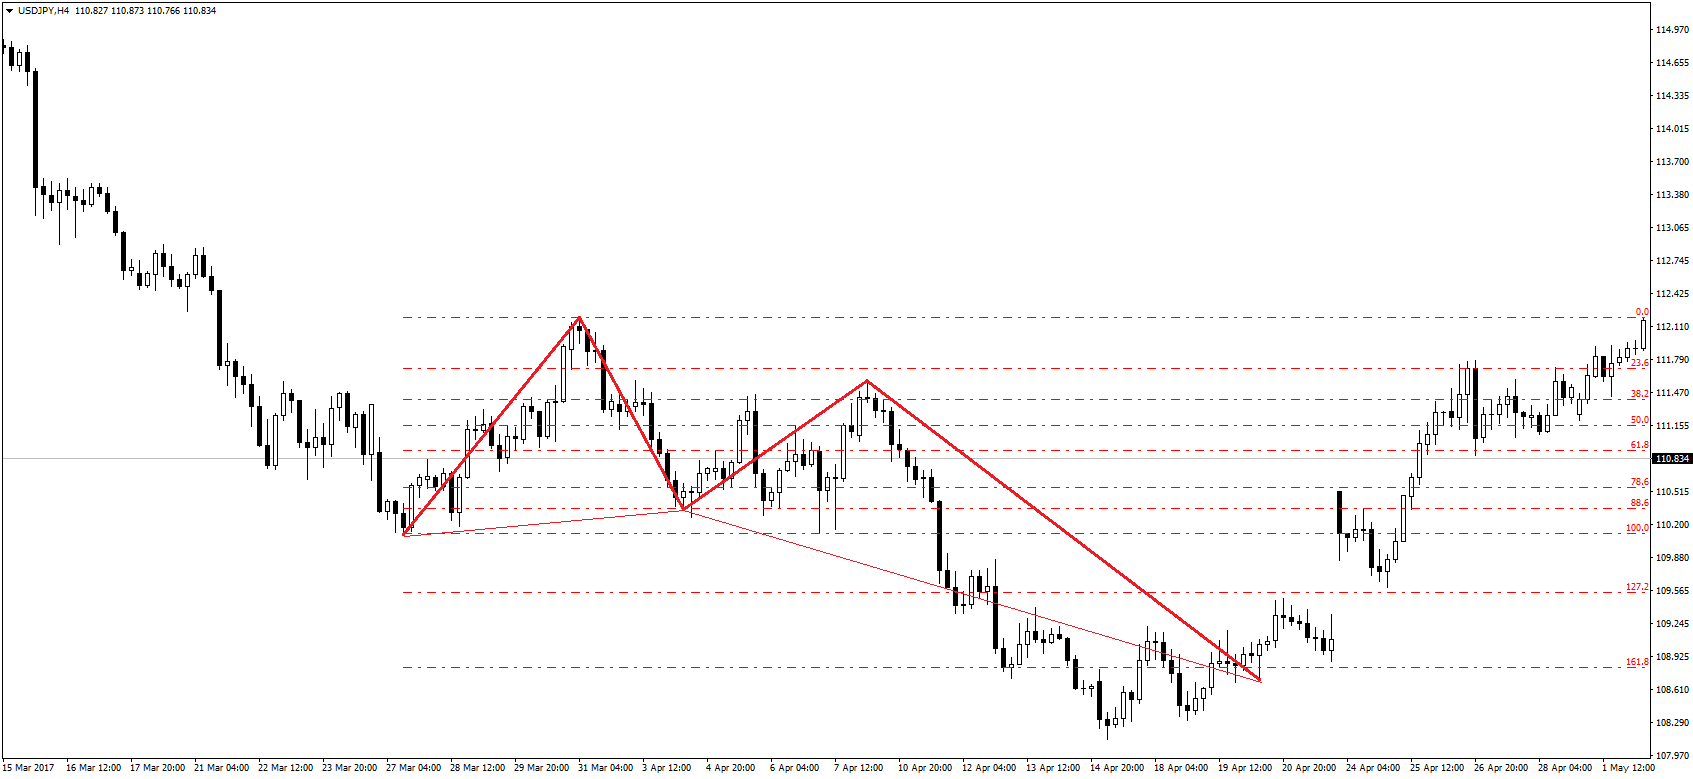
On an actual trading chart, this harmonic pattern could be seen as follows:
Find other trading strategies in the links below: