 Alpari
 XM
XMCorrective waves simply refer to changes in the dominant trend that appear to go opposite to the direction of the trend. They can occur anywhere, which is why all real-time Forex charts appear rugged with up-and-down movements, even though market analysts may be saying that the markets are on a strong up/down trend.
As a trader, you need to be able to identify corrective waves and distinguish those from actual reversals in the trend. But, that is much easier said than done. A good strategy to help you do this is the Elliott Wave Theory which was put forward back in the 1920s. Corrective waves are a crucial part of the Elliott Wave, where the trend reverses as the markets correct themselves. (The Elliot wave theory and how to use it)
How corrective waves appear on charts
The main corrective wave pattern is the one that is created after traders realize an asset has been overvalued and begin to exit their positions. It is characterized by the reversal of the impulse wave, which was previously the dominant trend. However, smaller corrective waves can also appear along the dominant impulse waves as traders test the markets.
Corrective waves on impulse waves
The impulse wave can be a downward or upward trend, but it is always the major, dominant trend. On an uptrend, corrective waves are the smaller downtrends that look like the direction may be changing.
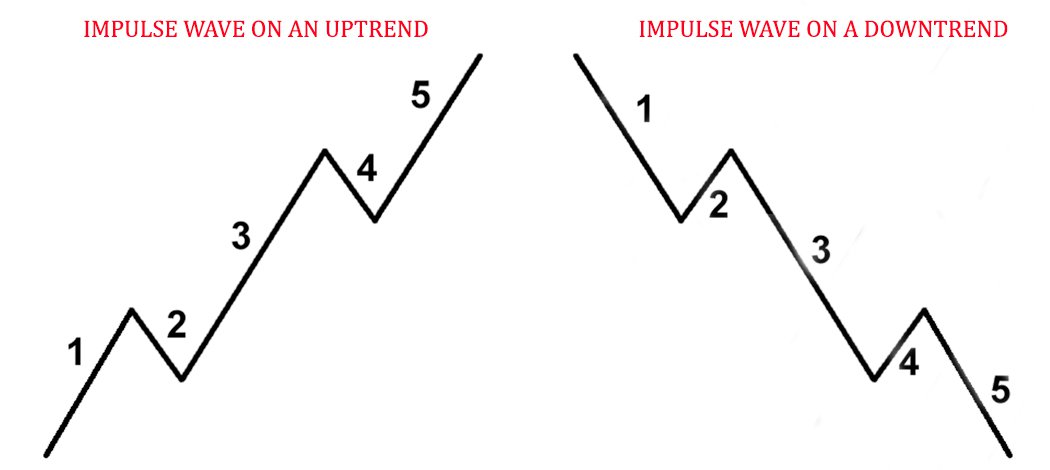
Trends 2 and 4, on both the uptrend and downtrend, are the corrective waves that appear on the impulse wave. Wave 2 is created when markets assume the asset has already been overbought and traders close their positions, causing the direction of the price to reverse. This sentiment is usually backed by oscillating indicators which can either show an overbought market on an uptrend or oversold conditions on a downward impulse wave.
The third wave occurs when more people get in on the action, causing prices to move significantly in one direction. Then, wave 4 will form when many traders take their profits and close open positions. So, the impulse wave will have 2 corrective waves, but these are usually smaller compared to the main corrective wave.
The main corrective wave
According to the Elliott Wave theory, markets will correct themselves when the underlying asset has been overbought or oversold, and this market correction will occur in the main corrective wave.
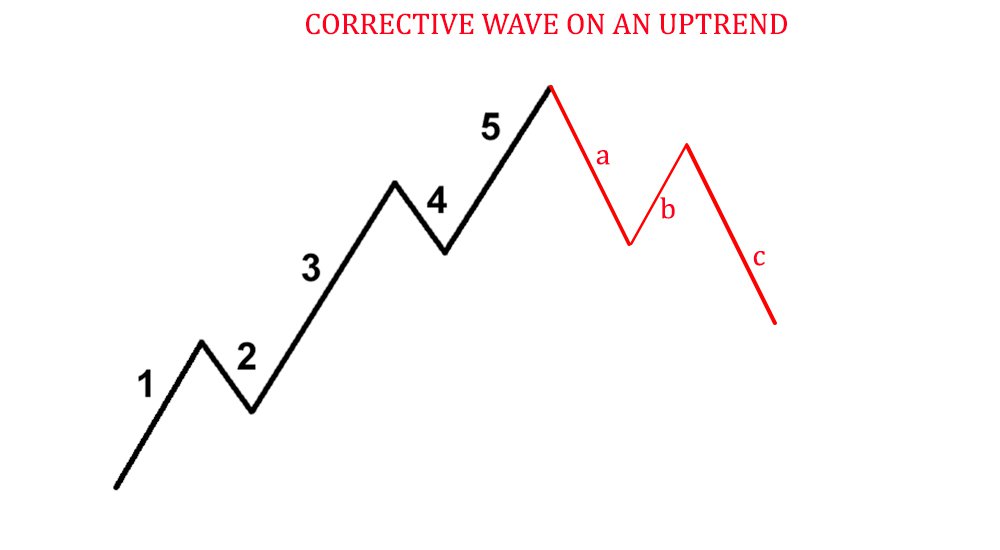
After an uptrend is over, the trend is going to reverse in a corrective wave pattern. This is characterized by the 3 waves A, B, and C as you can see in the image above. Wave A is the first sign of the corrective trend starting to form and it is the result of traders realizing just how overbought the market is and getting out. It doesn’t last long, though, because there will still be people assuming it is just another correction in the market before the uptrend continues.
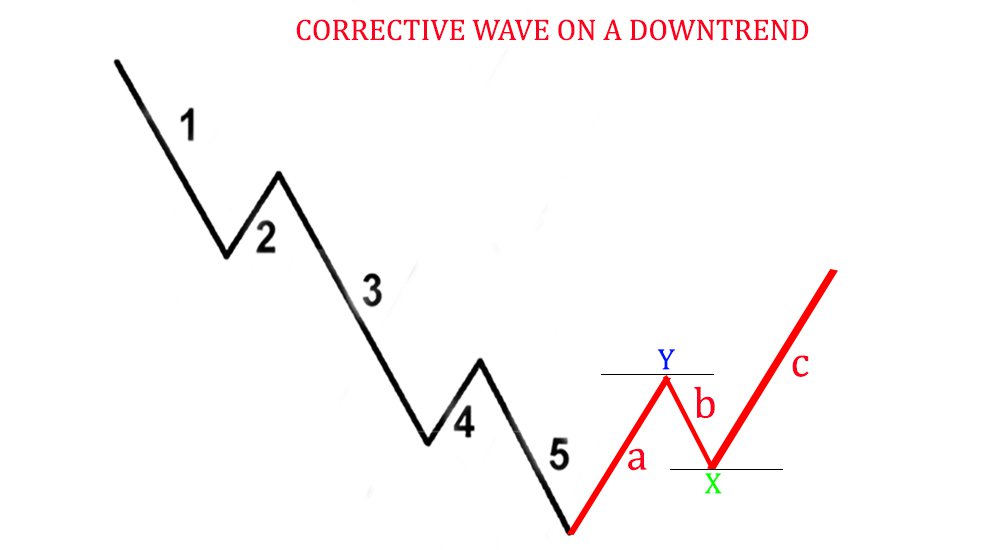
After the dip by wave A, other traders will enter long positions causing the uptrend to resume on wave B, but only shortly before news breaks that the asset has been overvalued. This will cause the trend to reverse completely, and wave C will be a strong downtrend. A similar situation can occur in a downtrend, too, and you can just flip the chart above to something like this:
How to spot corrective waves for profits
Corrective waves present an excellent opportunity to enter into a trade. On an uptrend, a corrective wave allows you to buy the asset at the lowest price so that you can make a bigger profit, and vice versa on a downtrend. In short, it allows you to buy low and sell high.
In the illustrations above, it would be more profitable to buy the asset after corrective wave B had pushed prices lower to point X than to buy at point Y and have to suffer a drawdown to X before you started making a profit. On the other hand, it can be tricky to spot and distinguish a corrective trend from an actual trend reversal. To improve your chances, here are a few tips:
The corrective wave is usually shorter than the previous trend
Anyone familiar with candlestick patterns knows that trend reversals can be identified by engulfing candles because they show shifting market sentiment. (Forex market sentiment indicators) The same argument can be made for corrective waves – if it is shorter than the previous trend, then the market sentiment has not changed. Let’s see how this can be spotted on the Forex trading platforms:
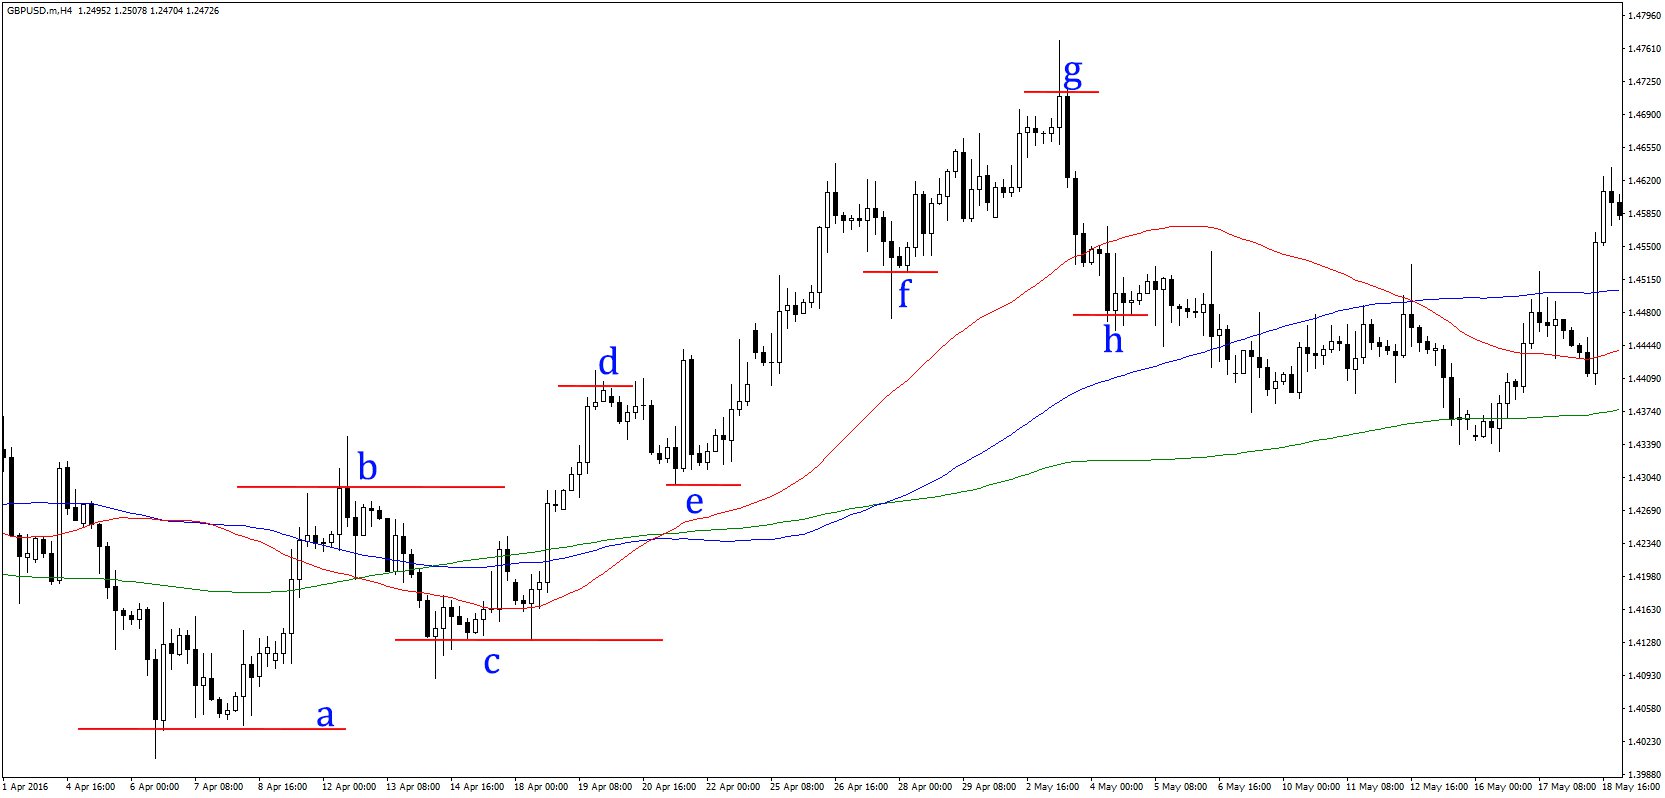
Above, you will notice that the corrective wave between B and C did not engulf the previous uptrend from A to B. The same happened with the corrective wave D to E compared to the uptrend from C to D. However, when the corrective wave from G to H engulfed the uptrend between F and G, this showed that the trend had reversed and that GH was a trend reversal.
Use other technical indicators to confirm
The best way to determine if the trend will reverse or continue is to check with the oscillating technical indicators to know what the market conditions are. (Best technical indicators and how to use them)
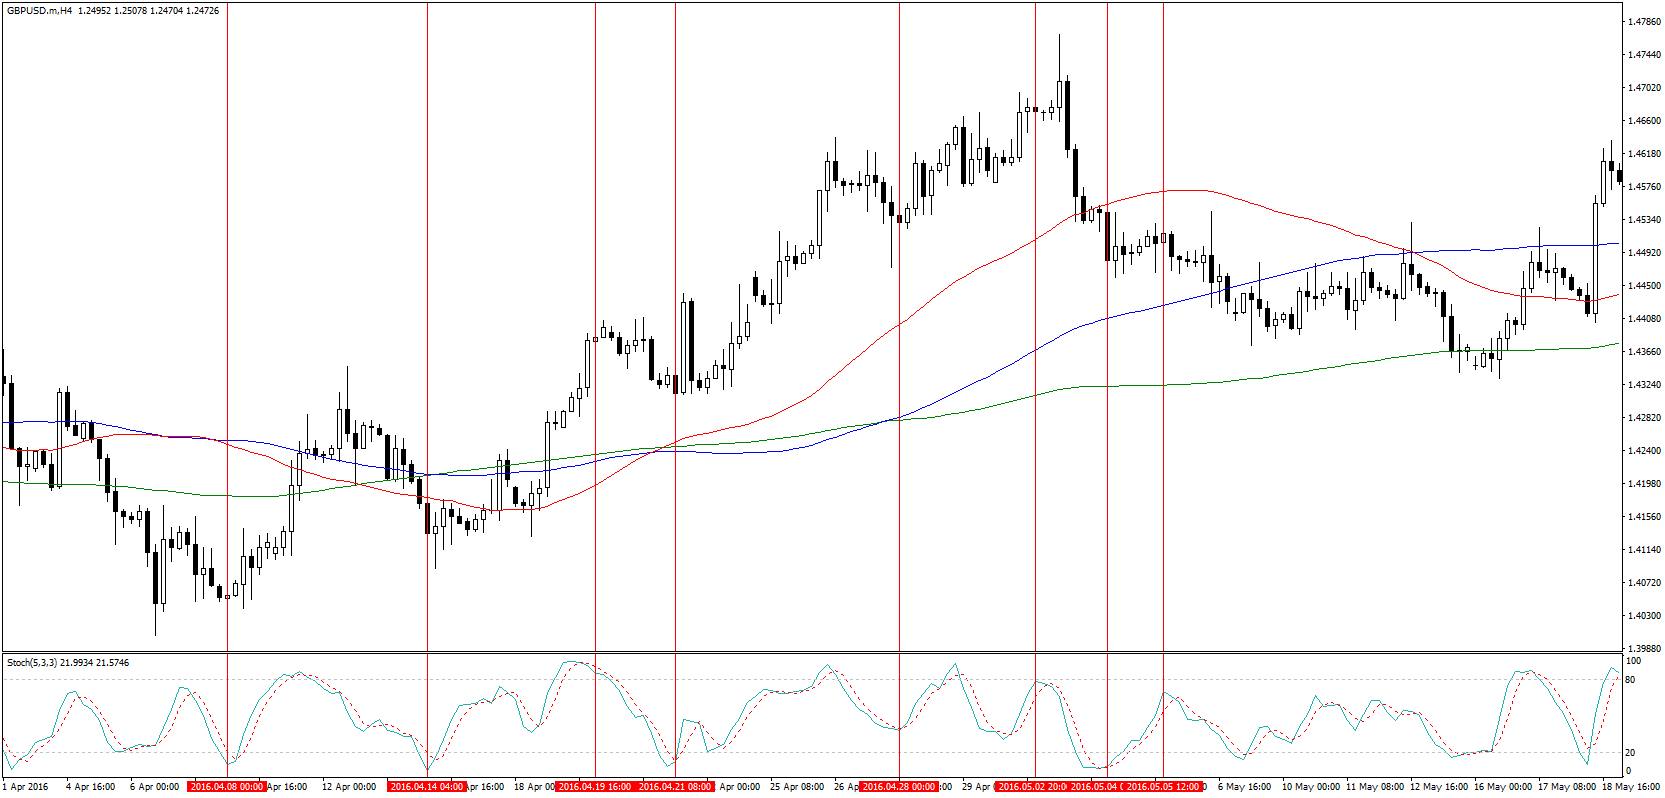
The image above represents the same currency pair as the previous image, but this time with the peaks and troughs connected to readings from the stochastic indicator. In every situation where there was a corrective wave, the corrective trend always dropped to overbought or oversold territory long before it could engulf the previous trend. You can see this at points C, E, and F. For point H, markets became oversold only after going below the previous trough at F, which showed that the trend had indeed turned.
Other technical indicators that could be used include the RSI, MACD, and also other uncommon technical indicators. A more accurate and reliable indicator, though, is the Fibonacci retracement tool which not only shows a reversal in the trend but also offers clues as to where the corrective wave might reach. (Using the Fibonacci retracement)
When using the Fibonacci retracement tool, the most important levels are the 38.2% and 61.8% levels. The 50% level usually acts as a pivot point, but the other points usually provide critical support and resistance levels, which are crucial when looking for corrective waves.
When to enter a trade
As mentioned earlier, always buy as low as you can and sell as high as you can. When you notice a change in the overall trend, use the technical indicators mentioned above to confirm if the trend is turning. If markets become oversold in an uptrend before market prices hit a lower price than the previous trough, then this is probably a corrective trend. On the other hand, if the indicators show oversold conditions after aftermarket prices are below the previous trough, then the trend has turned. Doing the opposite on a downtrend will also work because corrective waves work both ways.
For more illustrations of corrective waves, here’s a video showing it in action: