The S&P is only an index of some 500 major companies in the US, but it is also a lot more. Of all the indices in the US, of which there are a few, the S&P has the widest variety of industries included. From telecommunication to engineering, construction, and pharmaceutical, there’s hardly any industry you won’t find represented in the index. (Trading stock indices)
As a result, the value of the S&P 500 is considered to be a measure of the general health of the US economy, and its changes often echo the market sentiment about the US economy. Now, the index has become one of the most closely watched in the entire world because Forex traders can make decisions about the US dollar based on the performance of the S&P 500. (Forex market sentiment indicators)
History of S&P 500
First off, the S&P stands for Standard and Poor’s which is a major financial company in the world mainly dealing with credit rating. You may have heard of these companies that give credit ratings being referred to as helping to escalate the 2008 Global recession, but that’s a story for another day. For now, you just need to know that S&P doesn’t directly participate in the markets – they remain more like referees.
The S&P was created for this purpose – to provide individual traders with a more accessible financial instrument to trade rather than individual stocks. And that it did. Second, only to the Dow Jones, the S&P is considered to be a yardstick for US economic performance.
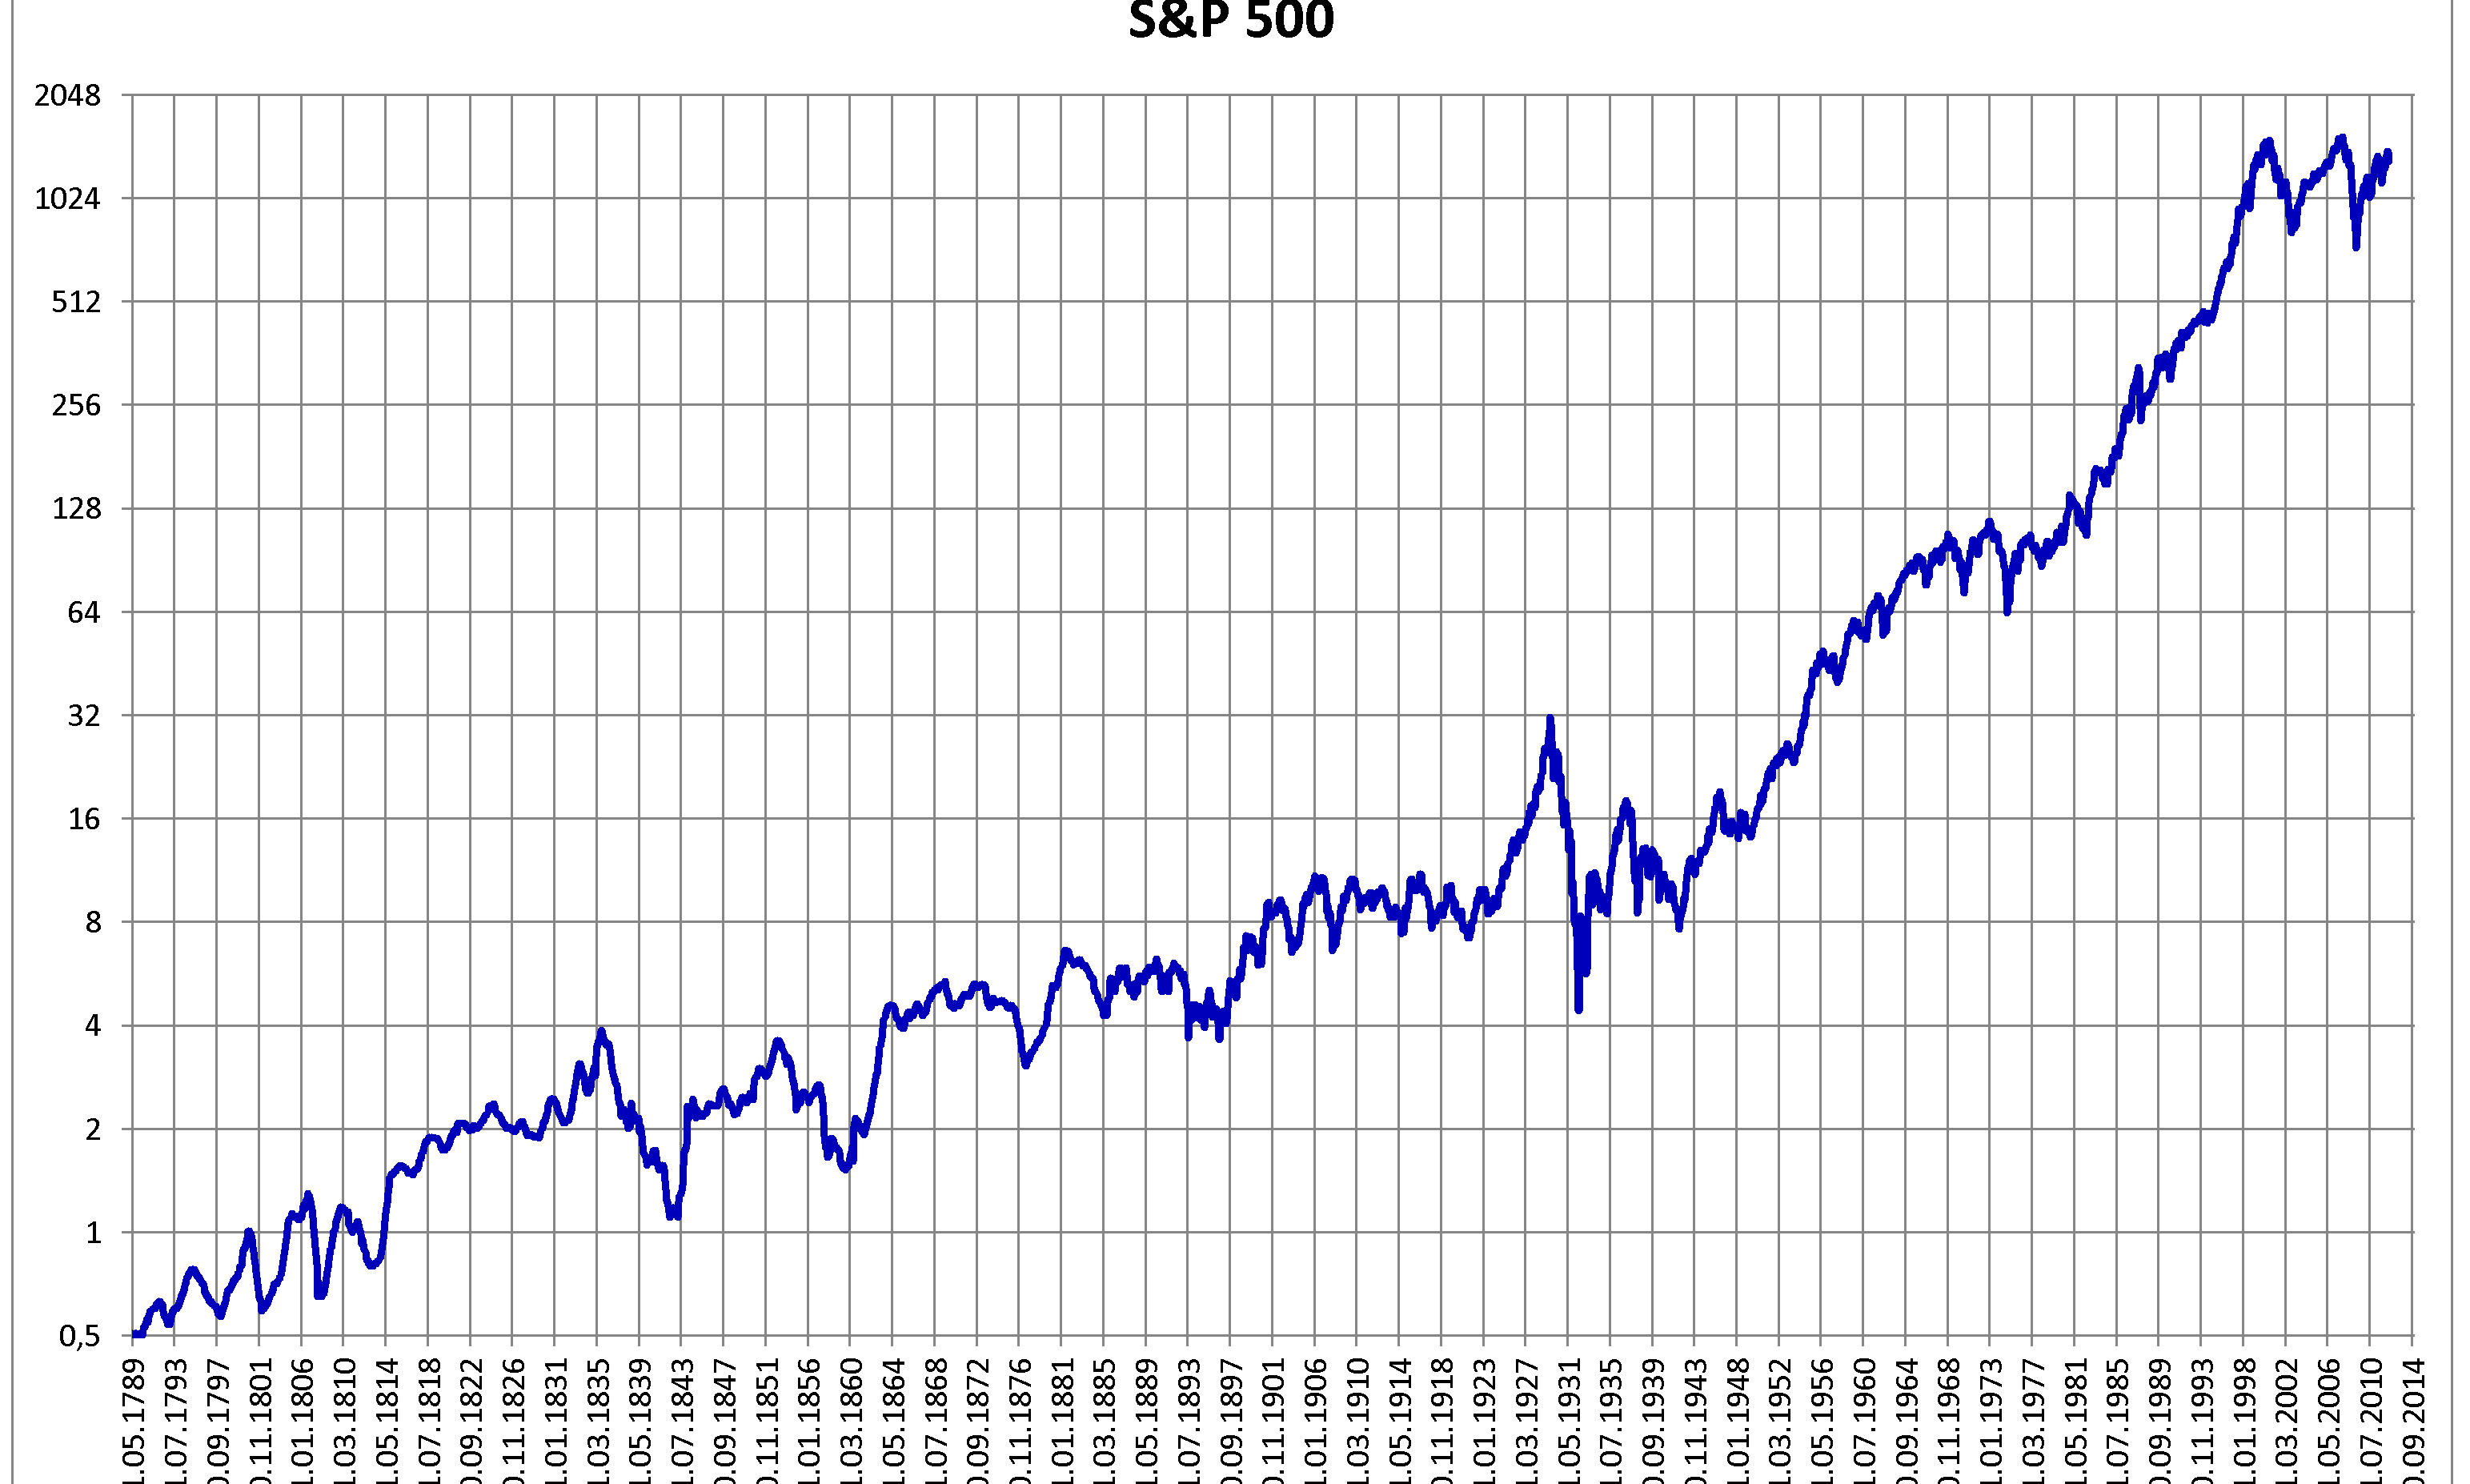
It was first created in 1860 by Henry Poor, and it later became the S&P when Henry Poor’s company merged with Standard Statistics Bureau. It officially became among the first stock indices in 1923 with only a small number of stocks represented. The number of included stocks quickly grew to 90 by 1926 and finally reached the 500-stock mark in 1957.
The S&P 500 Index is a part of the S&P Dow Jones Indices which is then mainly managed by S&P Global. As you can tell from the name, the S&P Dow Jones Indices manages both the S&P 500, Dow Jones Industrial Average, and other indices.
Changes to the value of the S&P 500
Coming from so far away, you can imagine that the S&P 500 has had its ups and downs, and the story goes back to the start.
Early beginnings
Even before it became an index in its own right, it still did find the average of the companies whose stock it represented. In 1871, the average value of the companies was $4.44 which is around 86.53 when adjusted for inflation. It finally reached double digits in 1925 and peaked at $24.86 in 1929. This was during the Great Depression, and it struggled to break through this level. After World War II, the S&P 500 finally picked up the pace, hitting 3 figures in 1969 and 4 figures in 1999.
Into the 21st century
It reached its highest level a year later, in 2000, at $1,552.87 due to the dot-com bubble at the time. The classic market correction brought its value down by about a half 2 years later to around $768.63. (Looking for market correction)
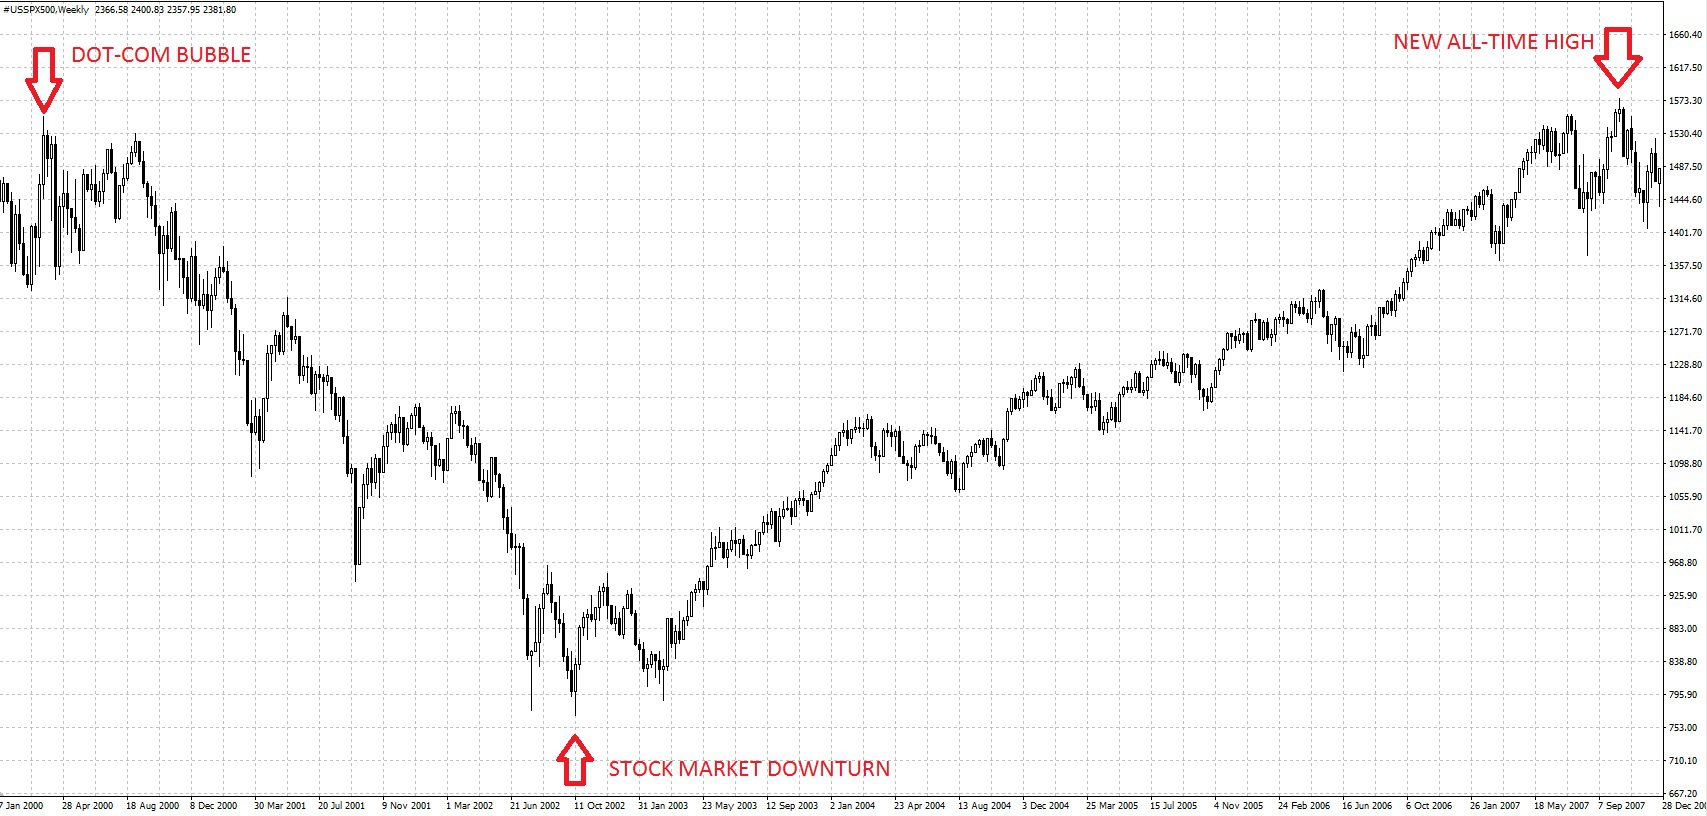
Then came the glory days of the early 2000s that eventually led to the global recession, but that wasn’t before the S&P set a new all-time intraday high of $1,576.09.
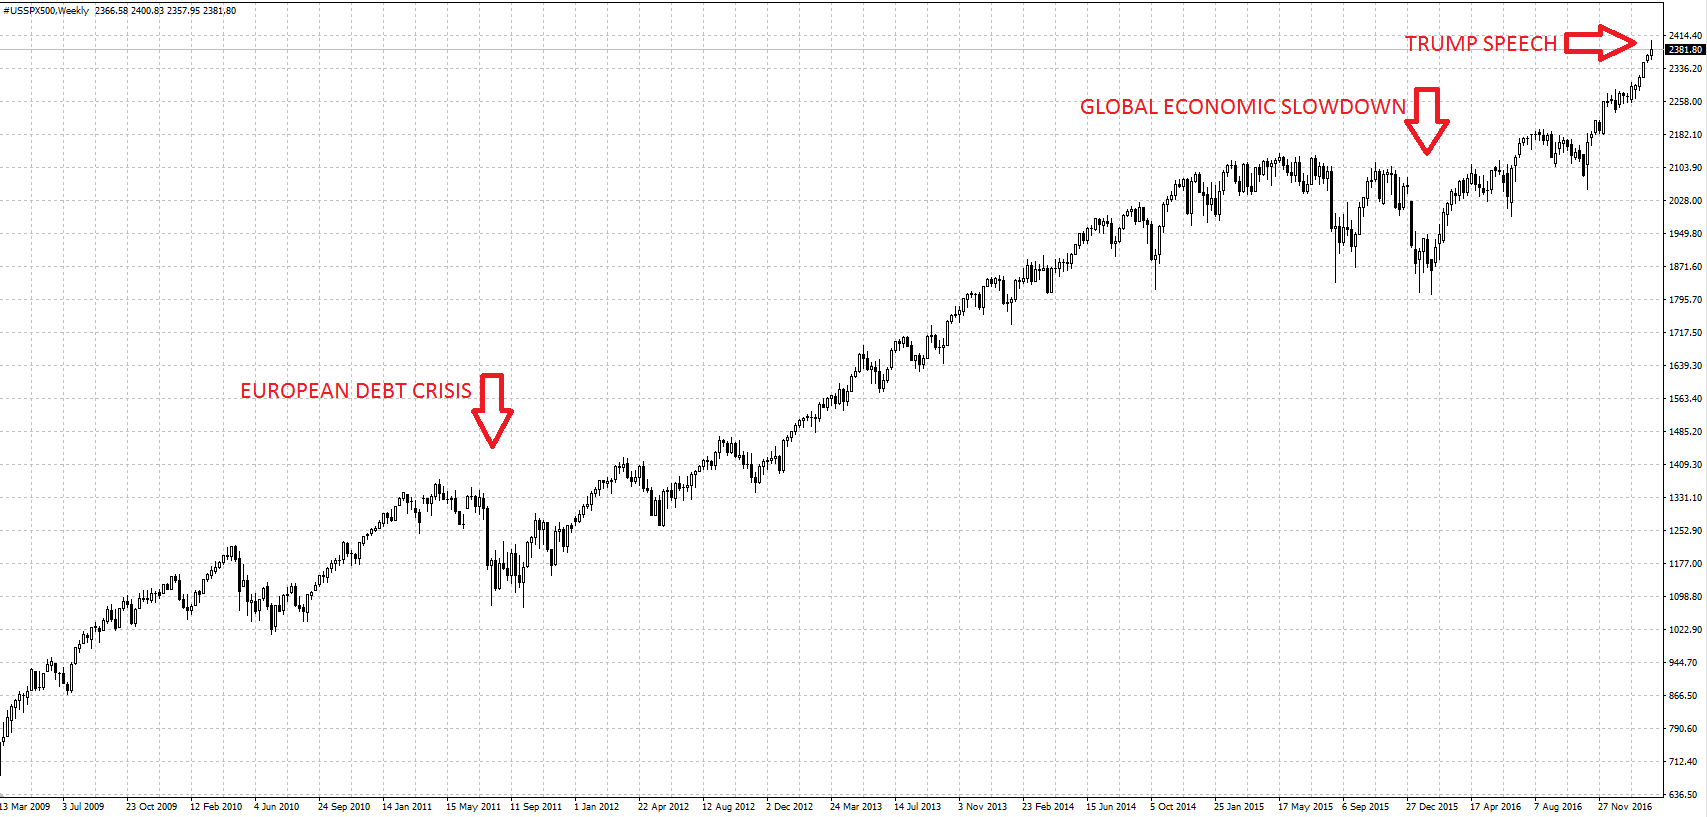
After the recession, the US economy grew exponentially and the S&P was on the up-and-up breaking record highs all along the way to reach $2,130 in 2015. Along the way, obstacles like the European debt crisis in Greece, Spain, and Italy as well as the global economic slowdown at the beginning of 2016 started in China.
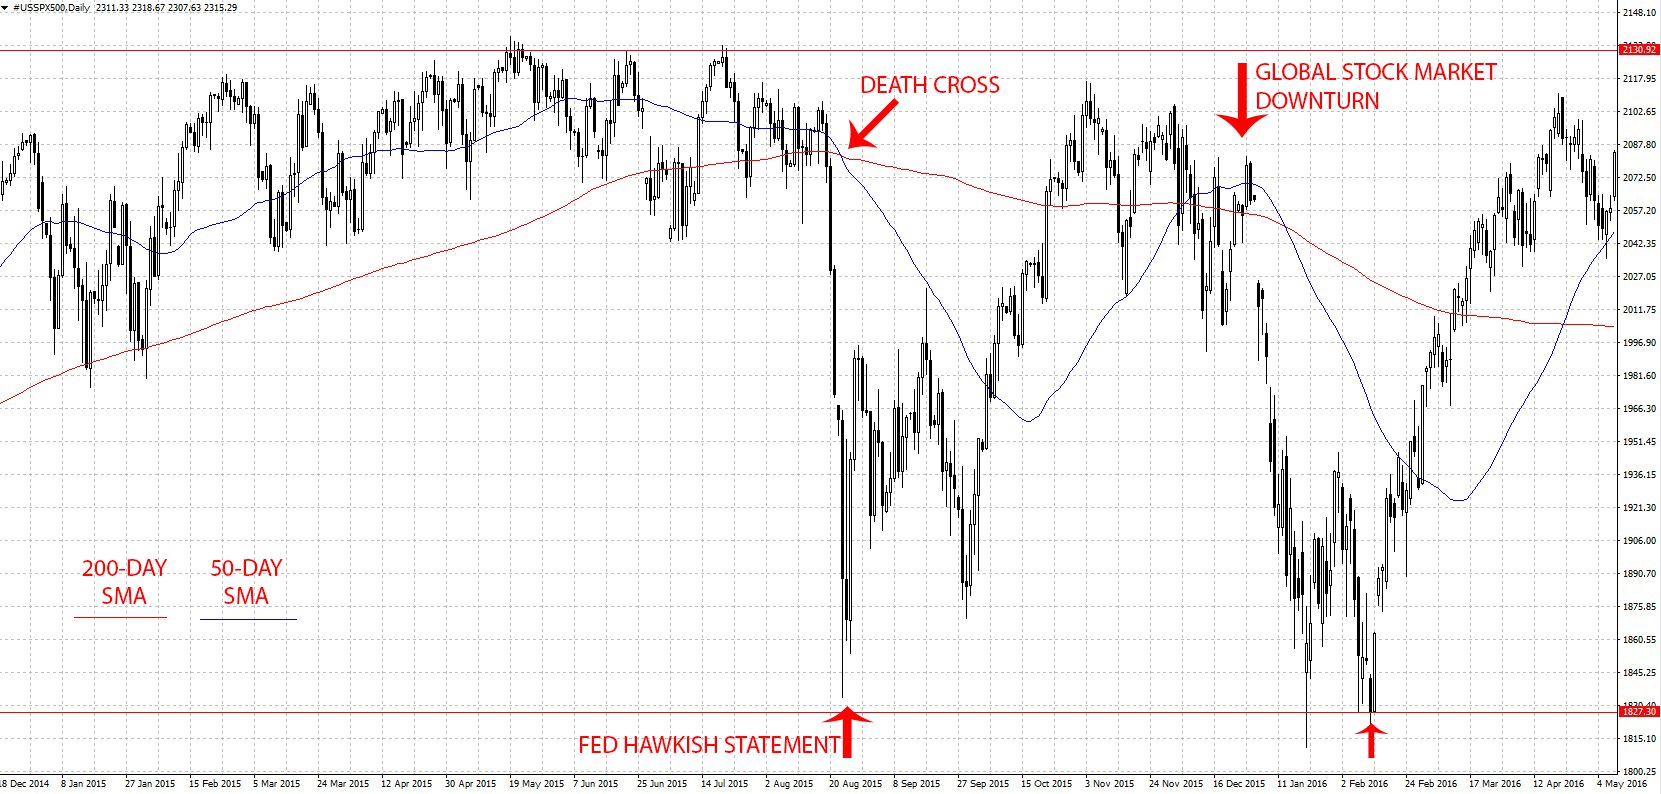
Following Trump’s election as president of the US, US stocks grew rapidly pushing the S&P even higher to reach $2,400. Now, all eyes are on the S&P 500 index to see if it will go even higher.
Why should Forex traders care?
The main reason every Forex trader should worry about the S&P 500 is its correlation to the US dollar’s strength. Whenever the S&P goes up, so does the value of the dollar. Considering that the Forex markets are decentralized and we can’t tell how many traders are long on US dollar positions, the S&P is a bit of a cheat.
Furthermore, since all traders will be looking at this index on Forex charts, this becomes a self-fulfilling prophecy. Right now, you can bet that traders are long on the US dollar and more will go long as soon as the new week starts. Knowing this gives you an idea of how to trade so that you can be caught on the right side of the wave.
Then there’s the issue of a market correction, which happens when an asset is either over-valued or under-valued. The US dollar and economy are, in my opinion, and many experts are overvalued. Therefore, chances are high that we might experience a reversal soon as traders begin to exit their positions. Again, this could be a trading opportunity to short the US dollar, but you should wait until you get confirmation.
As you can see, the S&P 500 can be an enormous resource for trading information, and every trader should be aware of it.
How to make use of the S&P 500
The first and easiest way is to simply use it as a guide. The value of the S&P 500, the US dollar index, and subsequently, the strength of the US dollar are highly correlated (See Currency correlation and how to use it). Price changes in one of them should tell you how to trade another so that you can make more informed decisions. Most Forex trading companies will provide live charts for this and more indices, use these as a guide. Plus, if you make use of all the teachings from previous articles, you will be able to spot plenty of trading opportunities.
You can also trade indices if your Forex broker permits it. These indices will often be offered in the form of a CFD, and if you compare CFD brokers, you might find one that allows you to participate. Just remember that there are no mini-lots and micro-lots with indices, and you will need to either have substantial capital in your account or adopt excellent risk-management skills in Forex.
For a visual explanation of the S&P, here is a short video explaining the basics:

 ThailandUS