 Alpari
 XM
XMIn a previous post, we looked at how you can make money by trading breakouts in the market. This is a very popular trading strategy and also a very successful one, after all, why talk about it? In that same post, I also mentioned, as a precaution, that false breakouts (fakeouts) are also quite common whenever you’re looking for breakouts. (Breakout trading strategies)
Anyone who has used the breakout trading strategy may have been caught up in one or two of these false breakouts. Unfortunately, it’s not something you can completely avoid, just as there are no perfect, 100% successful trading strategies. However, you can use this knowledge to your advantage and trade the false breakout. Think of it as trading against the trend, going against the tide, which is not always recommended but sometimes necessary. (10 steps of successful traders)
What is a false breakout?
When a market is trading within a range, it will go up to reach the resistance level and then back down to the support level. The ranging market will remain within these limits, but sometimes a breakout will occur that takes the market out of the range. When this occurs, it is called a breakout from the range, and the S/R levels are broken through. However, sometimes it may seem like there is a breakout when there isn’t one. This is what we refer to as a false breakout or fakeout.
Types of false breakouts
There are three types of false breakouts determined by their cause and also how they appear on the charts:
Bull and bear traps
These are the kinds of false breakouts that occur after there has been very strong momentum in the markets. So much so that traders believe the momentum is going to break prices above or below a key resistance or support level.
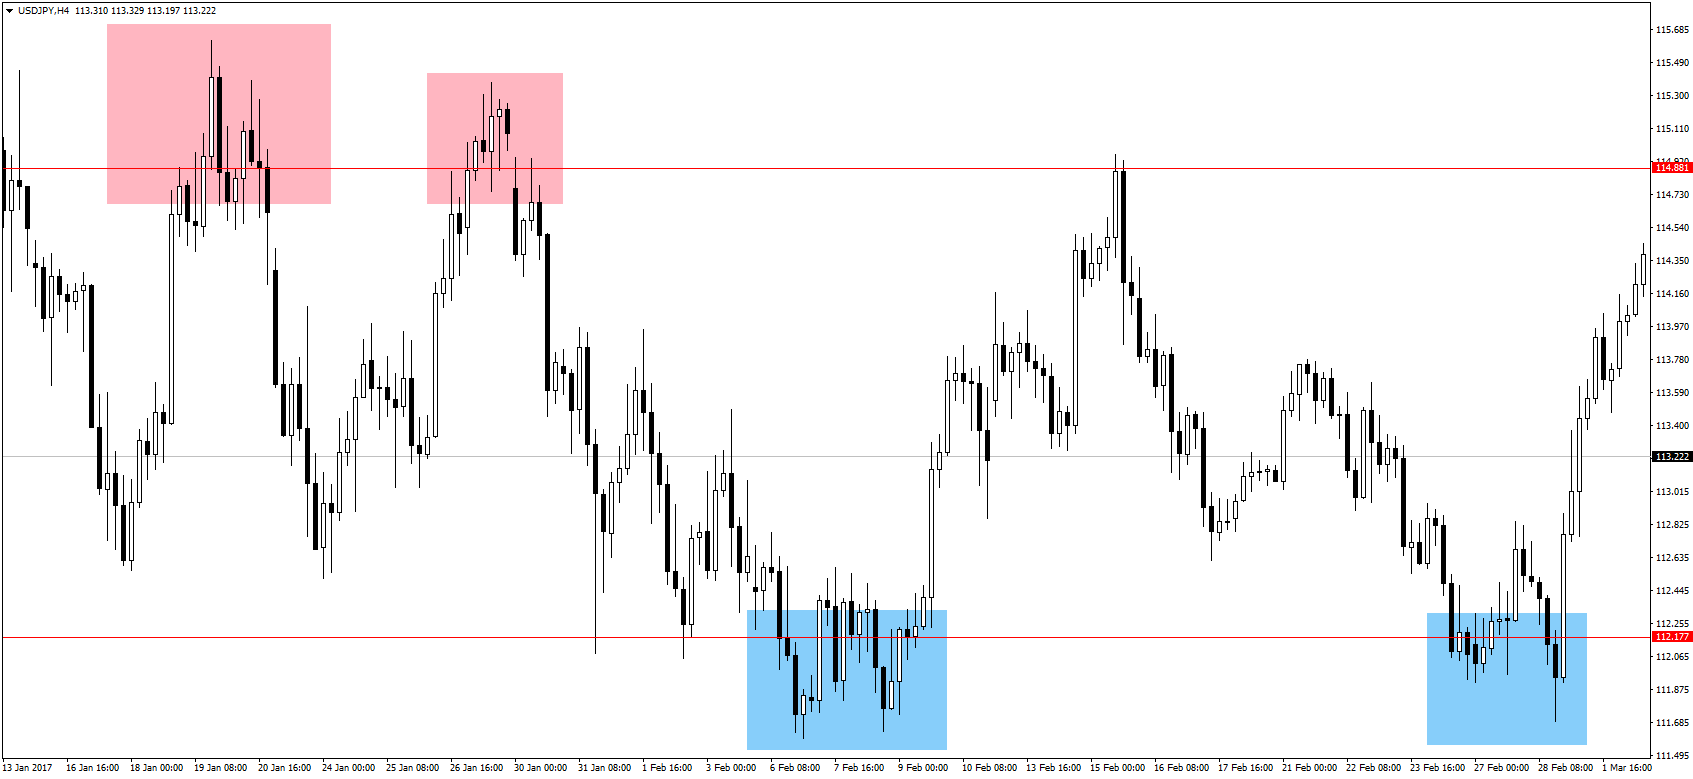
In the above image, you can observe the bear traps shaded in blue and the bull traps shaded in red. Bull traps happen when there has been a very strong momentum to the upside such that traders assume markets will just keep going higher. Once prices reach the resistance level, momentum does indeed cause prices to break above this level. Seeing that the resistance level has been broken, more traders start to get in on the trade by opening long positions, hoping to catch the upside move.
Instead, prices start to go down and traders with long positions are losing money. In the case of a bull trap, it shows that the major players in the markets – the banks and hedge funds, have taken their profits and closed their positions. Perhaps they had placed take profit orders slightly above the level of resistance, so the majority of bulls have left the market. Since they were responsible for the strong upward momentum, the momentum dies and the bears take over.
The opposite is true for the bear traps, bears push the markets down with heavy short positions, and they take their profits after the support level is hit. Smaller traders see the break and assume the downward momentum will continue, but major market bulls push prices back up.
Traders who get caught in the bear and bull traps are usually retail traders who don’t have the clout to influence market prices. To avoid getting caught in these traps and false breakouts, wait. It is easy to get excited and want to enter a trade as soon as there is a breakout, but patience is key. Remember when we spoke about Jesse Livermore, he said the key to his success was sitting down, even more than the trading itself. So, when you see a possible breakout, hold your horses and wait.
What are you waiting for, a confirmation? A true breakout will often see a confirmation happening whereby prices come back to test the S/R levels. If this S/R level holds up, then you know you have a true breakout, like this one:
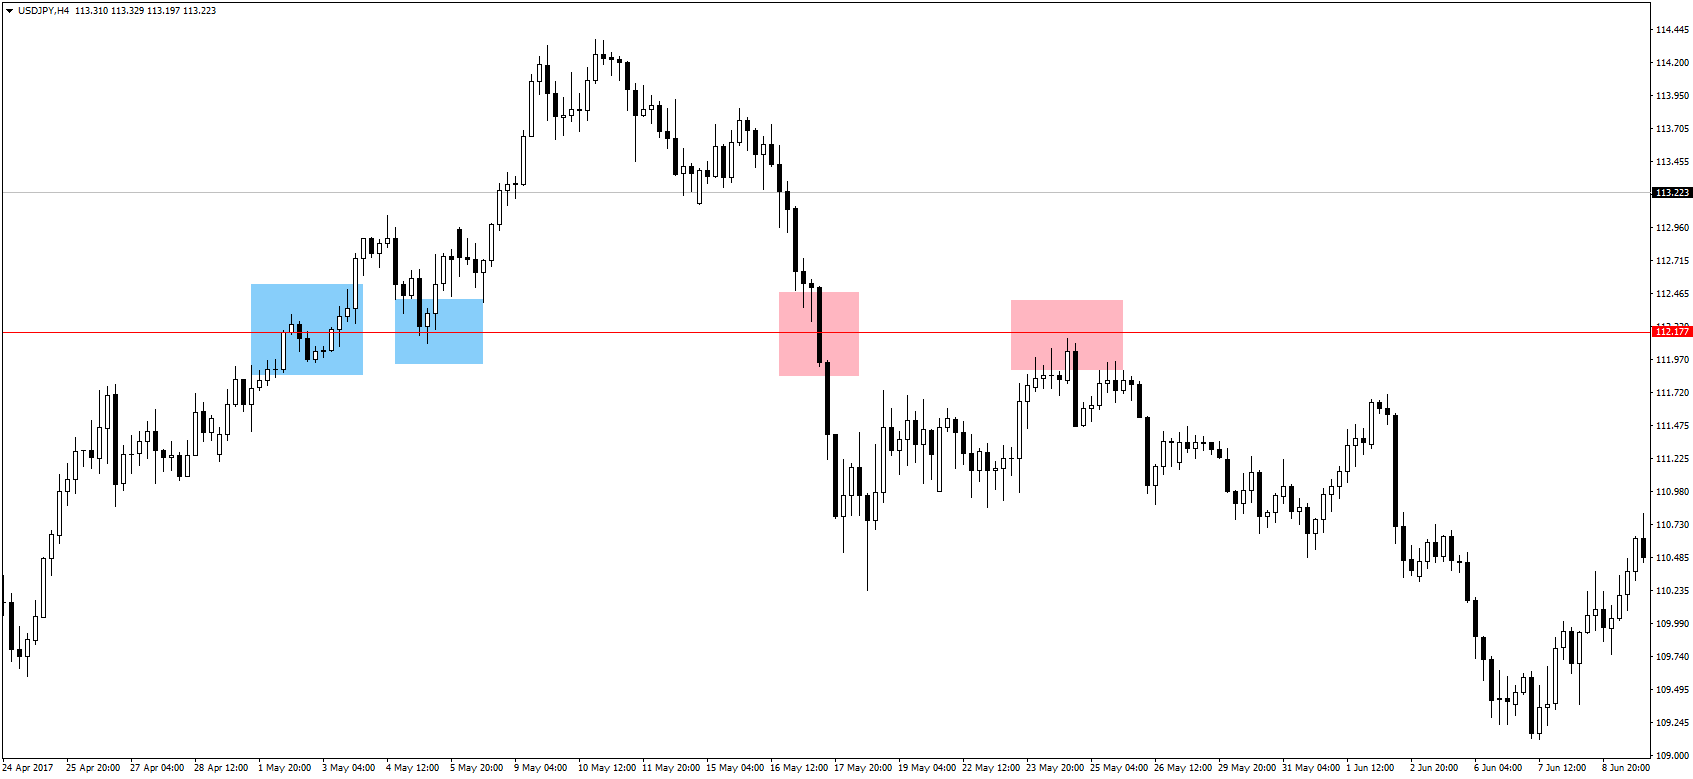
In the first step, there was a bullish breakout, after which prices came back to test the resistance level. After the test, it became the support level necessary to propel prices higher. In the second step, the bears broke through the support level, but only the subsequent confirmation should have confirmed the breakout.
Another way to confirm false breakouts is through oscillating indicators. I prefer to use the stochastic indicator, but the TDI indicator is also very effective. Let’s look at the image of our bull and bear traps with these indicators added to the Forex charts online:
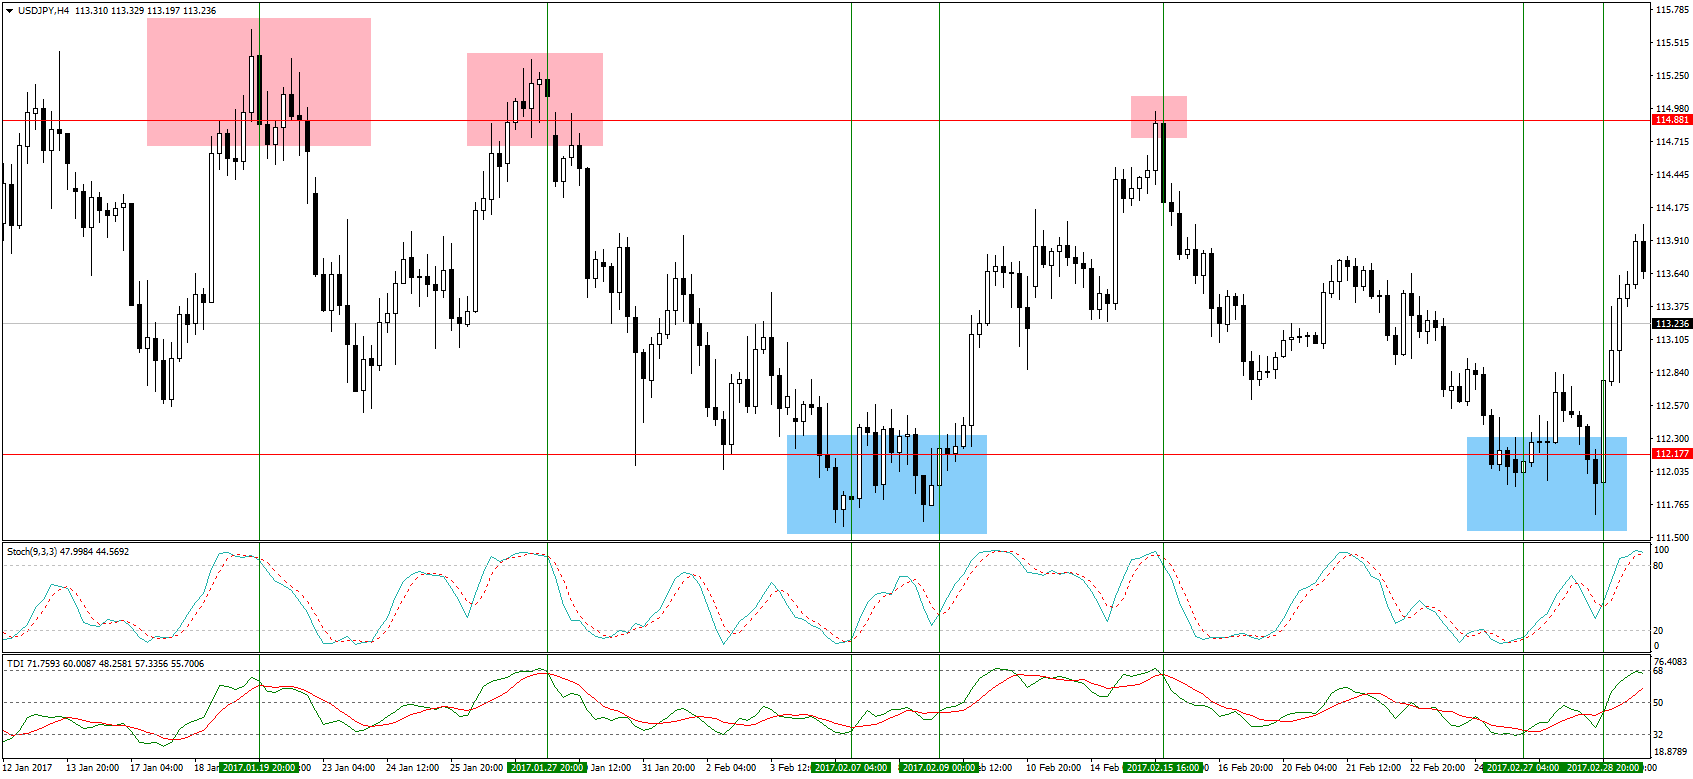
In all cases of a bull trap, you can see the stochastic oscillator in overbought territory, and the TDI cross happening. With the TDI indicator, you want to check the position of the red line, whereby shows a bearish sentiment when the red line is above the green line. Even the stochastic oscillator has a cross, which is further confirmation. The TDI red-green indicator should be found in most Forex trading platforms and it can be added to the charts just like other indicators. (Best technical indicators and how to use them)
You can also use other techniques to identify false breakouts with these indicators, like divergence. For example, in a bullish market, even the oscillating indicators should form higher highs and higher lows. Vice versa for a bearish market. Once such a trend is broken, you have a divergence and that should tell you the trend is over. In our image above, you can see this divergence in action at all positions where there was a bull or bear trap. (Learn the 5 Secrets of divergence in Forex)
False breakouts of consolidation
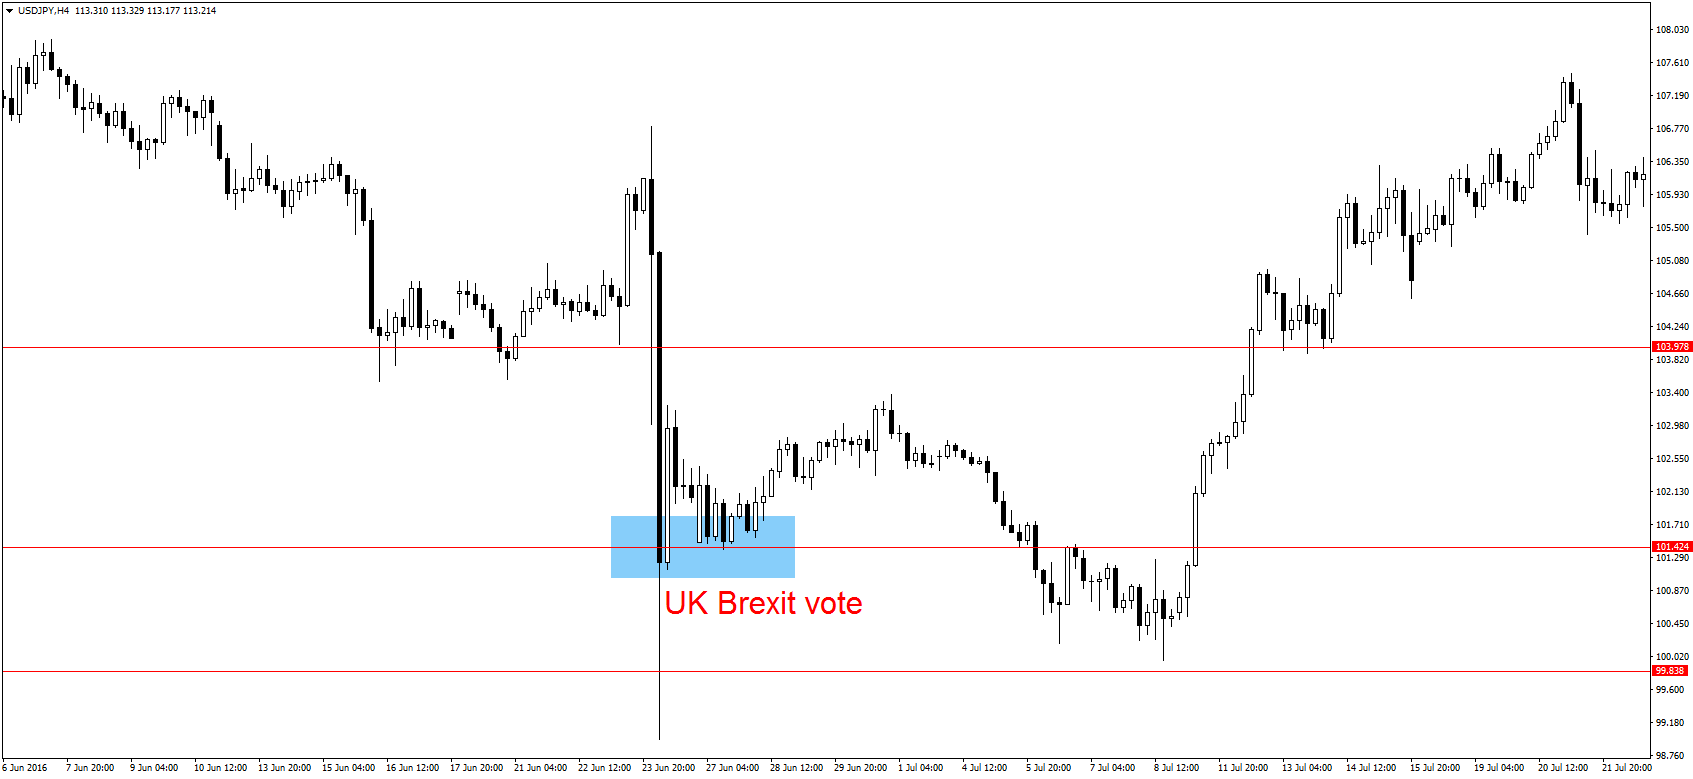
These false breakouts are the most common and easiest to identify. Yet many traders still fall for them. To teach you about them so you don’t end up losing money, here is what such a false breakout looks like:
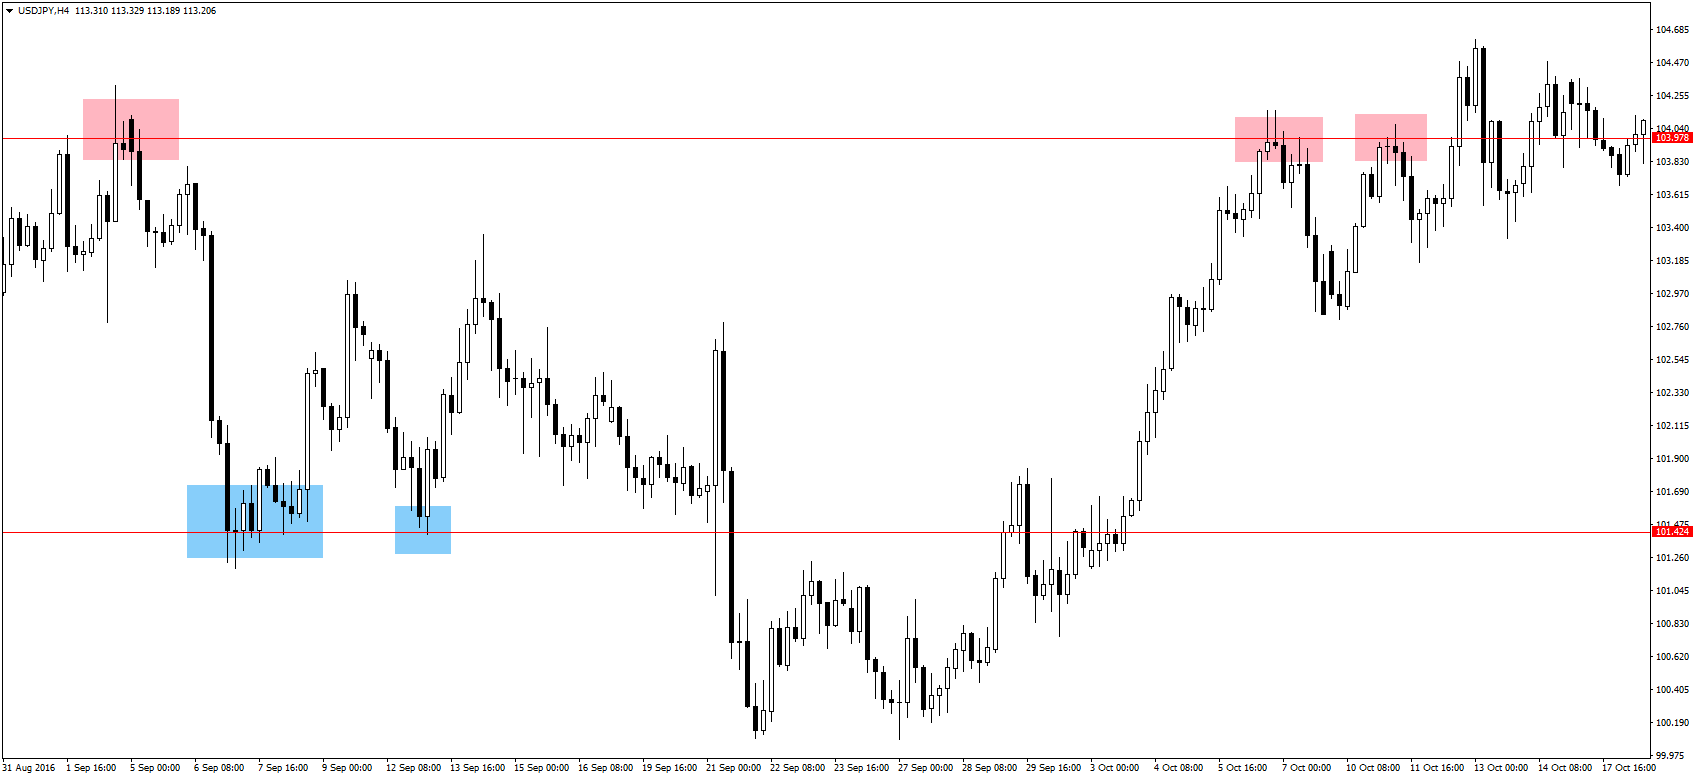
The areas shaded in red show false breakouts of consolidation to the upside and the blue-shaded areas, false breakouts of consolidation to the downside. As you can see, these types of breakouts are easy to spot because the candle does not completely break above or below the resistance or support level respectively. As long as the candle has not completely broken above an S/R level, you should know it probably is a false breakout.
These types of false breakouts occur when the major players in the market take their profits and cover their positions. The momentum they had created thus fades and market prices turn in the other direction. The reason for the temporary break is created by momentum, whereby more traders enter positions in the direction of the trend toward its end. They see a clear trend formed and want to get some pips off it before it hits the S/R level. Critical news announcements can also cause false breakouts to occur, again because traders begin to cover their positions just like in this case:
To confirm these types of false breakouts, oscillating indicators are once again very effective, especially my trusted stochastic and TDI indicators.
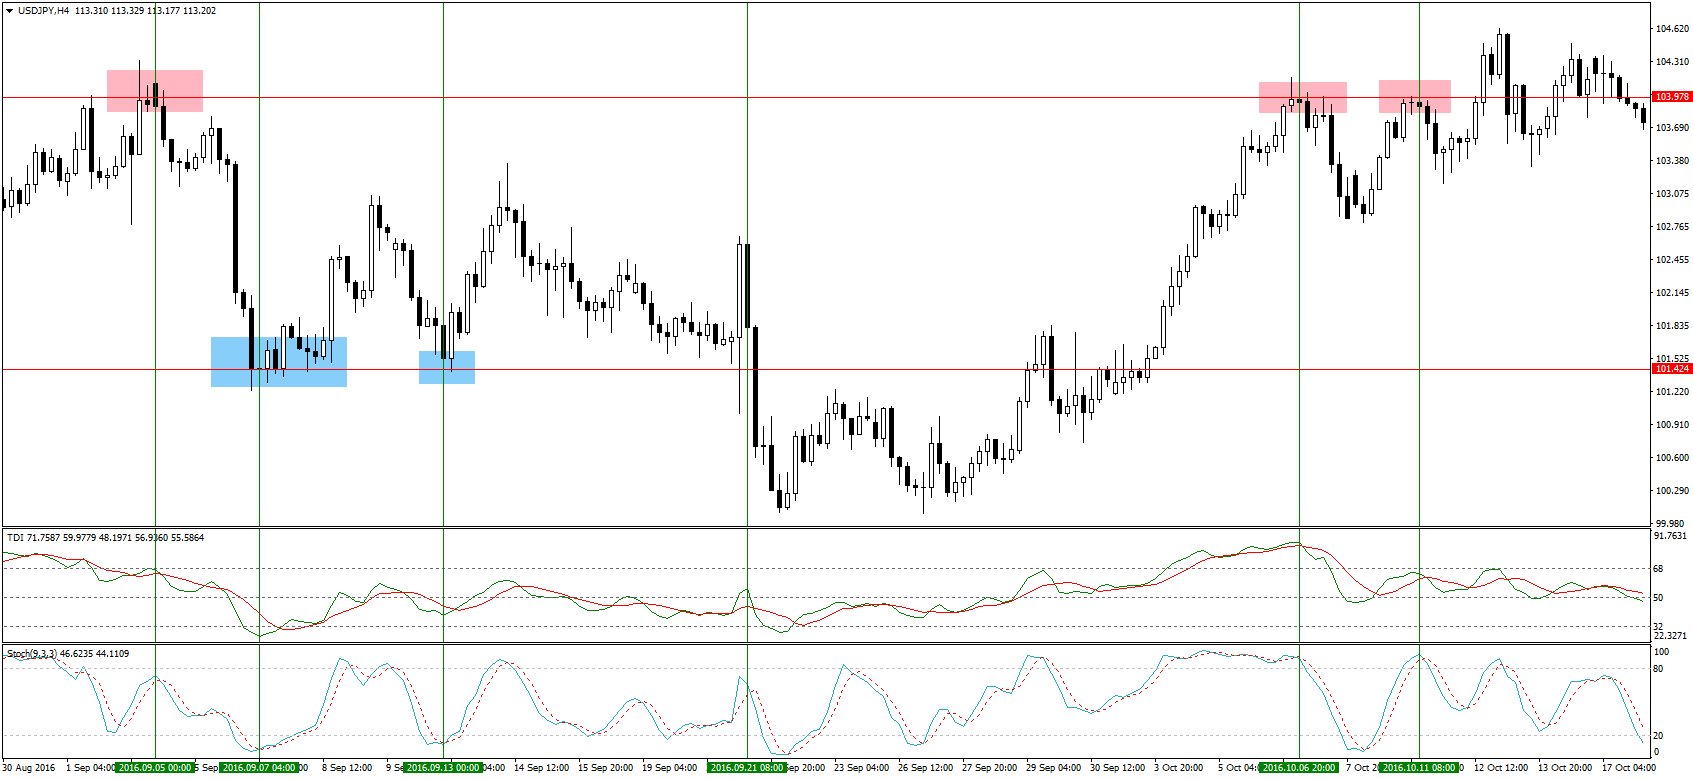
In all cases of the false breakouts to the upside, the stochastic indicator was in overbought territory, and the TDI cross had the red line above the green. As mentioned earlier, these false breakouts are easy to identify, but you should still be aware.
Using candlestick patterns
Some traders use technical analysis of price action to determine the direction of the markets even without using any indicators. You too can learn the most effective candlestick patterns to identify false breakouts in the markets. Let’s look at some examples:
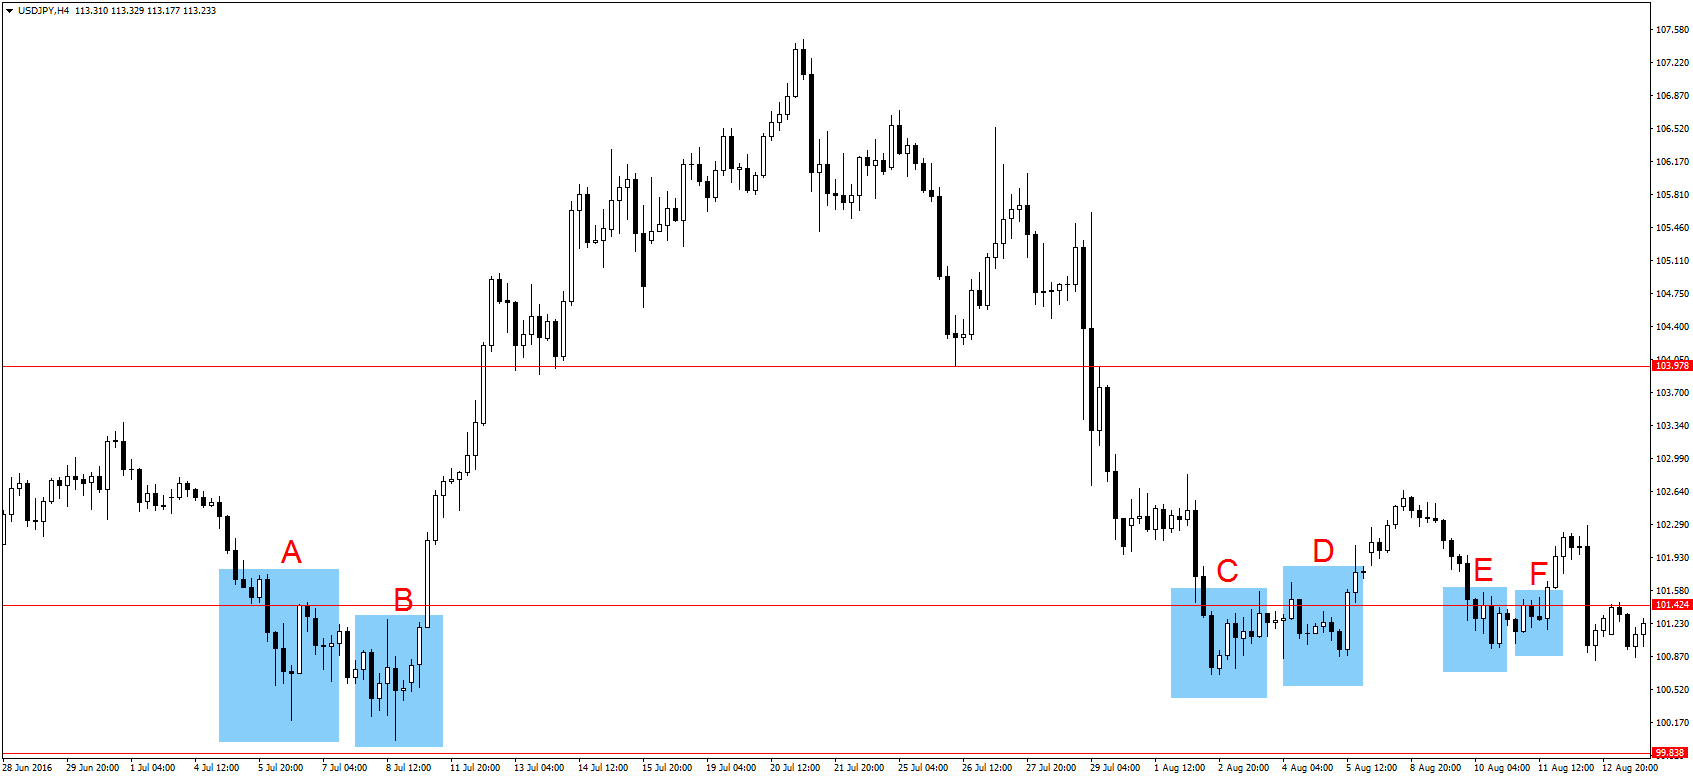
After several attempts to break through the support level, three false breakouts could have been identified using candlestick patterns. You will also see that in each false breakout, there is a pair of price action moves, which can be determined by the candlestick patterns:
- A & B – After prices broke below the support level, the breakout seemed clear until a hammer was formed. That showed the end of bearish sentiment and was followed by an engulfing candle and a strong move to the upside that was ended by the hanging man. The second part of this false breakout is marked by a doji candle at area B which showed indecision in the markets. After this, a marubozu candle showed strong bullish sentiment and the markets returned above the support level.
- C & D – The break at area C was reversed by the spinning top, but the hanging man toward the end of the area showed diminishing buying power. In area D, several candlestick patterns showed market indecision, but the engulfing candle at the end was enough to bring prices back above the support level
- E & F – An inside bar at area E stopped the downward momentum, followed by a spinning top which left the markets undecided. It took an inverted hanging man at area F to complete the false breakout pattern
There are many candlestick patterns, and they can be very effective in trading, particularly when identifying false breakouts; and actual breakouts too. From the examples in the above image, I hope you have learned a couple of them already, but you should find out more about them.
More reading: