This trading system uses the principles created by Thomas DeMark on technical analysis. Thomas DeMark is a renowned trader well known for creating what is now referred to as the DeMark Indicators. Many prominent hedge fund managers and market researchers are known to be users of these indicators, and that only goes to credit the trading method.
I’m not going to keep rambling on though, you can find out more about the guy on your own time. For now, I’d like to share a custom trading method derived from some of the DeMark Indicators and a bit of sizzle to make it more applicable to the Forex market.
What you need
All the tools for this trading strategy are already in your Forex trading platforms, whether you’re using MetaTrader, cTrader, or other proprietary trading software – even web-based platforms. That’s just the first advantage – there’s no need to download any custom indicators to your computer (Best technical indicators and how to use them).
Trend lines
DeMark Indicators are primarily trend lines and these are the foundation of the entire trading system. Most of the DeMark Indicators include trend lines and nothing else, yet they were accurate enough to predict major market moves to a T. These have to be drawn manually, so you will need to know how to do so.
Exponential moving averages
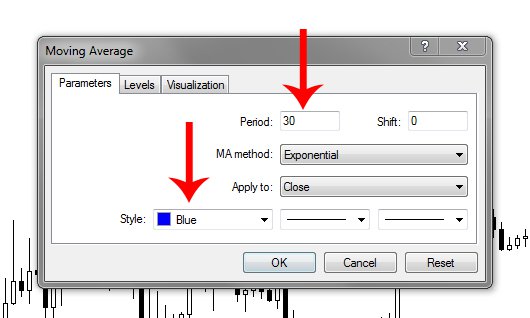
For these, we’ll need the 9 and 30-period EMAs. The EMA indicator is bundled together with the SMA, you just need to change some parameters after double-clicking on ‘Moving Average’ in the ‘Navigator’ window. Also, change the colors so that you’re able to distinguish the two (obviously)

Momentum indicator
This too is also bundled with most Forex trading platforms, but it will require a bit of adjustment. On Metatrader, it appears as a single line by default, which doesn’t tell us much. To make it work, you will need to draw a horizontal line across the 100 mark to separate oversold and overbought market conditions.
Placing the orders
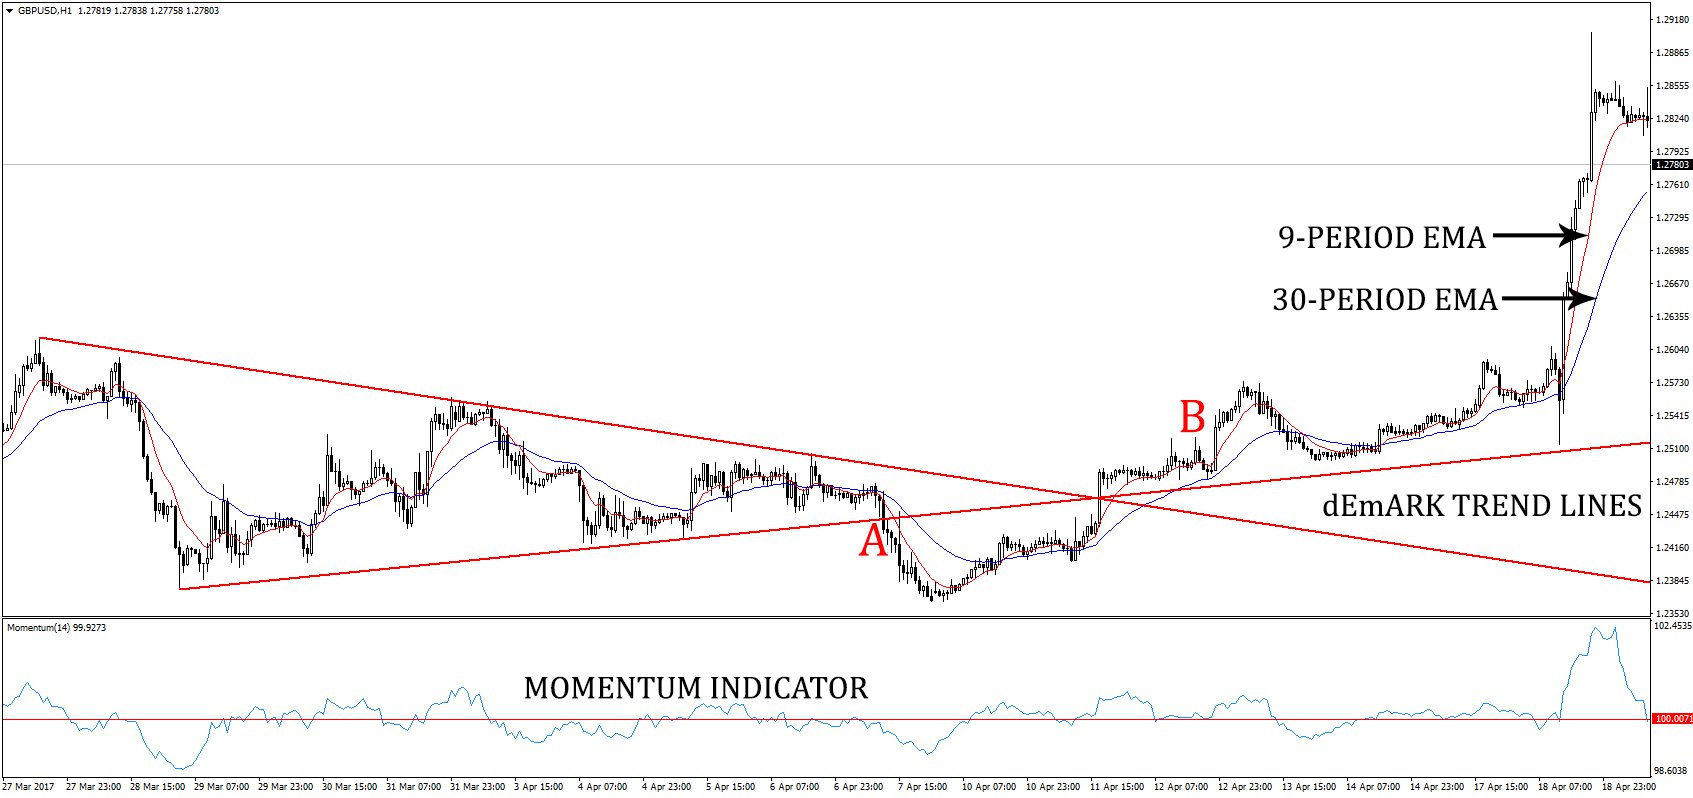
Assuming everything is ready, we should have something like this:

When to enter a trade
The above chart is an ideal example because it shows when it’s best to both go long and short on a currency pair. Point A is perfect for shorting because:
- the 9-period EMA is trending below the 30-period EMA,
- price just broke out of the pre-existing trend which it had been within for a long time, and
- The momentum indicator is below the 100 mark
All these indicators must be showing the same thing, and you should not rush until you get the confirmation. As you can see, once the price broke out of the trend, it kept going down, hitting a support level after which it reversed.
For going long, point B would have been perfect because:
- the 9-period EMA is trending above the 30-period EMA,
- price just broke out of the pre-existing trend which it had been within for a long time, and
- The momentum indicator is above the 100 mark
Even with all the indicators giving a strong buy signal, you will need another indicator to know exactly when to enter the position. In these situations, you can find yourself in a fake-out if you’re not careful, especially because we’re using EMAs rather than SMAs, and ones with a very short period.
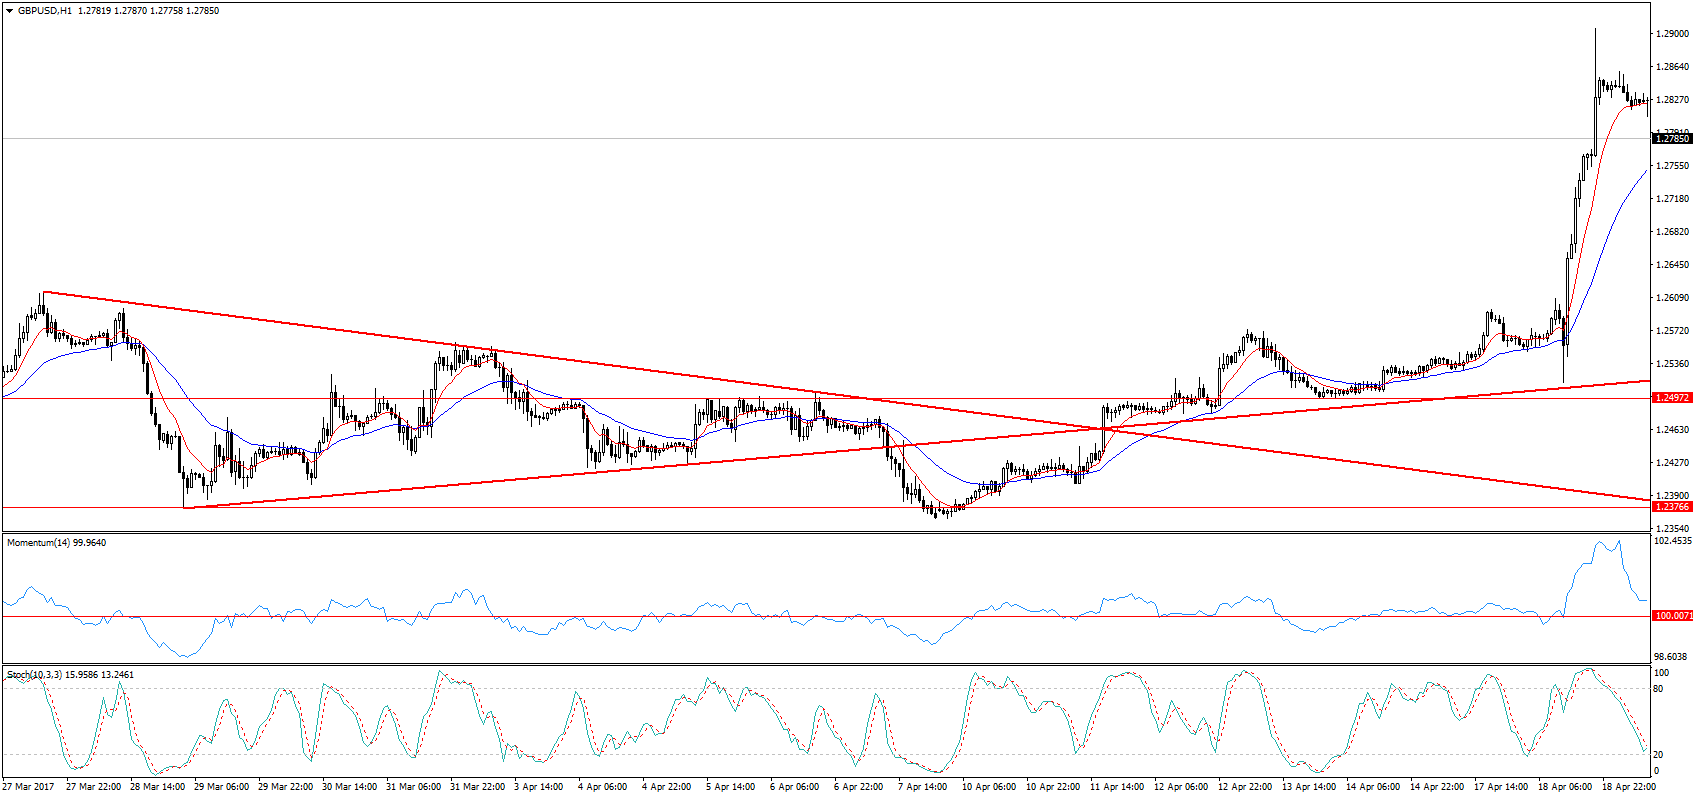
Using EMAs allows us to spot breakouts in the trend earlier, so that we catch the entire trend, but they are prone to fake-outs due to their fast response to price changes. For confirmation, I like to use pivot points to establish support and resistance levels, but the stochastic oscillator could work just as well, or the RSI, MACD, etc. Whatever you’re most comfortable with.

When to exit
To exit, just look at the same indicators you did when you were entering the trade. In the example above where we shorted at point A, we should have closed the trade when the momentum indicator crossed above the 100 mark and the EMAs reversed their positioning. However, as you can see, if we waited until the 9-period EMA crossed the 30-period EMA to the upside, we would have lost several pips, almost half of our potential earnings. Here is where you need an additional indicator to help you make the decision.
In my case, I used the support and resistance levels from the H4 charts, but you see that oscillators like the stochastic would also show the same thing. So, to exit a trade, just reverse all observations by the 3 main indicators and find confirmation through a 4th extra indicator.
A few things to keep in mind
This one requires patience
DeMark didn’t create his trading systems for scalpers, he was more of a swing trader, and his methods are most effective this way. I suppose you could try to use this trading system for scalping, but it won’t be effective. On shorter timeframes, markets are crazier, and that breaks patterns too often to establish clear trendlines. So, remember to be patient while trading with this system, both in the entries and exits.
Learn the principles
Using this trading system will require more than just downloading indicators and waiting for a trading opportunity to come to you as most other trading systems require. This one requires that you know how the necessary indicators should be drawn onto Forex charts online so that you’re not looking at the wrong information.
Since trend lines are key, learn how to draw trend lines well, then move on to the others like pivot points (Pivot points strategy). Without a proper understanding of these, you will often find yourself getting into trades either too early or too late. However, I understand that you need to be fast to react while trading, and drawing trend lines can take a lot of time, so there’s an indicator attached at the bottom of this page that will automatically add the trend lines for you. Just don’t forget to learn how to do it yourself.
Don’t make the trend lines too steep
The problem with overly steep trend lines is that they obscure the majority of the trading window, and you’re not able to see more of the trend. If you can’t see a significant portion of the trend, you will be more inclined to draw your trend lines on less significant peaks and troughs, instead of the major ones you should be focused on. It’s also best to zoom out and find as many peaks as possible so that you can draw your trend lines accurately. This is something you’re going to understand while learning to draw trend lines.

 ColombiaUS