From the name, you can tell that this trading strategy is meant for trading trends in the markets. Trend Rider V3 trading strategy makes use of several indicators to help you, the trader, to identify entry points into long-term and short-term trends. Furthermore, you can use this trading strategy for trends that span days to those that last for a few hours or even minutes. (DeMark trend trading system)

Whatever your trading preference, you can use this trading system. As for the timeframe, it also won’t matter that much, and you can use this system on longer timeframes like 1 day and 4 hours to shorter timeframes like 15 minutes and 1 hour. There has been some success even on the 5-minute chart, but these short timeframes don’t create reliable trends, it’s best to stick to, at least, 1-hour.
Technical indicators to use
We’re going to add a few technical indicators to our Forex charts online for this system to work, and it is essential you know what each one does. When you do, you will be able to make minor changes to personalize your trading system. All of these indicators will be available for download at the bottom of the page, along with a template for the quick inclusion of all the indicators simultaneously.
Alright, that’s enough talk, let’s get into it:
Bar trend
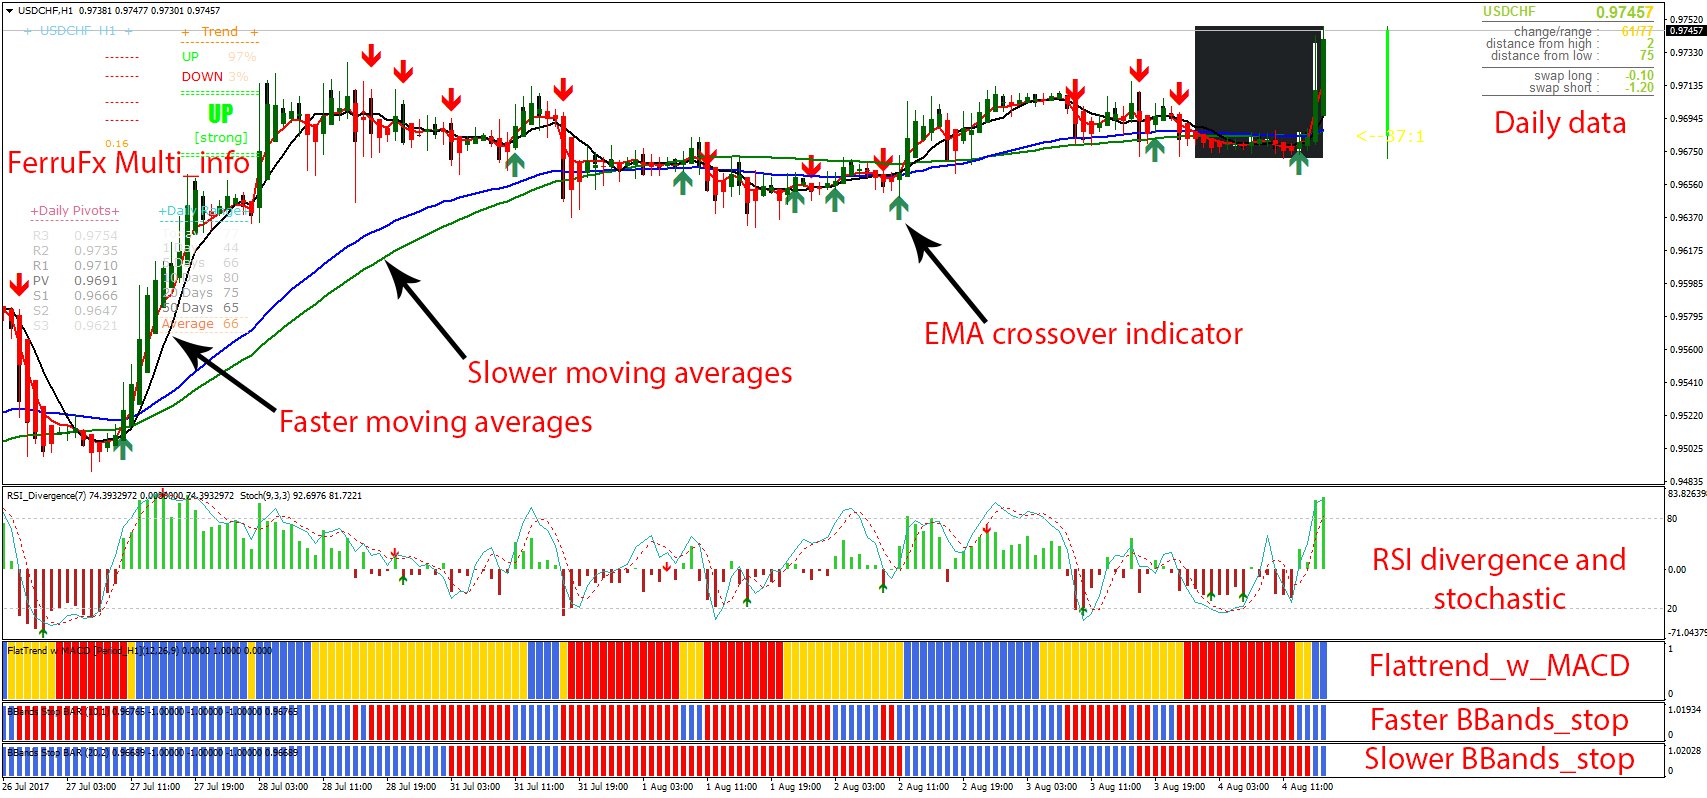
The function of this indicator is to simply paint the candlesticks over into green and purple. Green candlesticks mean that the markets are going up while purple candlesticks show a market going down. It merely provides visual cues for the trader so you know which opportunities to look for.
Moving averages
When you’re trend trading, moving averages are key, and we’re going to use several of them in this trading system. We start with the faster moving averages, and these will be the 5-period EMA and the 8-period SMA. You can choose your colors for each of the moving averages, but I selected red and black for the first two moving averages. When you load up the template attached to this trading system, you’re also going to get the same. (Forex strategy based on moving averages)
Anyway, these faster-moving averages are supposed to indicate the smallest changes in market trends. As such, they will be suitable for short-term traders. However, they also have a greater purpose – identifying entry positions. When the 5-period EMA crosses the 8-period SMA to the upside, that should be a signal of bullish momentum. So, you should look to initiate long positions. It is this cross that led to another indicator we’ll look at next.
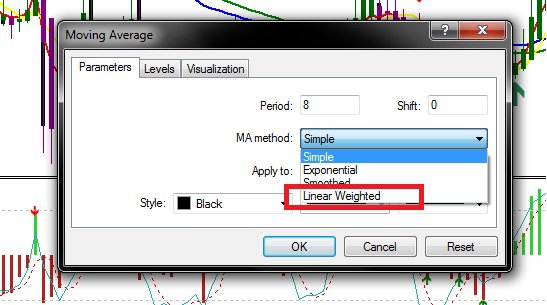
Then there are the longer-period moving averages – the 50-period EMA and the 85-period LWMA (linear weighted moving average). Changing the type of moving average on Forex trading platforms can be done when you’re adding the indicator to the main trading window from the drop-down menu shown above. These moving averages are what we use for the actual trend riding over the long term. As long as the candles remain above these two moving averages, markets remain bullish, and long positions should be taken, and vice versa.
EMA crossover indicator
When there is a cross between the 5-period EMA and the 8-period SMA, this indicator produces an arrow to tell you which direction markets are moving. You could simply observe the cross, but this indicator makes the process faster. A green arrow facing up tells you the markets are going up while a red, downward-facing arrow tells the opposite.
FerruFx Multi_info and daily data
These indicators appear on the main trading window to give extra information about the markets. The former, FerruFx_Multi_info is seen on the left side, providing information on support and resistance levels, pivot points, daily ranges, and even the strength of the current trend in percentage. It also produces an alert whenever there is a trend change. The latter, daily data is seen on the right, giving us information on swaps and ranges depending on the period you’re on. When the markets are close to the period’s high, it is unlikely that the markets will move higher for much longer, and vice versa. This lets you know if there is a possibility of a long-term trend or not. (Long-term vs. short-term trading)
There are also the clock and EJ candle time indicators which provide data on time. For different Forex trading companies, the time will matter depending on where the server is located. I chose not to include these indicators because my preferred broker is in the same time zone I’m in.
RSI divergence and stochastic oscillator
Down to the indicator windows, the first contains a custom RSI and the usual stochastic. The custom RSI has been modified to be seen in bars instead of a line, but it still has the same function. When it is green, the markets are bullish, but if it goes too high from the center, markets may be overbought and the uptrend may turn. It also produces an upward-facing or downward-facing arrow to tell when exactly the trend is turning. The stochastic oscillator adds to this effect by backing up the readings of the RSI divergence. (Best technical indicators and how to use them)
Flattrend_w_MACD and BBands_stop
These occupy the remaining three indicator windows. At the top is the Flattrend_w_MACD indicator, which is a modified MACD with better visual appeal. When the bars of this indicator are blue, markets are trending upwards, when yellow, markets are ranging and consolidating, and when red, markets are trending downwards. Important clues are found when the color changes from yellow to either red or green. During consolidation, there isn’t a dominant force, but a change in color tells you whether it is the bulls or bears that have won the struggle.
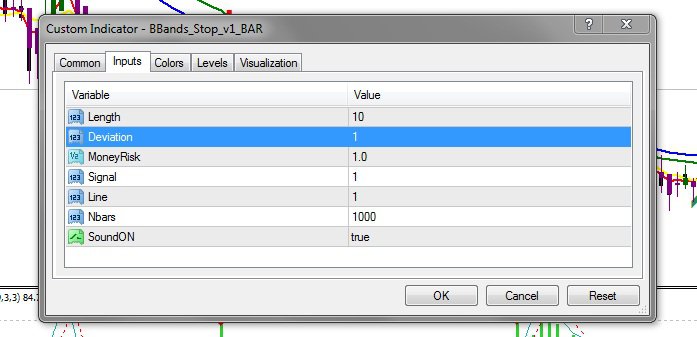
As for the BBands_stop, you will notice there are two of them in separate indicator windows. The difference between the two is in the period they use. The top BBands_stop has values of 10 and 1 under length and deviation, while the bottom’s values are 20 and 2. Therefore, the top BBands_stop reacts faster to trend changes than the bottom, as you can tell from the charts. The function of this indicator is to track short-term and long-term trends.
The slower BBands_stop traces long-term trends and the faster one, short-term trends. For example, when the top BBands_stop turns red, a short-term uptrend may be coming to an end, but as long as the bottom BBands_stop is still green, you can hold on to a long position because the uptrend is not over.
Final Thoughts
Now that we have unpacked all the indicators in this trading system, it’s time to see how they all work together. Remember, this Trend Rider V3 system works by combining all the signals from the indicators to deliver an accurate prediction. Let’s take a look at an example:
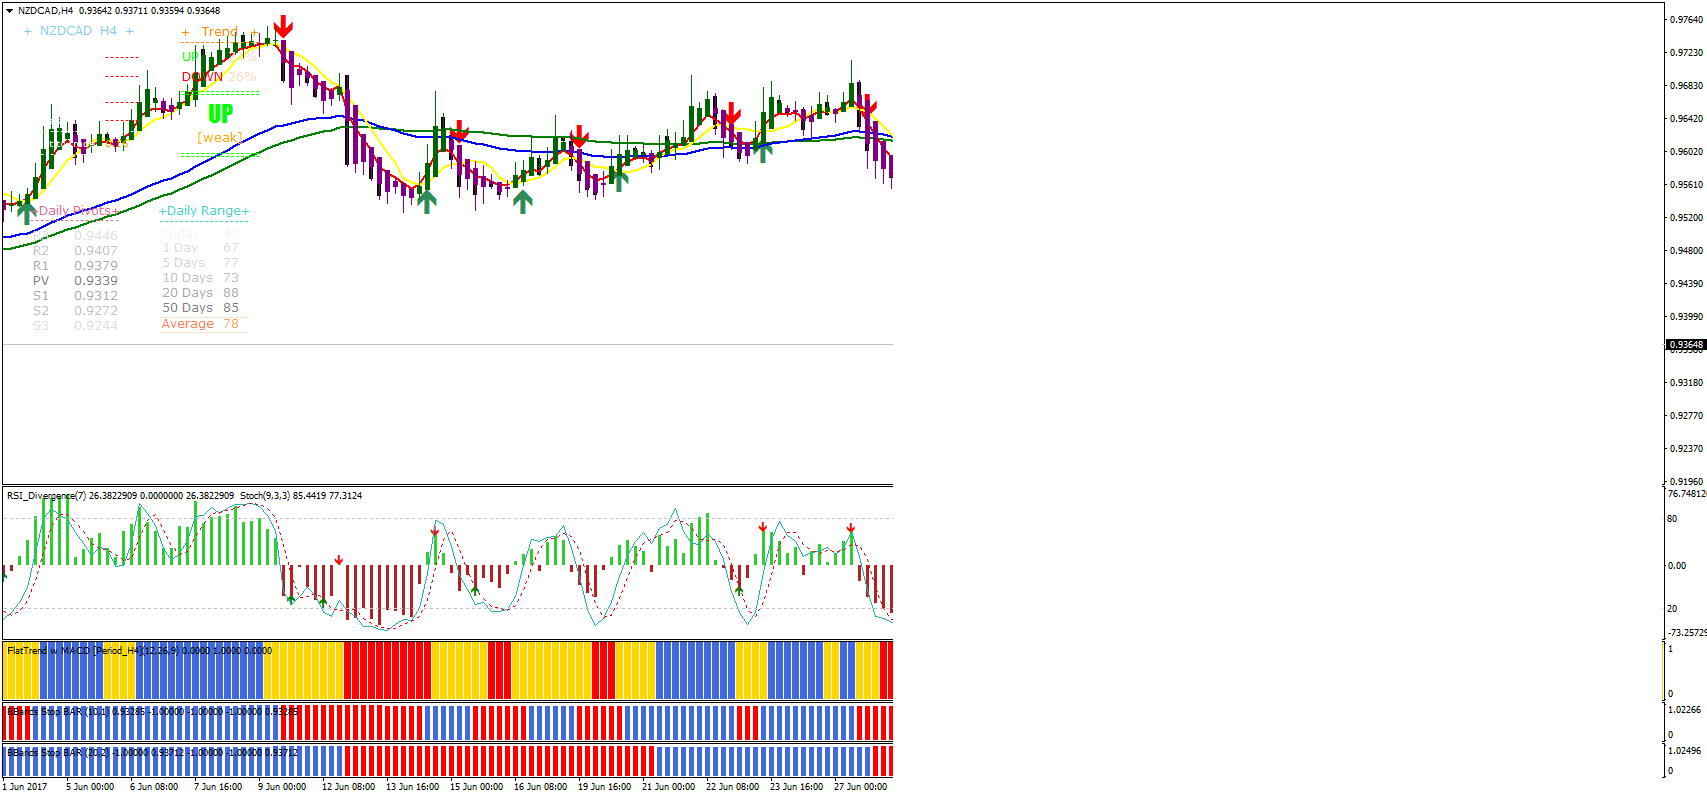
This image represents the NZD/CAD pair on the 4-hour chart, and there’s a selling opportunity. The first signal comes from the bar trend indicator, which turns the candlesticks purple to show bearish momentum. The EMA crossover indicator also produces a red downward-facing arrow when the 5-period EMA crosses the 8-period SMA downwards, another sign of bearish momentum. The RSI divergence produces a red arrow too while in overbought territory, and so does the stochastic indicator. On the indicator window, the Flattrend_w_MACD changes from yellow to red bars, again showing a selling opportunity.
At this time, it’s clear that the market prices are going down and that we should sell. You could open a short position at this time if you wanted, and you would probably enjoy some pips. However, these are all short-term indications, but this system is more about long-term trends, and that’s where the BBands_stop indicator comes in. The top BBands indicator is also short-term, but when the lower BBands indicator turns red, then we know we have a very strong downtrend.
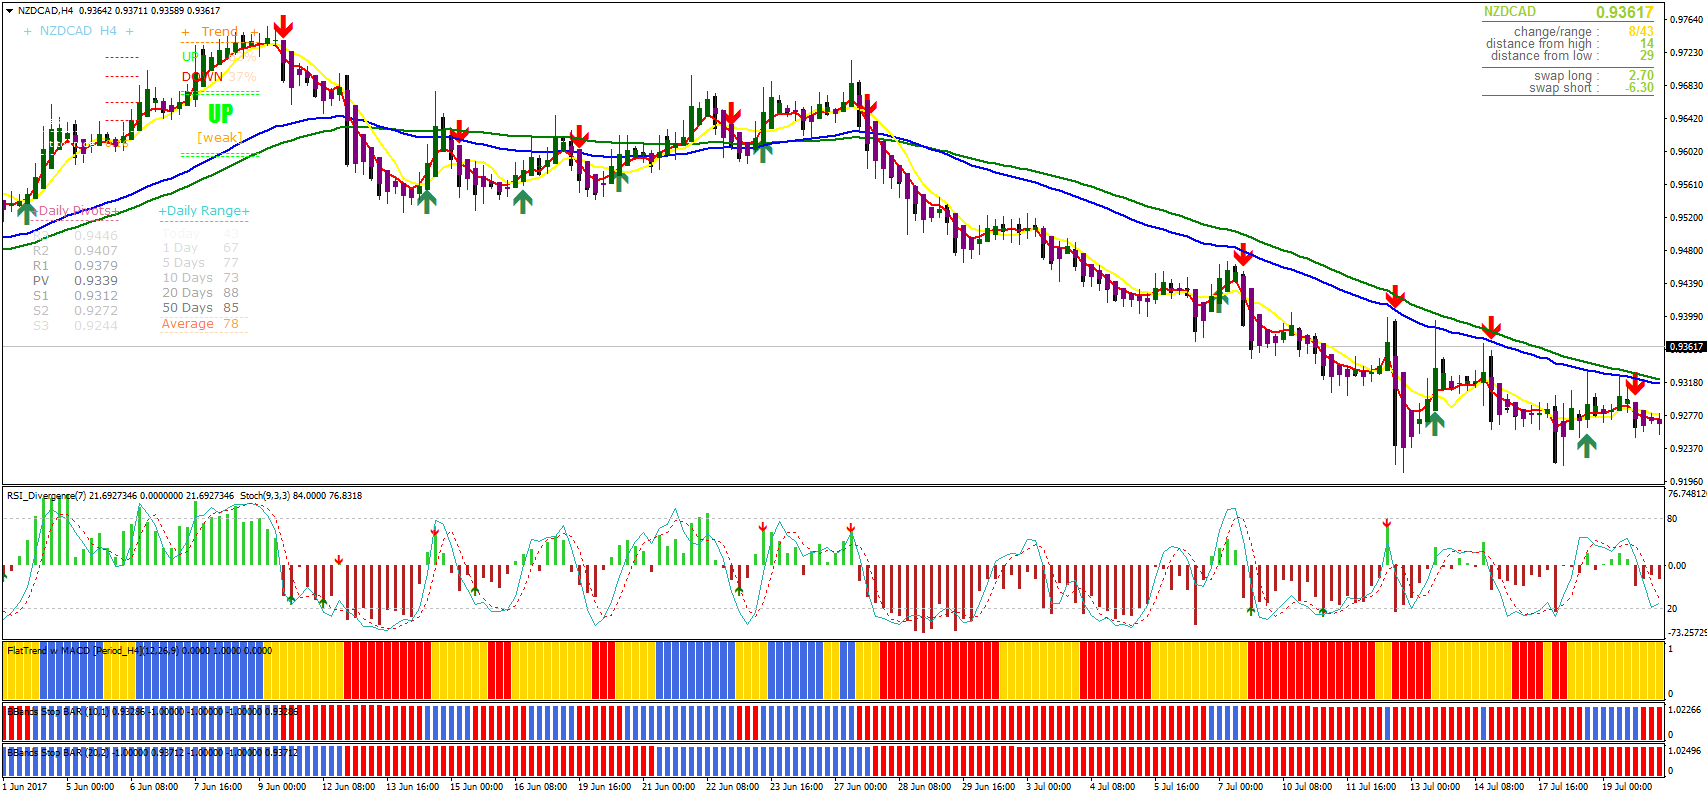
Now, if we had shorted the markets at the previous point, there would have been a lot of pips to collect. We also see how the long-term trend was followed by the longer period BBands indicator at the bottom, despite several short-term uptrends.
In case you’re wondering why I haven’t mentioned the daily data and FerruFx indicator, that’s because they show the latest data, and this is an example from 2 weeks ago. Nevertheless, at the time, all the indicators had fallen into place to provide an excellent trading opportunity.
When you’re trading in an uptrend, just reverse the signals from the example above and you will still see the same results.
If you don’t know how to add the necessary indicators to your MT4 platform, here’s a short video showing you how to do so:
