 Alpari
 XM
XMWe’re not talking about the shampoo here, although this strategy draws some inspiration from the idea. The head and shoulder (H&S) pattern in financial markets is considered one of the most reliable chart patterns. Stock traders have used it for decades, and we too can apply the principle in Forex trading.
Identifying the head and shoulder pattern
The identifying characteristics of the H&S pattern are the three peaks formed in Forex charts online. The name is assigned because these peaks form something of a person’s silhouette with the central peak towering above the other two – like your head above your shoulders. A typical formation of the H&Ss pattern ought to look like this:
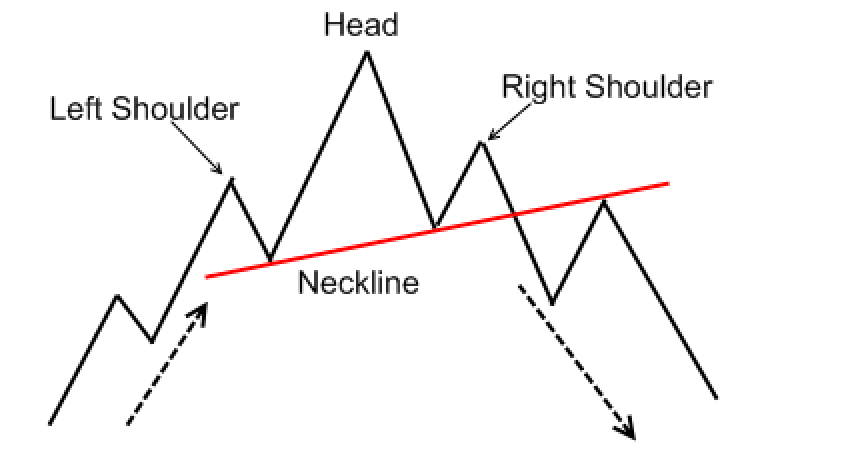
You can see how the first peak (the left shoulder) is followed by a second higher peak, then the third peak is again lower. Whenever you see such a pattern, know that the markets are in an H&S pattern. However, we all know that the markets don’t always form perfect patterns like this. Instead, the pattern is more likely to appear like this on the Forex trading platforms:
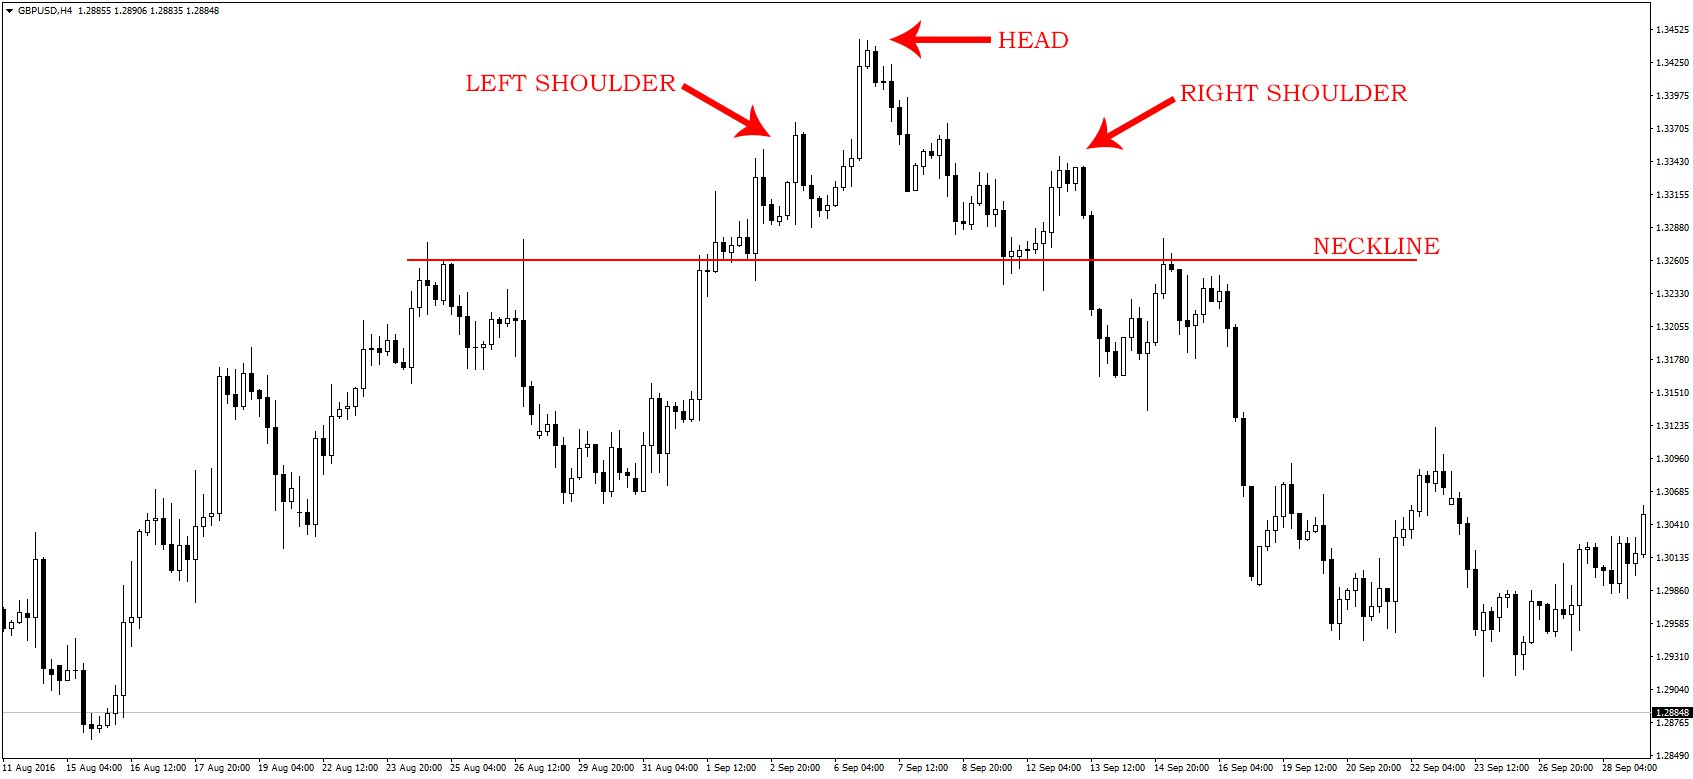
In real markets, it doesn’t appear as in the previous image, but the pattern is still clear. It can also appear in an inverted manner like so:
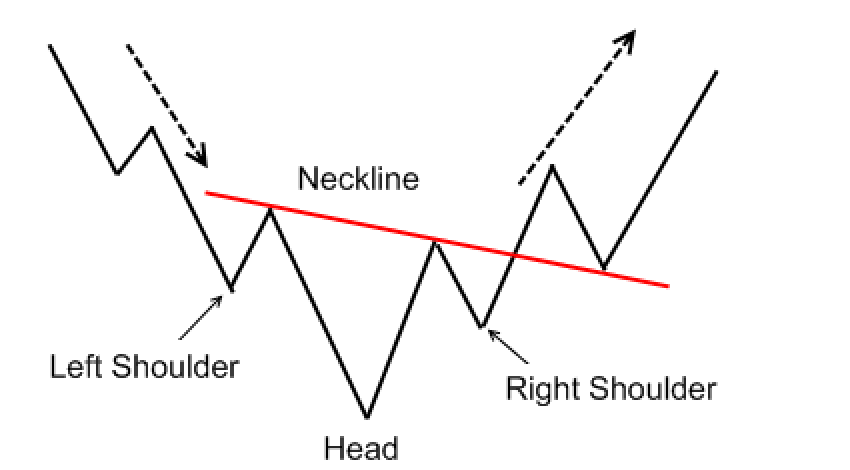
Once you can identify the ‘normal’ H&S pattern, the inverted one should not be a problem either.
What does the head and shoulders pattern mean?
Now that you can see the H&S pattern, what does it mean in the markets? Well, it usually signifies a trend reversal, especially after a strong uptrend (for a typical pattern) or downtrend (for the inverted pattern). Let’s look at an example uptrend where the pattern was formed:
Here, we see that the markets were in an uptrend, which can even be confirmed by the trend lines. When the price fell out of the trend, though, after the second peak (the head), this was a sign of a trend reversal. The third peak was formed as the bulls tried to push prices back up, but they were not enough, so prices kept going down. This hypothesis can always be confirmed by looking at the trading volume during the pattern formation:
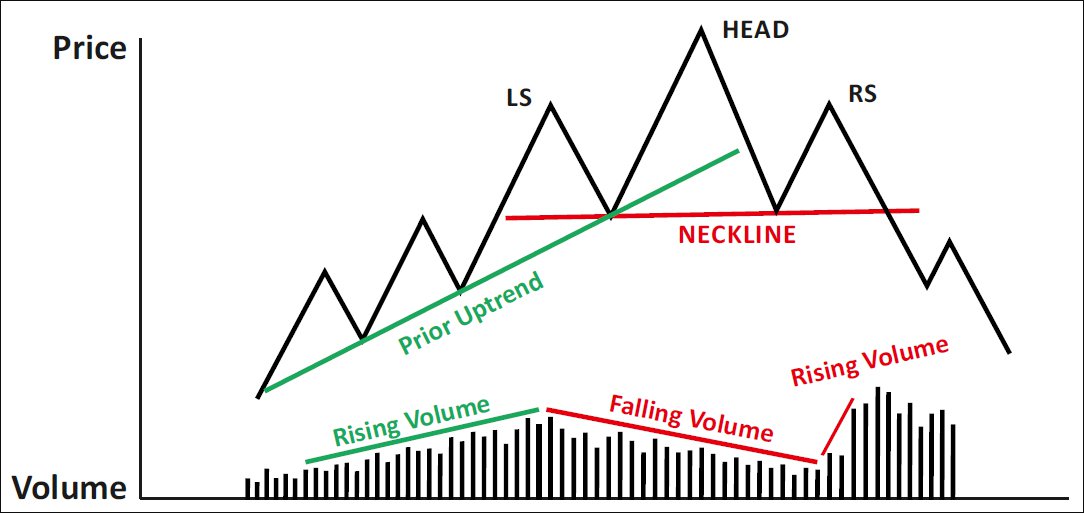
The bulls had kept markets in an uptrend by creating a lot of market volume, but after the left shoulder, market volume dwindled. At this point, the bulls had either started to run out of buying power or were covering their positions. The head is created when the last remaining bulls try to push the markets higher, but it’s not enough to push prices up. Trading volume again starts to rise, but this time it’s the bears in control, a clear signal of a downtrend.
You see, it is possible to determine market sentiment just by watching the chart patterns.
Trading the head and shoulder pattern
We know that this pattern signals a trend reversal, now it’s time to see how we can turn it into a profit. In this post, we’re going to be using the typical H&S pattern, with the head at the top. Just remember that the situation can be reversed; the same rules will apply, only the opposite:
When to enter a trade
For the pattern to form, it means that you will usually be getting in on the trade after the right shoulder. In this case, you want to enter your short position at the neckline so that you catch the downtrend. There are 2 ways to do this, aggressive or conservative.
For the aggressive trader, enter a short position as soon as the prices break below the neckline. The advantage of this is that you can catch the entire trend since you have entered the markets earliest. The downside is that markets will often test the neckline before going on down. Take this example:
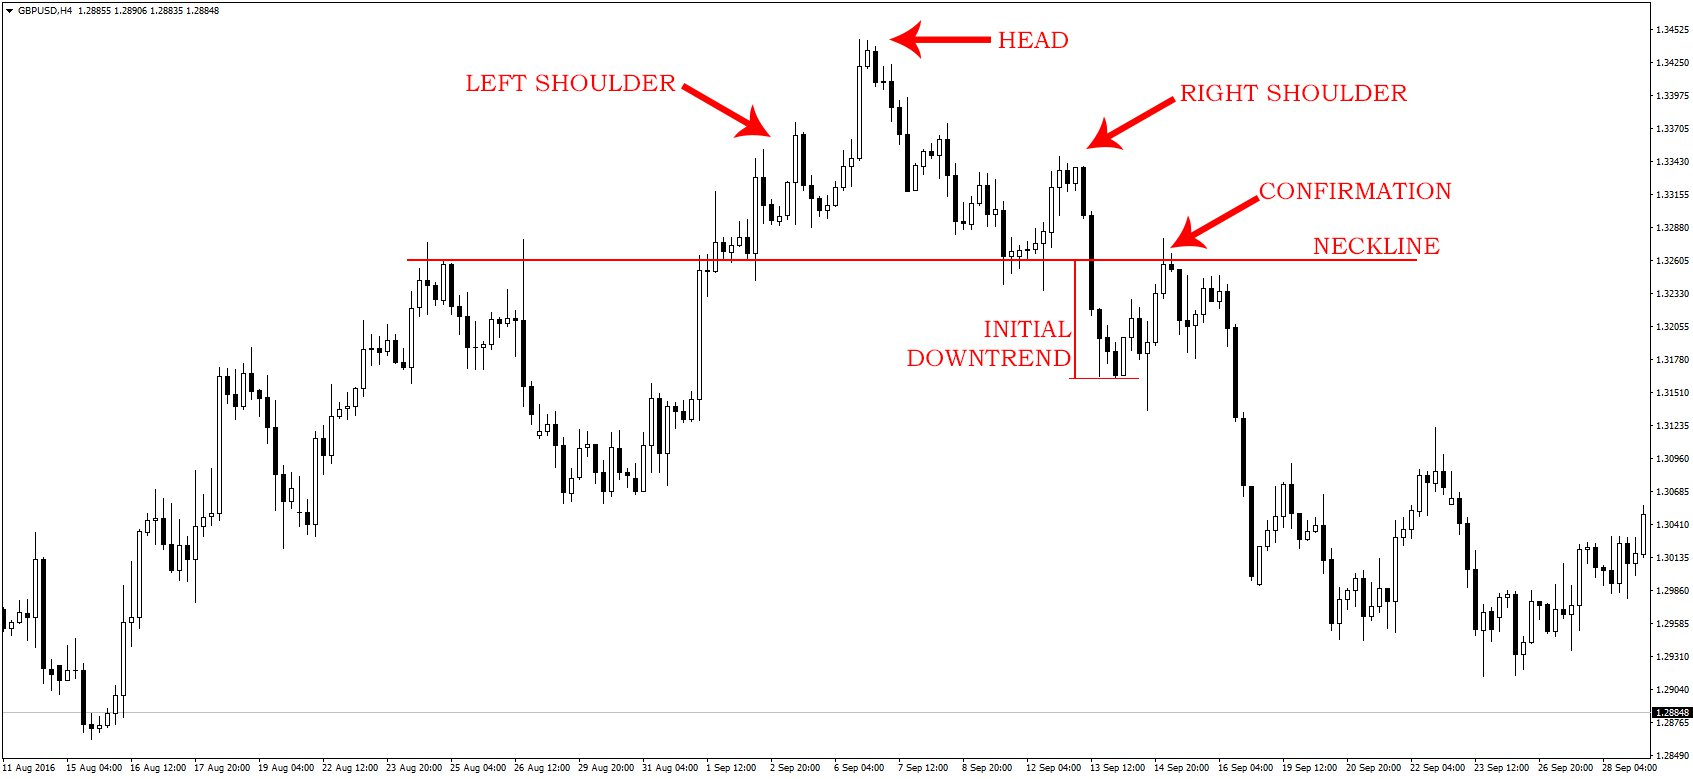
We see that the aggressive trader would have caught the initial downtrend, but the markets came back up to retest the neckline. After this retest, the neckline is confirmed as a resistance level, and the downtrend begins. A conservative trader would have waited for the confirmation, and would not have had to panic. Again, this doesn’t always happen, sometimes the markets break below the neckline and just keep going. In these cases, the aggressive trader would be better off.
So, to enter a trade using this strategy, the best way is to enter a trade after the markets have moved slightly below the neckline. If you don’t have the time to wait and watch, place a sell-stop order a few pips below the neckline. This way, you avoid too much of a drawdown while still catching most of the trend.
Also, remember to place a stop loss a few pips above the neckline just in case the pattern is broken. It happens sometimes, just like this:
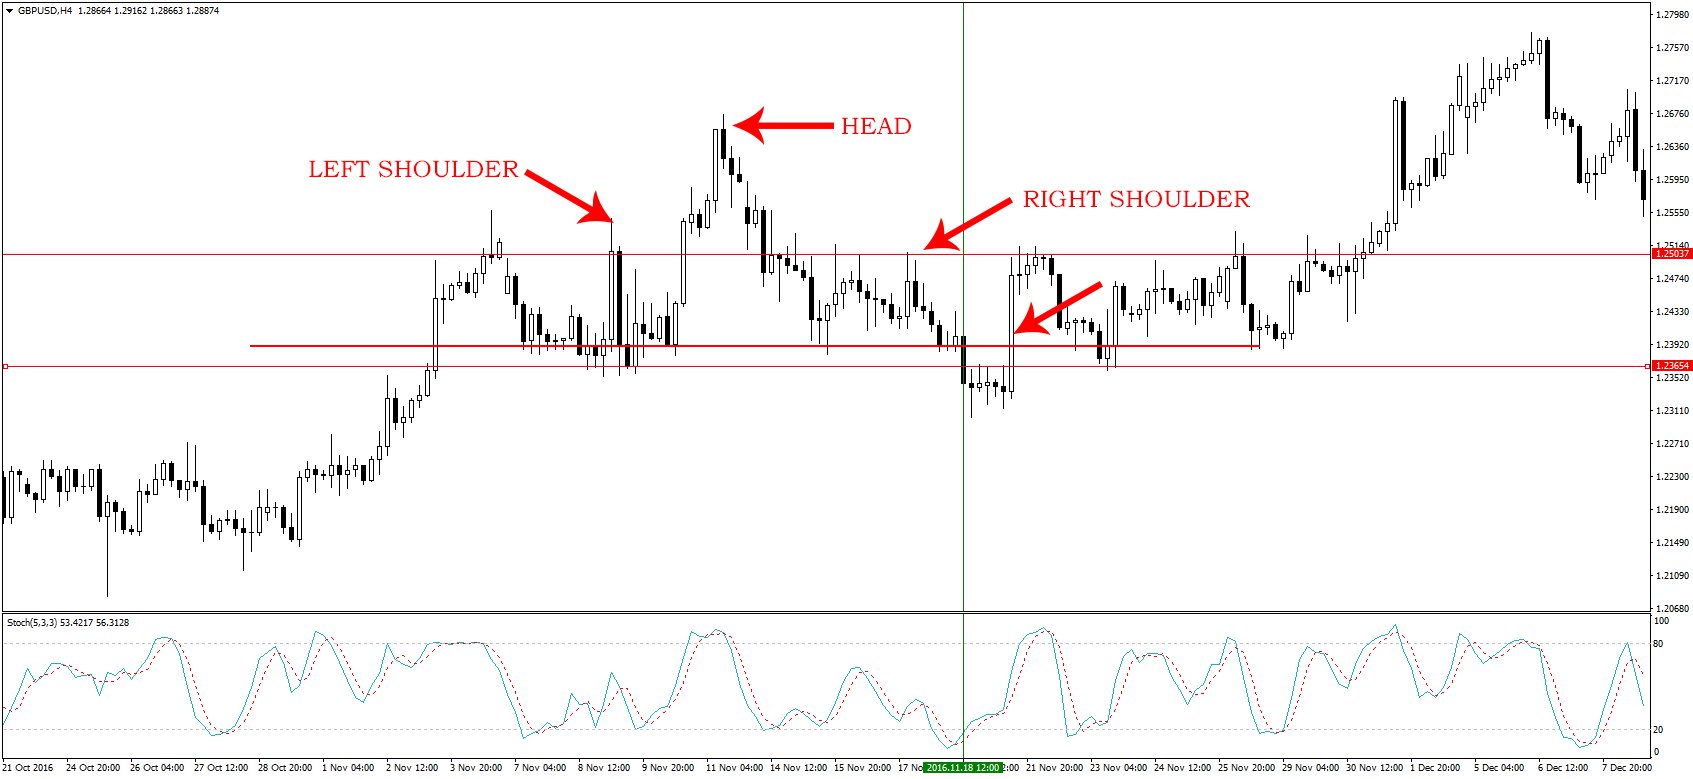
Here, it seemed like the H&S pattern was complete, but instead, the price broke above the neckline and eventually resumed the uptrend. This is why you should wait until markets are several pips below the neckline, and why you should always use a stop loss. In this case, there was probably some news on the Forex calendar, which caused the reversal, so just keep this in mind. (Risk-management on Forex)
When to close the position
Trend reversals can be very strong, accumulating thousands of pips. Here, there is no exact formula on which the best time is to close the position, and it will come down to your trading strategy. (How to choose a trading strategy?)
There are a few guidelines I can provide though to help you maximize your profits; all you need to do is remember what successful traders do – let winning trades run. Do not be in a hurry to close the trade after a few profits, make sure you follow the trend to the end. Two ways to do this can be through a trailing stop, or manually adjusting your stop loss. The key is to hang on to the trade as long as possible.
Benefits of using the head and shoulder pattern
I mentioned before that this chart pattern is very popular, and the main reason is that it is applicable in every market. Whether it’s the stock, commodities, or forex market, it will always signify a trend reversal. Furthermore, you can use it at any timeframe. It is so versatile because it just shows what the major players in the markets are thinking, so it isn’t susceptible to other forces.