 Alpari
 XM
XMTechnical analysis is all about trying to make sense of the markets and trying to establish patterns, which can be used to predict future movement. There are many tools used in technical analysis to try and do just that, but other experts believe it can’t be done. For example, a book titled A Random Walk Down Wall Street claimed that trading the stock market was akin to throwing a dart or tossing a coin.
Contrary to this belief, we have seen many successful traders determining patterns in the market, and one of them is Bill Williams. Williams has been responsible for creating numerous technical analysis tools that have been very effective in the stock, commodity, and Forex markets. In this post, we’re going to look at one of his most effective strategies, this one based on fractals. (How to choose a trading strategy?)
Introduction to fractals
This whole idea is not new, since it was discovered back in the 17th century. The theory of fractals states that every shape is just a reduced copy of the whole. By applying this theory, Williams was able to observe how tiny patterns in the markets represented a fraction of the whole. It is from this idea that he generated the trading strategy based on the fractals theory. Since then, the strategy has been used by major players in the stock commodity and Forex markets with great success.
Application of fractals in Forex trading
In the Forex market, fractals are determined by 5 or more candles in a particular pattern. If the central candle represents an extreme to the candles around it, that is a pattern. Let’s look at the images below which represent the most basic form of the pattern.
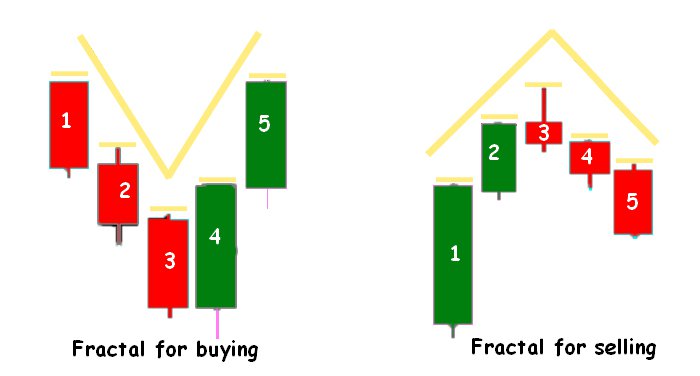
The illustration on the left represents a bullish fractal because the central candle (3) is the extreme case compared to the two on either its side. You can see that the central candle makes the lowest low while the others form higher lows. The illustration on the right is the opposite, with the central candle making the highest high and the rest making lower highs.
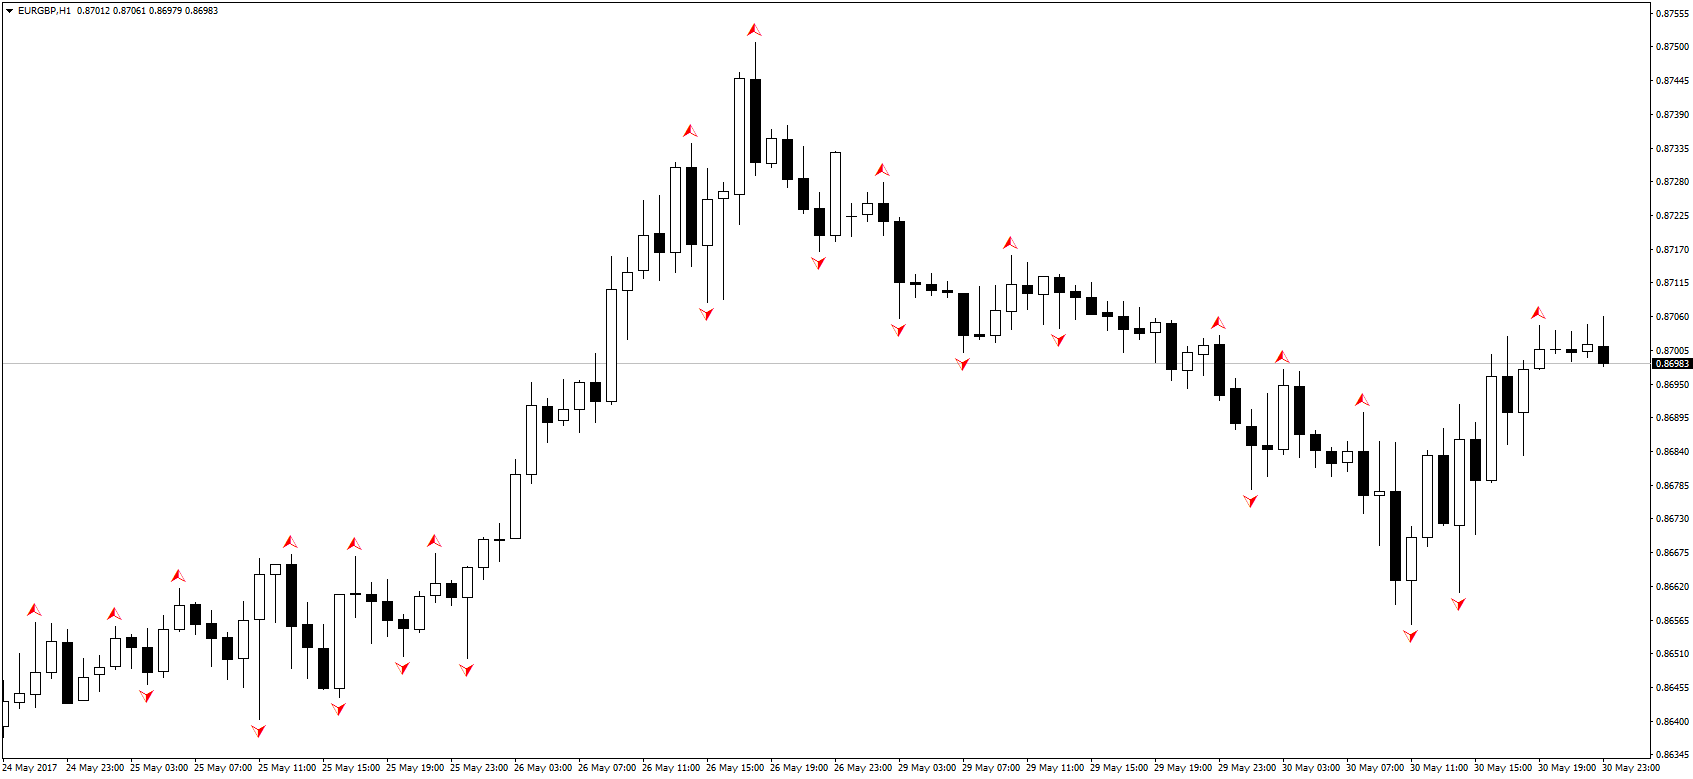
On the real-time Forex charts, you can identify the fractals in the image below:
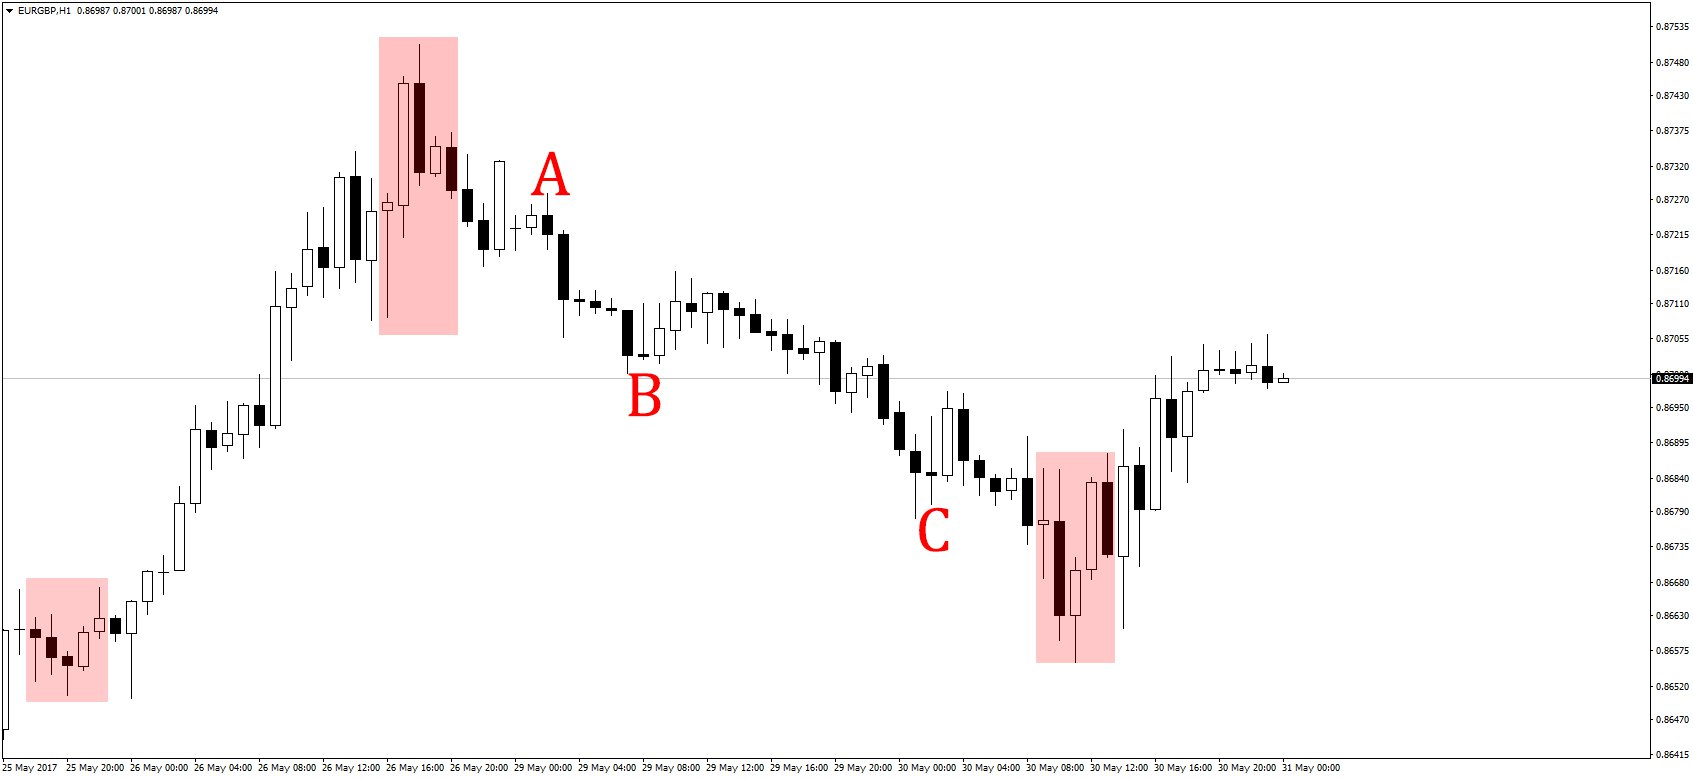
Once the fractals formed, a strong trend followed, showing that the fractals indeed showed a change in trend. You can see how the bullish fractal on the left was a strong signal to buy, and so was the one on the right. In the middle was a bearish fractal, which led to a strong downtrend, which would have earned you more than a few pips.
However, if you’re going to make use of the fractals trading strategy, you will need more than just an understanding of the principle of fractals. In the above image, there were three points – A, B, and C where it seemed like the trend would reverse, but it didn’t. In these cases, you would have lost money from the false fractals. To avoid this, Williams came up with a complimentary indicator, Alligator. With both the fractals and alligator indicators, the chart now looks something like this:
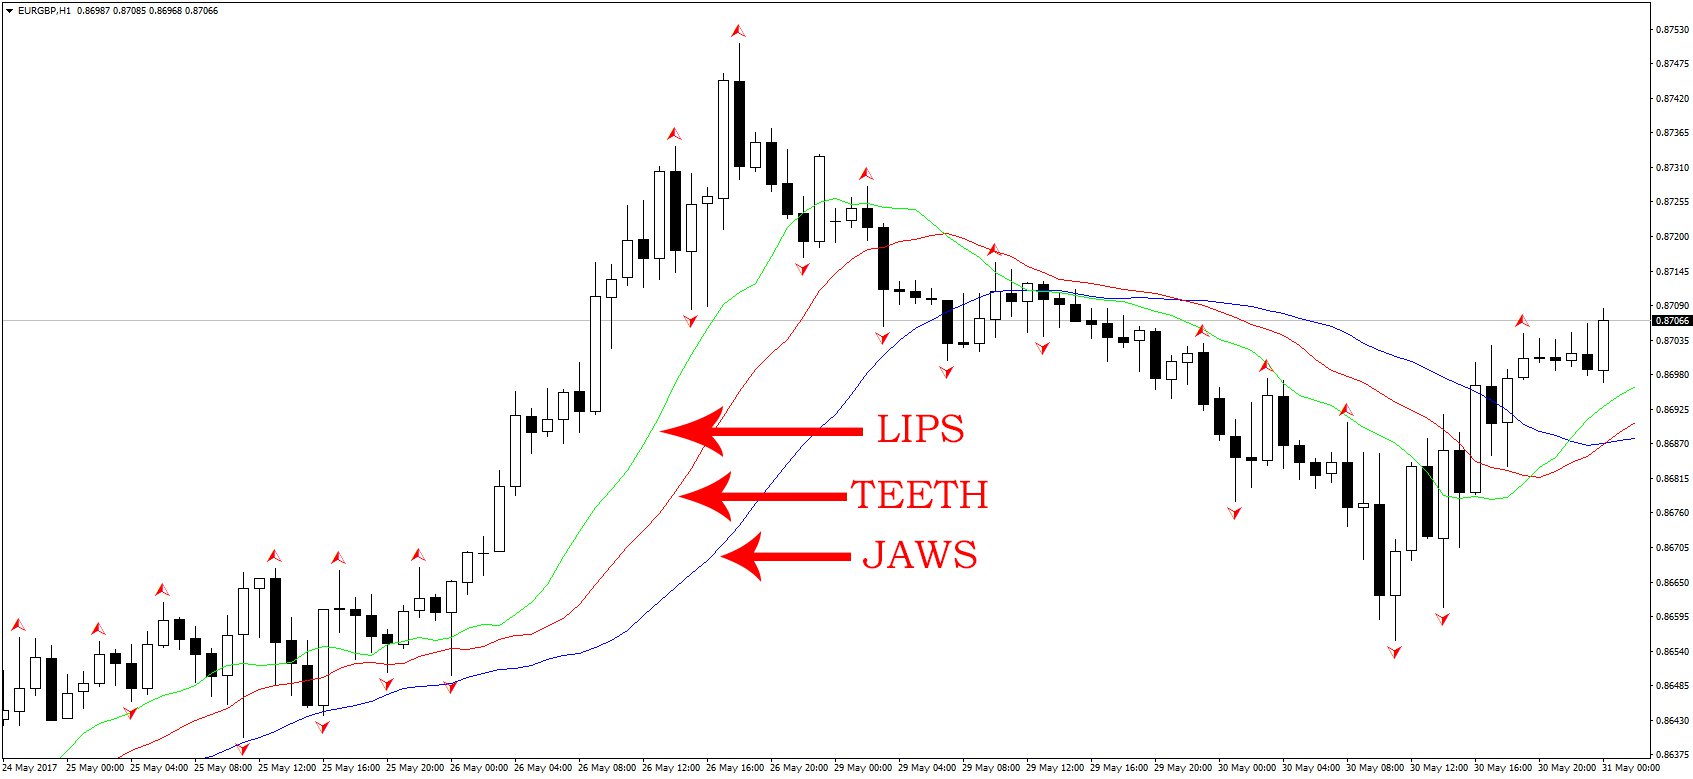
The alligator indicator shows buying opportunities when the price is trending above the red line and vice versa. With this complimentary indicator included, it helps to avoid fake-outs by determining market sentiment and ensuring more reliable trading opportunities.
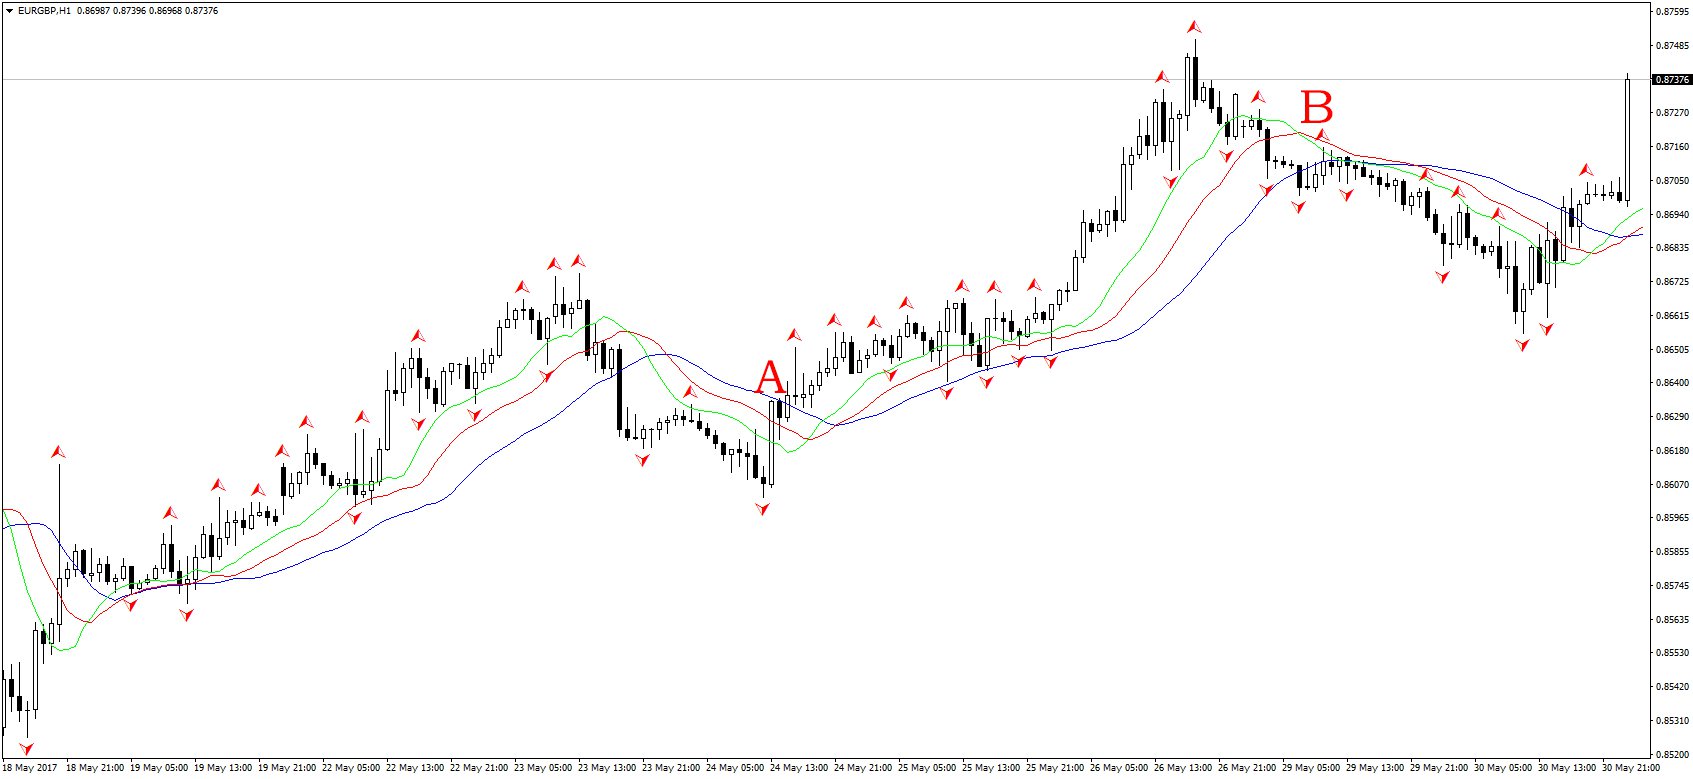
In the above image, an ideal position to enter a long position would have been at point A when the fractals showed upward momentum and price crossed above the teeth of the alligator. Despite several bearish fractals along the way, the price stayed consistently above the teeth, showing that there was still bullish momentum. When the price finally broke below the lips and teeth of the alligator, this would have been a sign of a trend reversal. At point B, the bearish fractal would be useful because the price went under the teeth.
Now we know to apply fractals along with a complimentary indicator, like the alligator, but you can use other oscillators as well. Williams also emphasized on fundamental analysis when using fractals, since these events can alter fractals and shift trends. Therefore, when using the fractals strategy, do not forget to keep an eye on the economic calendar Forex. (See the main central bank meetings to watch)
Why using the fractals strategy can be good for you
I’ve already mentioned that big investors use fractals in their technical analysis, but if you’re wondering why it’s so popular, here are a few reasons:
It works on all timeframes
Unlike other technical indicators (Uncommon technical indicators) that only work best on certain timeframes, you can use this one on any timeframe you prefer based on your trading strategy. This is because this theory is derived from the fractals theory, which takes a small sample and extrapolates it to a larger area. As such, it doesn’t matter how small a timeframe you’re using, the pattern will always be there. Just like fractals appear in nature from flowers to entire landscapes.
However, you should be careful when using fractals on lower timeframes because you can find false fractals here. In shorter timeframes, patterns are not as clear as in longer timeframes, and you should take special care in risk management to avoid too many losses.
The delay in establishing fractals helps to reduce fake-outs
For a fractal to be established, at least two candles have to be formed after the central candle. This causes a delay that could potentially lose you a few pips as the trend is starting to form, but it also prevents you from making rushed decisions. When fractals are used properly and backed by secondary technical indicators, you can reduce the number of losing trades you experience and increase your profits. (Best technical indicators and how to use them)
The MetaTrader platform provides you with automatic fractals
Isn’t it nice when you have all the work done for you? Thankfully, Bill Williams’ trading strategies were so effective and popular even among Forex brokers that they are included in most Forex trading platforms by default. On MT4, you can find the fractals indicator by going to the menu bar, clicking on ‘Insert’, moving down to ‘Indicators’, then ‘Bill Williams’, and clicking on ‘Fractals’.
Once loaded, your chart should look like this:
The platform does all the work for you so all you have to do is just make a decision based on what the fractal is indicating.