 Alpari
 XM
XMWhat is Trend Trading?
If you're familiar with Forex trading, you've probably heard the saying, "The trend is your friend." This classic advice is foundational, yet it's just the beginning. While following trends can be a reliable strategy, it's crucial to remember that trends can suddenly fade, potentially leaving you in a tricky spot.
You might be wondering: How do you effectively identify and capitalize on Forex trend movements? What are the strategies to gauge their direction and momentum? Don't worry, we've got you covered.
In this article, we'll dive deep into the world of Forex trend trading. We'll explore strategies, indicators, and practical examples to help you master trend trading in any market condition and predict when a trend might reverse.
An important aspect of trend trading is understanding the role of time frames. Long-term traders focus on larger time frames, while intraday traders pay more attention to shorter ones. This leads to three main styles of trend trading: intraday, swing, and position trading.
Our comprehensive guide is designed to give you a thorough understanding of trend trading. You'll learn how to spot the beginning of a trend and, crucially, how to detect when it's about to change direction.
We have an extensive collection of Forex trend trading strategies for you. Whether you're looking for the thrill of breakout strategies or the finesse of smoothly riding a trend, we have options for every market scenario and risk tolerance. Get ready to unlock the potential of Forex trends with a variety of tools at your disposal!
trend trading BROKEN DOWN
Trend trading is a strategy that aims to capture gains by riding the momentum of an asset whether that direction is up or down. Think of Forex trend trading as embracing the path of least resistance.
When the market price has an overall upward trajectory, that is called an uptrend or bullish trend and traders take a long position to seize the opportunity. Conversely, when the market price has an overall downward trajectory, that is called a downtrend or a bearish trend and traders take a short position to seize the opportunity.
It's all about aligning yourself with the prevailing trend and following that trajectory. Consult the NordFX Trading Platforms and Tools Analysis if you're interested in trend trading.
#1 The Difference between Trend Trading and Trend Following
While trend trading and trend following are often used interchangeably, there's a subtle distinction. Trend following entails riding the entire primary trend from its inception to its culmination without actively seeking out opportunities within smaller oscillations.
Trends are not a monolithic force, they have different dimensions:
-
We have the primary trend, which encapsulates the grand, overarching movement over the long haul.
-
We also have those secondary trends, shorter-term fluctuations that are smaller swing waves and shorter in duration.
Whether you’re a Forex trend trader who chooses to ride the grand waves of the primary trend or indulge in the exhilarating dance of the smaller trend oscillations, trend trading opens up a realm of opportunities for those bold enough to seize them.
#2 How to Identify the Direction of a Trend?
When it comes to identifying the direction of a trend and trading the trends, a commonly employed method is the use of trendlines. These simple lines, drawn onto a price chart, can provide valuable insights into the market's trajectory by connecting significant lows during an uptrend and significant highs during a downtrend.
Essentially, there are three primary types of trends:
-
Uptrends: We look for a pattern of higher highs (HH) and higher lows (HL) as time progresses. This upward trajectory signifies a market in which prices reach greater peaks with each cycle, while the subsequent troughs exhibit higher lows, indicating a consistent upward momentum. To identify an uptrend, one connects two low points on a chart, by drawing a line that slopes upward; we can confirm the presence of an "uptrend."
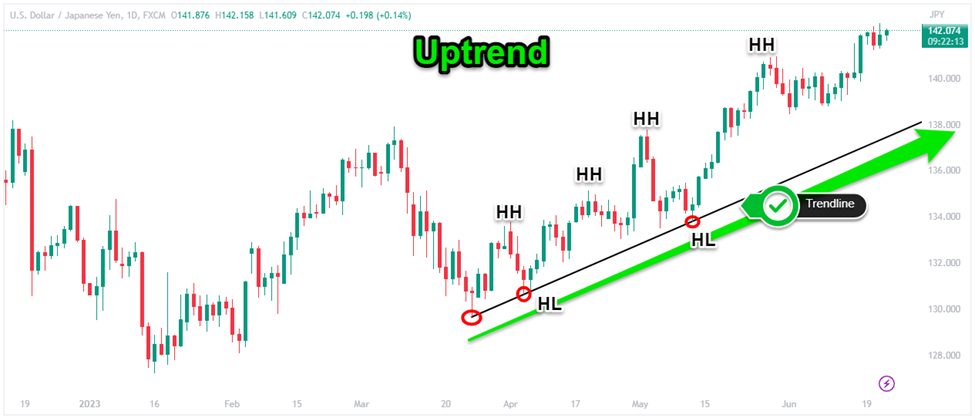
Source: TradingView USDJPY Daily Uptrend
-
Downtrends: Conversely, a downtrend is identified by observing lower highs (LH) and lower lows (LL) over time. This downward pattern illustrates a market characterized by diminishing peaks with each cycle, accompanied by lower lows, illustrating a sustained downward momentum. If connect two highs on a price chart and the resulting line slopes downward, we have ourselves a "downtrend."

Source: TradingView USDCAD Downtrend
-
Sideways trends: Also known as a horizontal or range-bound market, represents a phase in the financial markets where the price of a currency pair oscillates within a defined upper and lower boundary. This creates a horizontal band on the price chart, with prices experiencing recurrent fluctuations within this range. Sideway trends emerge as a consequence of relatively low volatility and a balance between supply and demand in the market. Consequently, this type of market movement presents a neutral risk environment for traders.

Source: TradingView USDCAD Daily chart
#3 How to Identify the Strength of the Trend
Before you learn how to trade with the trend, you need to know how to identify the strength of a trend.
In the realm of technical analysis, there exists a common misconception among traders that support and resistance levels grow stronger with each subsequent retest but this notion is completely unfounded and can be quite costly.
Consider this: if it were true that a level gains strength with each retest, it would theoretically never break. Why would it break on the sixth retest if it managed to hold strong on the third when it was supposedly half as strong?
The logic simply does not add up.
To gauge the strength of a trend, we turn to the relationship between highs and lows and our key levels. Let's take a look at an illustrative example of a trending market that respects a trend line, but where the distance between each retest diminishes over time. Also, user experience it's important to identify the strength of the trend so, we recommend you check our user experience with ActivTrades Broker.
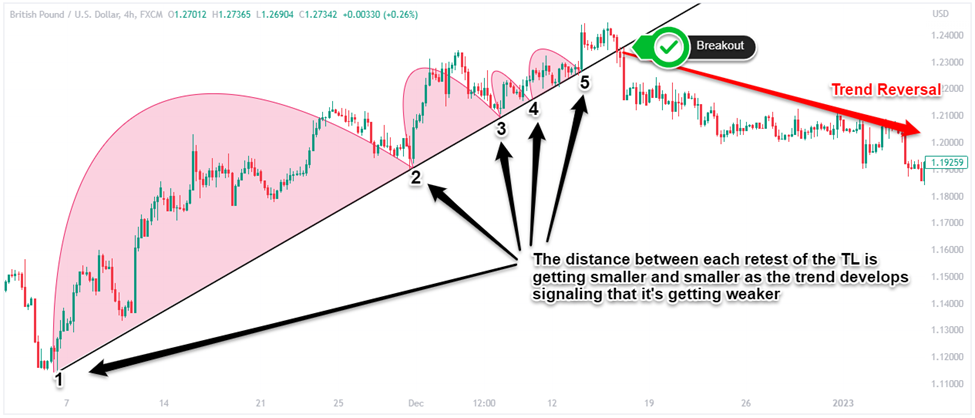 Source: Tradingview GBPUSD 4-Hour Chart
In simple terms, it is the market's way of signaling that demand diminishing. As prices climb higher, demand naturally wanes, as traders become less willing to buy at elevated prices. Simultaneously, supply increases as market participants unwind their positions to secure profits.
In the illustrated examples, the drying up of demand becomes evident with each subsequent rally from trend line support. Consequently, the market spends more time struggling to sustain its upward momentum rather than achieving higher highs.
Of course, this concept applies to bearish trends as well, where demand rises and supply diminishes as prices decline.
#4 How to Identify the End of a Trend?
The most evident signal that a trend is about to end and reverse course is when the price of the asset begins a sustained movement in the opposite direction. Typically, these reversals manifest themselves at critical points of support or resistance on the price chart.
According to the dynamics of Newton's law of motion just as an object in motion tends to stay in motion until acted upon by an external force, a trend persists until it encounters a catalyst that brings about a reversal.
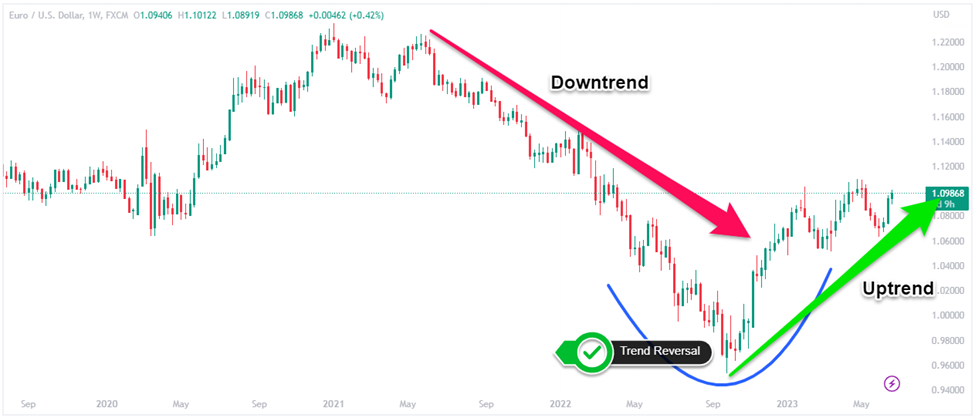
Source: TradingView EURUSD Trend Reversal
However, it's vital to exercise caution and differentiate between a genuine trend reversal and a temporary retracement. Prematurely exiting a trade based on a temporary pullback can hinder potential profits. To address this, traders often utilize technical indicators, such as Fibonacci retracements, to assess whether a market is merely retracing within the overall trend or undergoing a true reversal.
Forex Trend Trading Strategies
Forex trend trading strategies serve as invaluable blueprints, guiding traders on how and when to engage in the market. These strategies revolve around the fundamental objective of identifying the beginning of trends, confirming their validity, and skillfully exiting positions before the trend undergoes a reversal.
When it comes to formulating these strategies, traders typically draw upon the realms of technical analysis, leveraging indicators and studying price action, or delve into the depths of fundamental analysis. Don't miss to check out our in-depth Exness Broker Analysis.
Some traders even adopt a hybrid approach, merging elements from both technical analysis and fundamental analysis to enhance their decision-making process.
Some of the most popular Forex trend trading strategies is:
-
200-day Moving average
-
Pullback trading
-
Range Trading
-
Breakout trading
-
Macro trading
200-day Moving Average Strategy
The 200-day Moving Average (MA) stands as a widely employed trend trading strategy, offering valuable insights into the long-term market direction of currency pairs.
When the price of a currency pair trades above the 200-day MA, it generally indicates an uptrend. Conversely, if the price falls below the 200-day MA, it signifies a downtrend. This simple yet powerful concept allows traders to gauge the overall market bias and market sentiment and adjust their trading strategies accordingly.
The 200-day MA acts as a support level during uptrends and a resistance level during downtrends.

Source: TradingView EURUSD Daily Chart
Pullback Trading Strategy
The pullback trading strategy work in markets characterized by trends that exhibits intermittent bursts of momentum, intermingled with brief countertrend movements.
In the Elliott Wave theory, the swing waves that move in the direction of the dominant trend are called impulse waves, while the swing waves that move in the opposite direction of the trend are called corrective waves.
In essence, pullback trading capitalizes on the temporary shifts in direction that occur within an ongoing trend. Trend traders strategically enter the market during these retracement phases (corrective waves), leveraging more favorable prices to align themselves with the dominant trend's momentum. (Check out: XM Broker Leverage and Forex Spreads Overview)
Traders rely on various tools, such as:
-
trendlines,
-
candlestick patterns,
-
or oscillators,
Which aids in distinguishing retracements from full trend reversal.
To safeguard against potential losses, traders prudently attach stop-loss orders to their positions. These orders act as safety nets, automatically closing the position if the price moves against their expectations beyond a predetermined threshold.
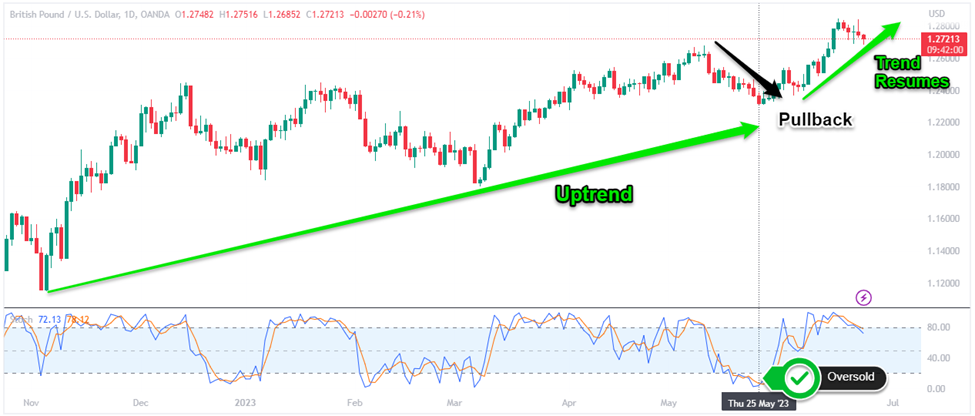
Source: TradingView GBPUSD Daily Chart
Range Trading Strategy
Another Forex trend trading strategy is range trading which works when there is a weaker trend in the market or there is no clear trend direction. In this strategy, traders aim to capitalize on the breakout of the established levels of support and resistance, profiting from the potential trend that can emerge afterwards.
The trading range often serves as a base or accumulation pattern where Smart Money is accumulating its position in anticipation of a new mark-up (mark-down) phase.
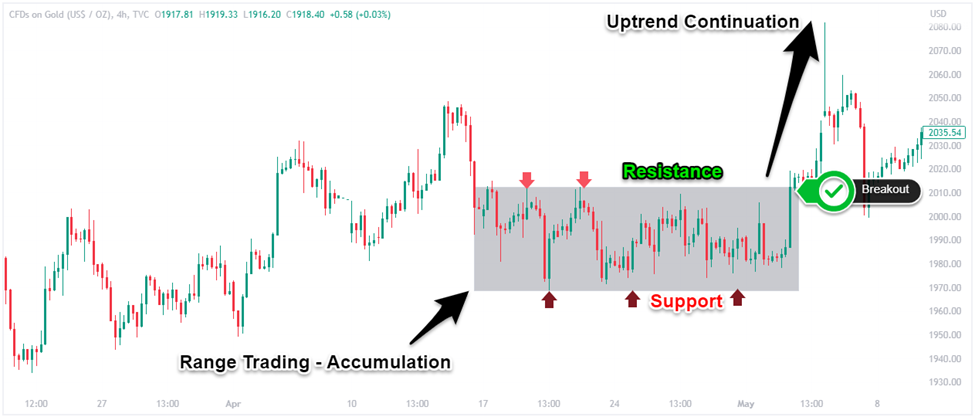 Source: TradingView XAUUSD 4-H Chart
Breakout Trading Strategy
The core concept of the breakout trading strategy revolves around the identification of well-established trending markets, where the price is printing a series of higher highs or lower lows, displaying an unwavering bullish or bearish momentum.
These are key junctures on the price chart where the market has previously demonstrated a tendency to reverse within an ongoing trend and can act as support and resistance levels.
When the market exhibits formidable momentum, building up as these support or resistance levels draw near, it becomes increasingly likely that the market will surpass these old swing highs/lows.
This moment of breakthrough heralds the birth of a new trend, propelling prices in a fresh direction.
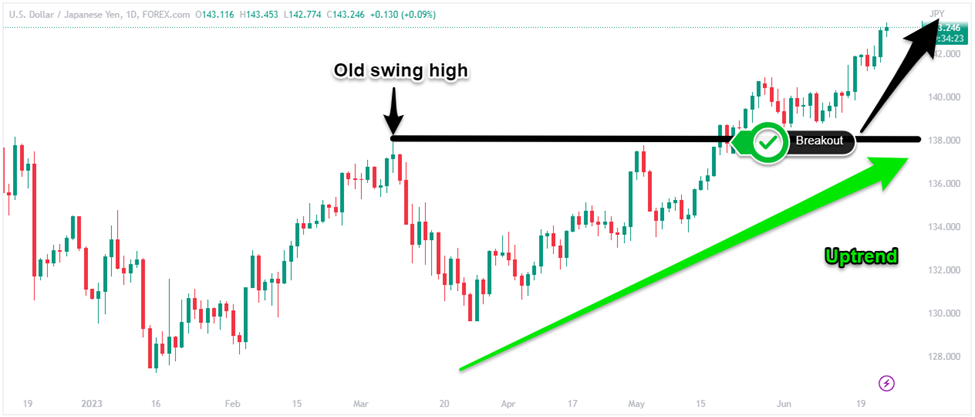
Source: TradingView USDJPY Daily Chart
Macro Trading Strategy
A trend trading strategy Forex traders can use to determine long-term trends is macro trading or fundamental analysis. Primarily adopted by hedge funds and mutual funds, these macro trading strategies strive to seize opportunities arising from significant shifts in economic policies, macroeconomic factors, international trade dynamics, interest rate frameworks, and geopolitical developments impacting various countries.
Fundamental analysis operates on the premise that economic and political events have the potential to influence market trends and provide insight into future price movements. Being aware of the broker's trends like FXPro Broker Leverage and Spreads Analysis can help you to be up to date with events and indicators.
By scrutinizing key economic indicators, such as
-
GDP growth,
-
inflation rates,
-
employment figures,
-
and central bank policies,
By scrutinizing key economic indicators, traders gain valuable insights into the underlying forces driving market behavior and future FX trends.
Best Indicators for Trend Trading Forex
The top 3 trend indicators you should know about are:
-
Moving Averages
-
Relative Strength Index (RSI)
-
Bollinger Bands
If you’re trend day trading the Forex market, the MetaTrader 4 (MT4) trading platform offers build-in trend indicators that cover a range of MT4 indicators including:
-
Average Directional Movement Index
-
Bollinger Bands
-
Envelopes
-
Ichimoku Kinko Hyo
-
Moving Averages
-
Parabolic SAR
-
Standard Deviation
 Metatrader trend indicators
Moving Averages as Trend Indicators
Trend trading in Forex with moving averages can help traders gain valuable insights into the overall direction of the market. Moving average (MA calculates the average price of a currency pair over a specified period, typically ranging from 9 days to 200 days, depending on your trading strategy and preferences.
When incorporating MAs into your trend trading approach, the key focus is on whether the price is positioned above or below the moving average:
-
If the price is above the MA, it often indicates an uptrend.
-
If the price is below the MA, it often indicates a downtrend.
It's essential to understand that moving averages are considered lagging indicators, meaning they trail behind the market price. They do not possess the ability to predict future trends but instead provide valuable insights into past market behavior.
Many Forex traders use multiple MAs (usually a slower and faster-moving average) and monitor the crossovers between these moving averages, which can act as potent buy and sell signals.
For instance, if a 9-day MA crosses a 21-day MA from below, it could indicate a favorable opportunity to initiate a long position.
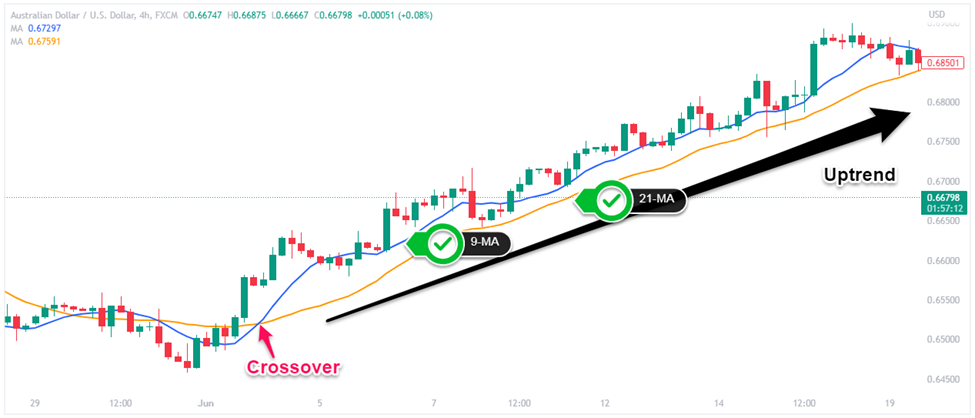
Source: TradingView AUDUSD 4-Hour Chart
Relative Strength Index (RSI)
The Relative Strength Index (RSI) is a momentum-based indicator that analyzes the average gains and losses over a specific number of periods, typically 14 periods, and determines whether the price is in overbought or oversold conditions.
When the RSI surpasses the 70 thresholds, it suggests that the market is "overbought," indicating a potentially overextended upward trend. Conversely, when the RSI falls below 30, it indicates that the market is "oversold," implying a possible exaggerated downward trend.
These levels act as vital signals for traders, suggesting that the trend may be nearing its maturity or reaching a turning point.
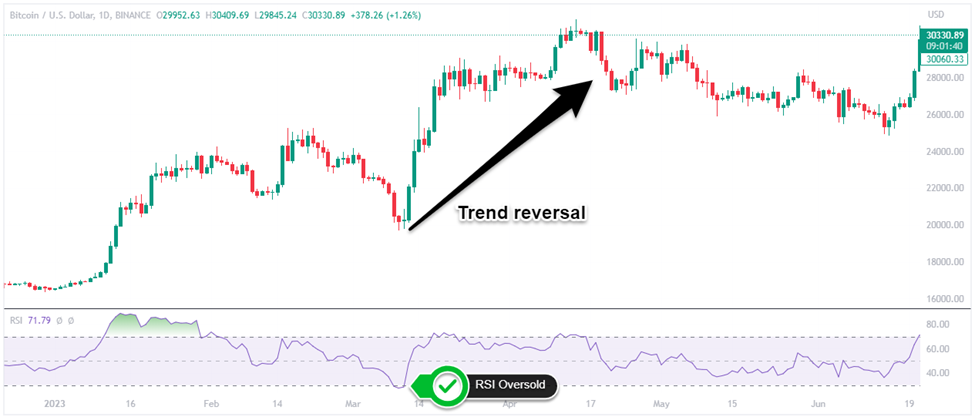
Source: TradingView Bitcoin Daily Chart
Bollinger Bands Indicator
Bollinger Bands are a widely used tool among trend traders to identify overbought and oversold levels in the Forex market. This versatile indicator consists of three lines with the middle band representing a 20-day simple moving average (SMA).
Together, these three lines form the Bollinger Bands, creating a dynamic channel around the price action.
When the price breaks below the lower Bollinger Band, it is often interpreted as a signal that prices have fallen to excessively low levels in a downtrend. This may suggest a forthcoming reversal into a new uptrend and a trend trade can be opened.
And, the same is true in reverse when the market is in an overbought condition.
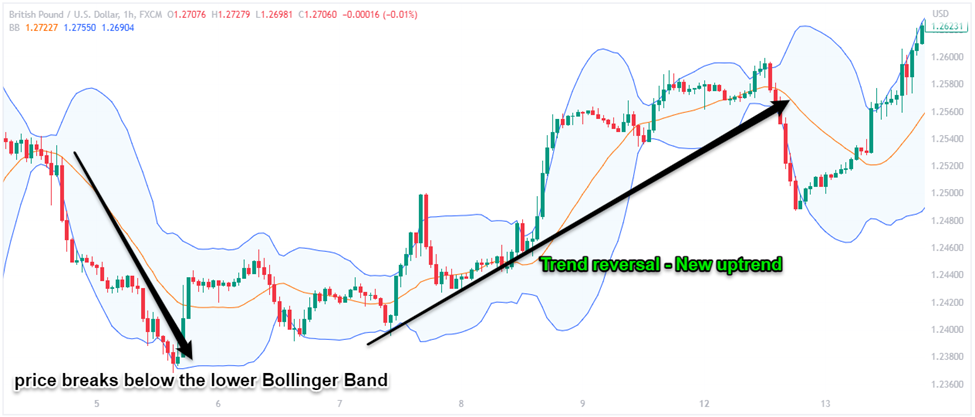
Source: TradingView GBPUSD 1-Hour Chart
Final Thoughts
Remember, the trend is your friend forex traders of all experience levels. The significance of this statement cannot be overstated because traders who align themselves with the overall direction of the market can ride the momentum generated by these trends, potentially maximizing their profits along the way. For example, you can check our Forex.com Trading Experience Feedback for more.
To effectively engage in trend trading forex, traders utilize a variety of strategies and indicators. Tools such as moving averages, trend lines, and momentum indicators help identify and confirm trends, enabling traders to make informed trading decisions.
It's important for traders to understand the different types of trends that exist, including secular, primary, secondary, intermediate, and minor trends. Each type presents unique characteristics and timeframes, requiring traders to adapt their strategies accordingly.
Furthermore, trend trading can be complemented by trading strategies, such as breakout trading, retracement trading, support and resistance trading, and fundamental analysis, which can provide a well-rounded perspective of the market direction.
Visit our comprehensive comparison page featuring the best Forex brokers in 2023. Our comparison page offers a curated selection of reputable brokers known for their reliability, competitive spreads, advanced trading platforms, and exceptional customer support.
For more Top Brokers, make sure you check out our Alfa Broker and RoboMarkets review.