
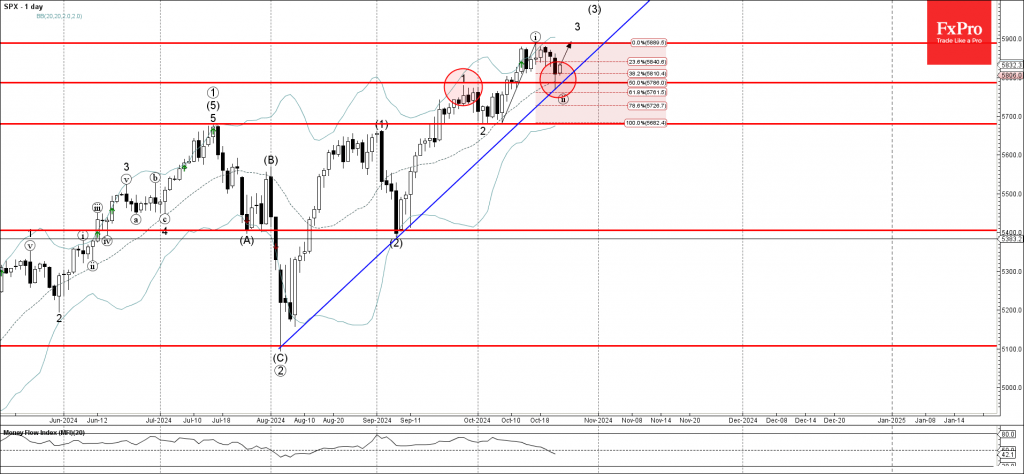
– S&P 500 index reversed from support zone
– Likely to rise to resistance level 5900.00
S&P 500 index recently reversed up from the support zone located between the key support level 5785.00 (former top of wave 1 from September), 20-day moving average and the 50% Fibonacci correction of the upward impulse from the start of October.
The upward reversal from this support zone is likely to form the daily Japanese candlesticks reversal pattern Morning Star Doji.
Given the clear daily uptrend, S&P 500 index can be expected to rise toward the next resistance level 5900.00 (which reversed the index earlier this month).

Source: https://fxpro.news