 Alpari
 XM
XMWith all the craziness going on in financial markets lately, the precious metal seems like a safe haven for your hard-earned dollars. As a trader myself, I get the appeal of the Gold trading strategy.
Gold tends to hold its value when other assets are tanking and those juicy price swings can mean nice profits…if you know how to play them.
But jumping into gold trading without a trading strategy is like wandering into a casino without a system. You might get lucky for a while, but the house usually wins. So before you put your money on the line, it's wise to learn some of the most popular gold trading strategies.
That's what this article is all about.
I'm going to walk you through key trading strategies used by experienced traders around the world. You'll learn:
-
When to buy gold,
-
When to sell gold,
-
And how to spot opportunities to profit from gold's famous volatility.
Whether you're a beginner looking to dip your toes in or an experienced trader seeking new ideas, you're bound to pick up useful knowledge.
With the right gold trading strategy, you can ride this glittering bull and squeeze cash from those golden price swings.
So park the lambos and yachts in your daydreams for now.
To trade gold successfully takes research, skill, and a strategic approach, but the payoff can be worth the effort.
Let's get started!
What is the best strategy for trading gold?
The short answer is, there is no one "best" approach. Successful traders use a few strategies to profit from gold price swings. However, there are a few key trading strategies that tend to work well for trading gold.
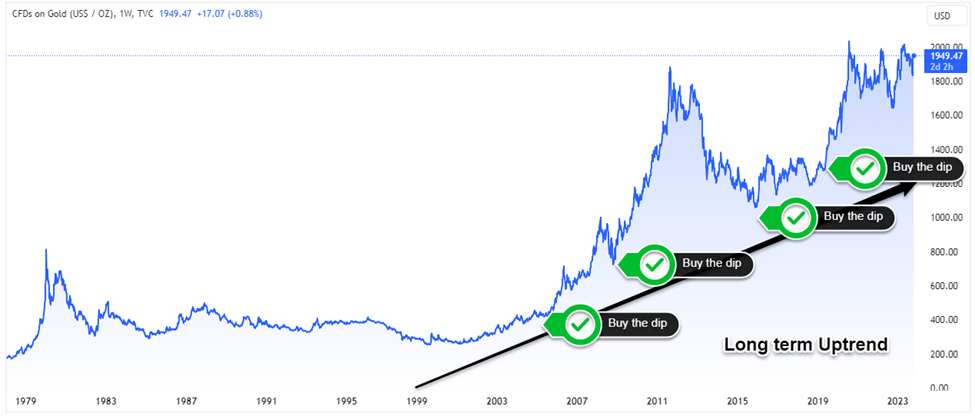
Trend Trending
One popular approach is trend trading. This means identifying the overall long-term trend in gold prices and trading in the same direction as the gold trends.
For example, if gold is in a prolonged bull market, trend traders would focus mainly on long positions and buy on dips. This strategy takes advantage of gold's tendency to make sustained upward trend driven by macroeconomic forces.
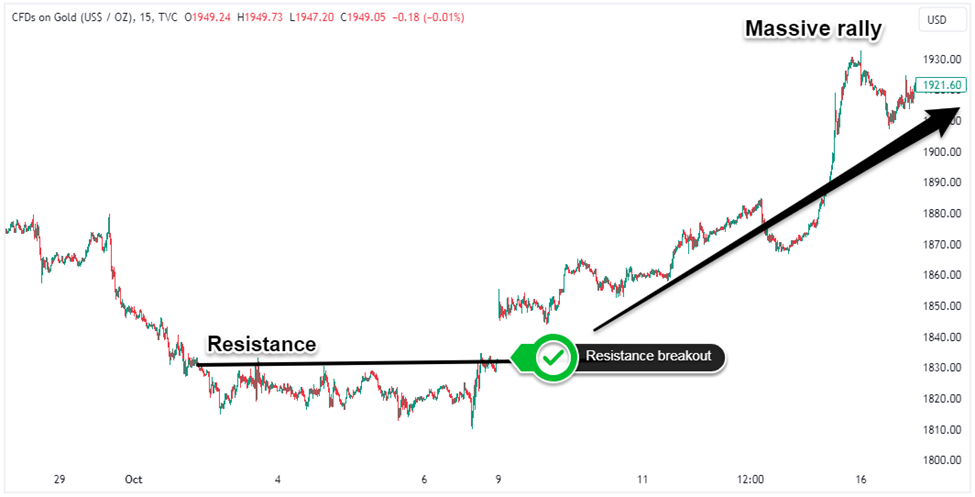
Breakout Trading
Another common strategy involves trading breakouts:
-
Buying gold when it breaks above key resistance levels
-
Or selling when it breaks below support.
Technical analysis tools like price action patterns and indicators help spot potential breakouts. This strategy capitalizes on the velocity of gold's moves after it clears important price hurdles.
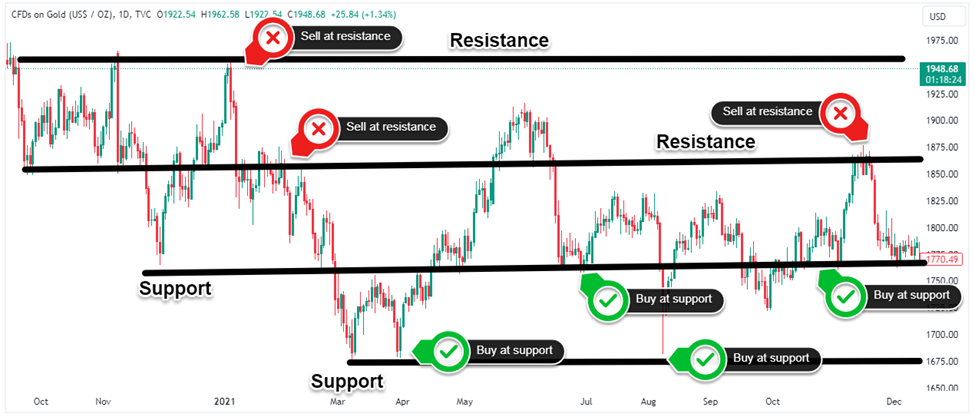
Range Trading
Some traders also employ range trading strategies when gold is consolidating within horizontal support and resistance levels. This involves buying gold near support and selling near resistance to capture profits from the range-bound action which allows taking advantage of gold's tendencies to remain "stuck" in ranges at times.
Many traders combine elements of different trading strategies or switch between them depending on the gold market environment.
What Is The Best Indicator To Trade Gold?
When it comes to trading gold, two technical indicators tend to work quite well:
-
Relative Strength Index (RSI).
-
And the 200-day moving average.
Let's take a closer look at how long-term traders and day traders use these popular technical indicators for trading gold.
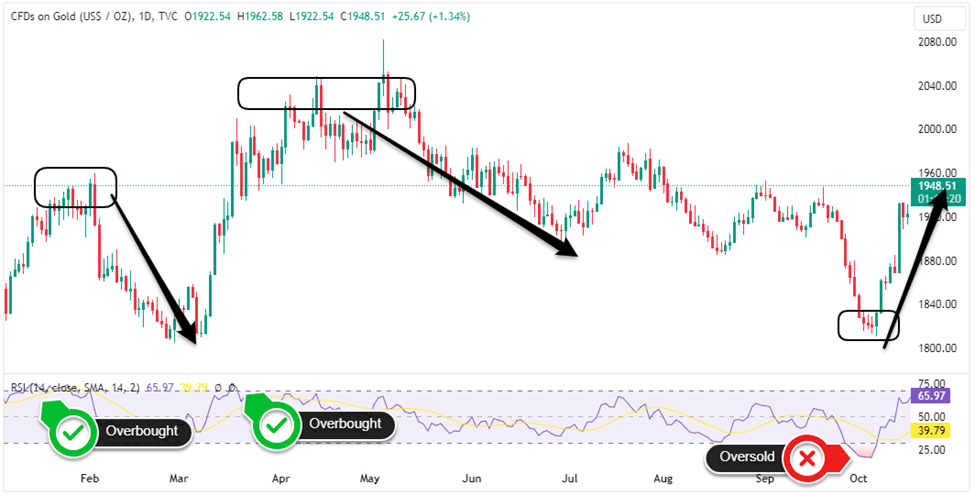
Relative Strength Index
The RSI is a momentum oscillator that measures the speed and rate of recent price movements and oscillates between 0 and 100:
-
Readings above 70 indicate Gold price is overbought,
-
Readings below 30 signal oversold conditions.
With gold, extreme RSI levels can signal potential trend reversals. For example, if the RSI reaches above 70 when gold is up-trending, it could mean the rally is overextended and due for a correction.
This would be a bearish signal to consider exiting long trades or initiating short positions.
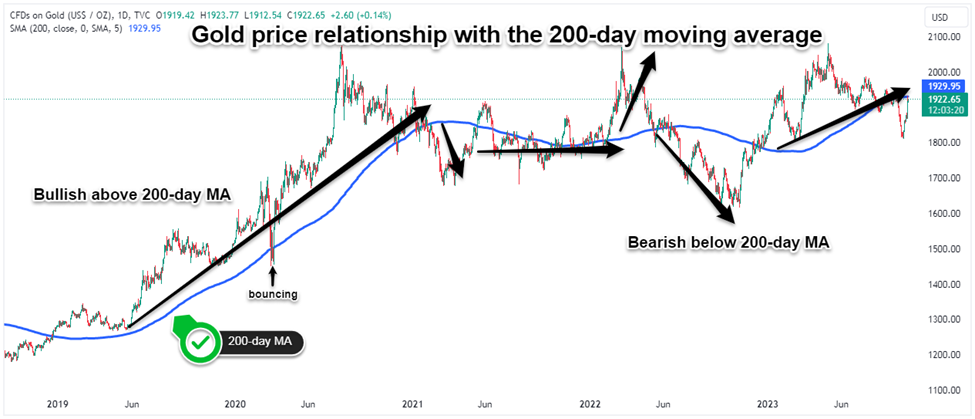
Moving Averages
The 200-day moving average is a widely followed long-term trend indicator:
-
When the gold price is above the 200-day MA, it signals an overall uptrend.
-
If the price falls below this MA, it indicates a downtrend.
Traders often use the 200-day MA to help determine the overall trend direction. Then they use the RSI to time oversold or overbought points to enter and exit trades in the direction of that major trend.
Combining analysis of the RSI and 200-day MA and other technical indicators provides a strategic approach to gold trading. This pairing of indicators helps traders define both the broader trend and potential reversal points and can improve trading results when applied with sound risk management.
What Is The Easiest Gold Trading Strategy?
For long-term traders who don't want to stare at charts all day, a simpler option is to use fundamental gold trading strategies focused on long-term investment. This approach involves looking at economic and financial factors that affect gold's value as an intrinsic safe-haven asset.
Trade the Gold Seasonal Pattern
Gold prices tend to follow a seasonal pattern tied to interest rates. As real interest rates fall in summer, gold futures contracts and SPDR Gold Shares (GLD) tend to rise and peak around July/August before declining into autumn when rates rise seasonally.
Savvy gold traders position long in spring and ride the rally through summer before closing positions as rates increase in the seasonal cycle during fall. Checking the Commitments of Traders (COT) report can help fine-tune entry and exit timing using hedging activity.
Hold Physical Gold as a Long-Term Safe Haven
Physical gold can be held as a long-term hedge and insurance policy against financial crises. Gold’s role as a store of value appreciates over time, especially during inflationary periods and market crashes.
Long-term fundamental traders maintain core positions in physical coins or bars to diversify portfolios.
Gold News Trading and Macro Fundamentals
Keep an eye on news and macro fundamentals that affect gold's safe-haven status like:
-
Inflation reports,
-
Geopolitical tensions,
-
Real interest rate changes,
-
Central banks (the US’s Fed) monetary policy changes,
-
and risk events can all trigger short-term volatility in trade.
Use these short-term news events as opportunities to enter and exit positions aligned with gold's role as a safety play but focus on the daily narrative driving gold rather than technical levels.
The key for fundamental gold traders is understanding the underlying dynamics that drive gold's intrinsic value over the long run.
Trade the Inverse Correlation Between Gold and Treasury Yields
One of the most reliable fundamental relationships to trade is the inverse correlation between gold prices and real interest rates, as represented by US Treasury yields:
-
When Treasury yields fall, the opportunity cost of holding non-yielding assets like gold decreases which causes the price of gold to rise as it becomes more attractive relative to bonds.
-
Conversely, when Treasury yields rise, the opportunity cost of owning gold increases which leads gold prices to lower as yields become more competitive versus the non-yielding metal.
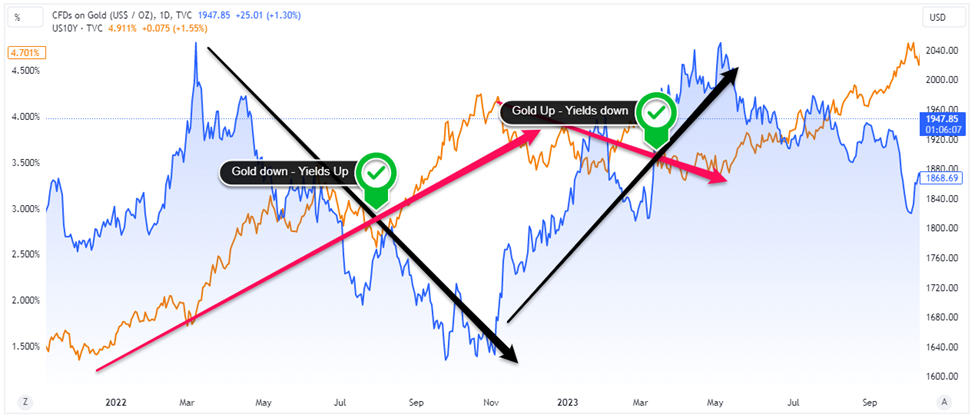
Savvy traders look to go long gold and short the US dollar when Treasury yields decline, signifying lower real interest rates. Monitoring yield trends and price action in currency pairs like XAU/USD provides trade signals based on this inverse relationship.
Technical Strategies for Short-Term Gold Traders
For short-term traders focused on capitalizing on short-term trades in gold, technical analysis strategies are key. Here are some popular technical techniques short-term gold traders use.
Trade Gold Using the Golden Cross and Death Cross
By tracking moving average crossovers, gold traders have reliable and time-tested signals to catch new uptrends and downtrends. Here is an overview of how to trade these Golden Cross and Death Cross moving averages:
The Golden Cross
The golden cross occurs when a shorter-term moving average, such as the 50-day, crosses above a longer-term moving average like the 200-day. This crossover pattern signals a potential new uptrend.
Here is the golden cross trading strategy:
-
First, when the golden cross occurs, short-term traders will look to buy gold.
-
The entry signal is when the price closes above the crossover point.
-
A protective stop can be placed below the long-term moving average (200-day MA).
Riding golden crosses allows traders to capitalize on emerging bullish trends.
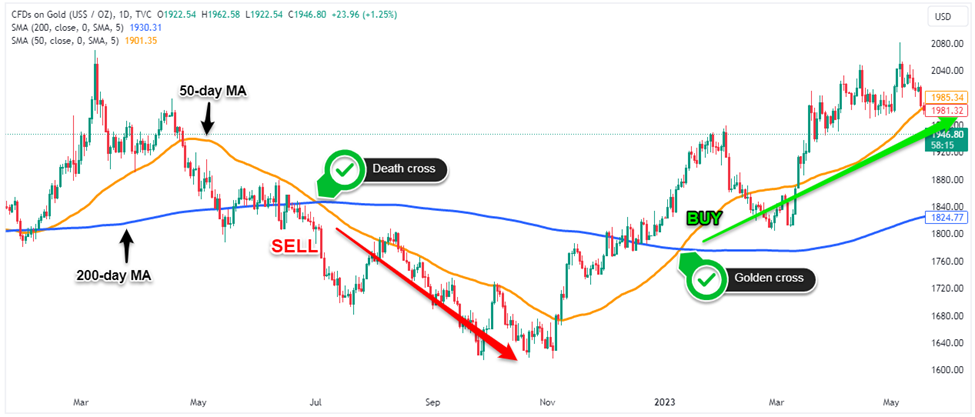
The Death Cross
The death cross forms when a shorter MA (50-day) crosses below a longer MA (200-day), signaling a potential new downtrend. It is the opposite signal of the golden cross.
When the death cross appears, traders would look to short gold when the price closes below the crossover and place a protective stop loss above the long-term MA. Trading death crosses allows capitalizing on emerging bearish momentum.
Gold Respects Key Fibonacci Retracement Levels
Fibonacci retracement levels are popular trading tools because gold prices tend to react at certain percentages of prior moves. The most widely followed are the 50% and 61.8% retracement levels.
Gold reverses at these Fib levels because they represent key areas where bulls and bears reach equilibrium after strong trends:
-
The 50% level marks the midpoint of the previous move.
-
The 61.8% level is close to the golden ratio which is mathematically significant.
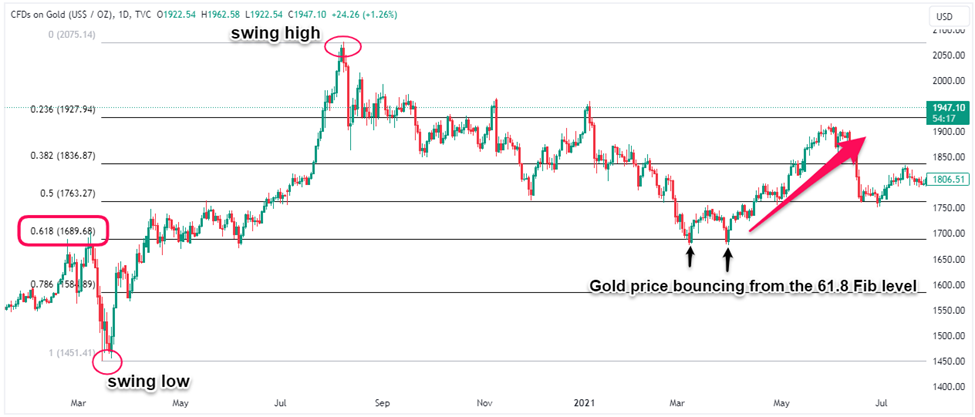
When gold rallies sharply and then pulls back, watch for a reversal around the 50-61.8% zone. This flags a high probability buy signal since bulls defend this key confluence area. The opposite applies after sharp sell-offs in gold.
The beauty of the 50-61.8% Fib zone is it objectively defines high-probability reversal points. Traders don't need to guess where gold might find buyers or sellers. The Fib math identifies those areas mathematically based on crowd behavior patterns.
By combining Fibonacci analysis with other indicators that confirm reversals, gold traders have an edge in identifying turning points. The confluence between fib levels and technical signals provides high-odds setups.
Ready to start trading gold?
Our top recommended brokers make it easy to trade gold safely with tight spreads and cutting-edge platforms. Click below to see our list of the best brokers for trading gold and precious metals: