 Alpari
 XM
XMFibonacci retracement levels are a popular tool used in technical analysis to identify potential support and resistance levels in the market.
If you struggle to identify optimal entry and exit points, in this article, we’ll explore the strategies and techniques that traders use to enhance their Forex trading strategies. We’ll cover the basics of Fibonacci levels in Forex, including what they are and how they work.
But why should you care about Fibonacci levels in Forex?
Well, if you’re looking to improve your trading skills, then understanding how to use these levels can be incredibly beneficial.
Whether you're a beginner or an experienced trader, using Fibonacci can help take the guesswork out of forex trading. The key is knowing which Fibonacci strategy to use and when.
Trading is hard enough without fighting against the underlying market structure. By mastering Fibonacci trading strategies, you can finally trade in harmony with the natural ebbs and flows of the market.
Ready to up your forex trading game?
Let's dive in!
Understanding Fibonacci in Forex Trading
The Fibonacci sequence is a series of numbers named after the Italian mathematician Leonardo Fibonacci. Each number in the sequence is the sum of the two preceding numbers (1, 1, 2, 3, 5, 8, 13, 21, etc). While this pattern was known in ancient India, Fibonacci popularized it in the Western world in the 13th century.
It turns out this sequence is more than just math.
The Fibonacci numbers are connected to natural growth patterns and proportions.
The ratios between the numbers (1.618, 0.618, 0.382, etc) make up the so-called "golden ratio" that is frequently found throughout nature, architecture, and beyond.
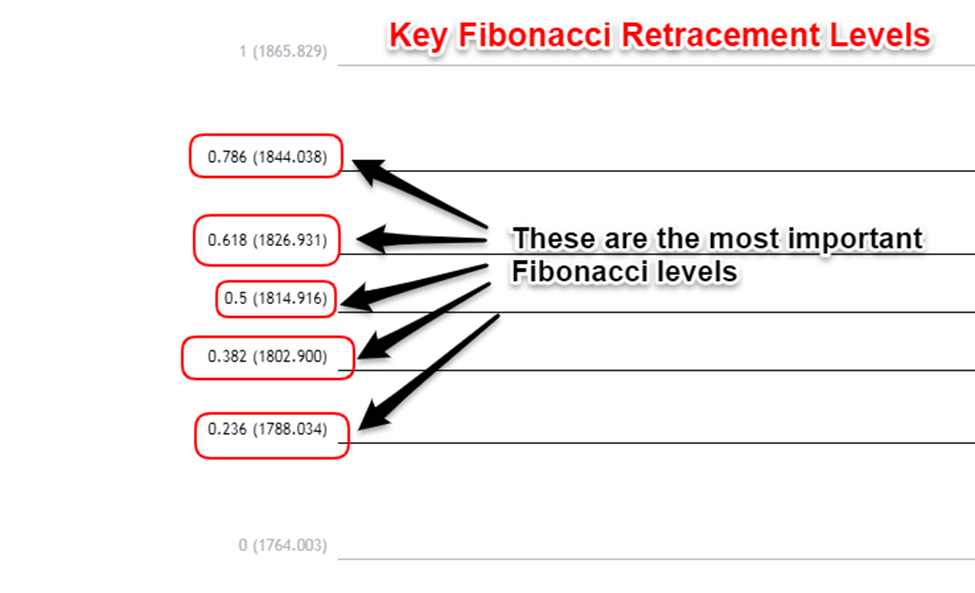
Fibonacci retracement levels are horizontal lines that indicate where support and resistance may emerge after a significant price movement. Traders apply the Fibonacci retracements tool by connecting a swing high with a swing low on the chart.
Key retracement levels are 23.6%, 38.2%, 50%, 61.8% and 78.6%.
Fibonacci extensions do the opposite – they provide potential future support and resistance levels in the direction of the overall trend. Extensions are drawn by connecting a swing low to a swing high.
The key extension levels are 127.2%, 161.8%, and 261.8%.
The most widely used Fibonacci ratios in trading are 0.618 (61.8%), 0.382 (38.2%), 1.618 (161.8%), 2.618 (261.8%) and 4.236 (423.6%). Since markets tend to move in waves and cycles, these Forex Fibonacci levels can highlight areas where the price may reverse.
Applying Fibonacci Retracement in Forex Trading
One of the most common uses of Fibonacci for Forex trading is for retracement levels.
After a significant price movement up or down, the market will often pull back or consolidate before continuing the overall trend. Fibonacci retracement levels help traders identify potential support and resistance areas during this pullback.
To use Fibonacci retracements, first identify a major swing high and swing low on the price chart. This will establish the overall trend. Next, connect these two points and apply the key Fibonacci ratios of 23.6%, 38.2%, 50%, 61.8% and 78.6%.
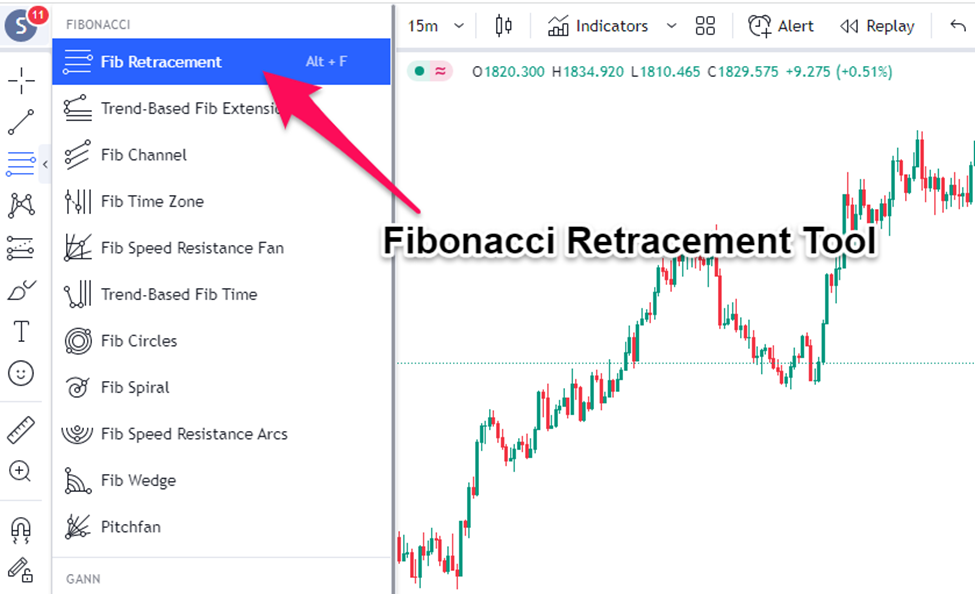
To apply Fibonacci retracement on a trading platform select the Fibonacci retracement tool to automatically draw the horizontal lines between these two swing points. Most trading platforms would have the Fibonacci indicator in the default technical analysis tools.
These Fibonacci levels in Forex will highlight possible areas where the price could find support or resistance as it retraces against the prevailing trend. For example, if the price pulls back to the 61.8% retracement level and rebounds, that indicates the overall uptrend is still strong.
Some tips when using Fibonacci in Forex trading:
-
Look for retracement levels that align with previous support or resistance zones for added confluence
-
Use Fibonacci in conjunction with other indicators like moving averages for confirmation
-
Focus on high-probability retracement levels like 38.2%, 50%, and 61.8% rather than extreme levels like 23.6% or 78.6%.
With practice, Fibonacci retracement can become a powerful tool to time entries and exits as you ride the waves of Forex market trends.
Incorporating Fibonacci Extensions in Forex Trading
While Fibonacci retracements look backward, Fibonacci extensions help traders look ahead to future potential price targets.
Extensions provide possible support and resistance levels in the overall trend direction by using the same Fibonacci ratios. To use extensions, first identify a prior swing low and swing high to establish the overall trend.
Next, connect these two points and apply the key Fibonacci levels of 127.2%, 161.8%, and 261.8% to create expansion levels extending out from the swing high.
These extension levels can highlight possible price targets and exit points in a strong uptrend or downtrend. The 161.8% level is typically seen as the most significant for Fibonacci extensions.
Here are some tips for using extensions Fibonacci in trading Forex:
-
Focus on extensions in the direction of the more significant trend – don't rely on them in choppy or rangebound markets.
-
Use Fibonacci extensions in confluence with support/resistance zones and moving averages.
-
Manage risk accordingly, as extensions are only potential future price targets, not guarantees.
Fibonacci and Trend Analysis in Forex Trading
One of the most valuable uses of Fibonacci in forex is identifying trends and potential reversals. The Fibonacci toolset can tip traders off to both continuations as well as the end of a trend.
For uptrends, watch for the price to retrace to a Fibonacci retracement level like the 38.2% or 50% zone. As long as the retracement holds and the price resumes upward, the uptrend can be confirmed as intact.
However, if the price breaks below the 61.8% or 78.6% Fibonacci retracement level, that signals the uptrend is likely reversing into a new downtrend.
The opposite logic applies to downtrend analysis. A shallow retracement means the downtrend is solid while breaking above key Fib levels warns of a potential reversal brewing.
In addition to retracement analysis, Fibonacci extension levels can forecast how long a trend may last. If the price rapidly extends beyond the 161.8% expansion, that indicates an overextended move that may soon reverse.
With the right confluence factors, combining trend and Fibonacci analysis gives savvy forex traders an analytical edge.
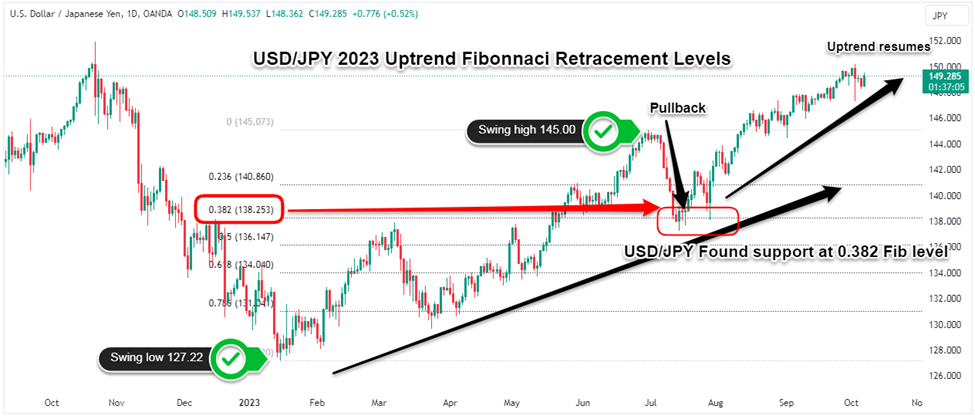
For example, let's look at the uptrend on the USD/JPY daily chart in early 2023.
The price surged from a low of 127.22 to a high of 145.00 over several months, establishing the uptrend. After reaching the peak, the USD/JPY pulled back to the 38.2% Fibonacci retracement level near 138.00 before resuming upward.
This shallow retracement confirmed the uptrend was still robust. The USD/JPY then extended up to around the big psychological level of 150.00 before topping out.
So don't fear forex market trends – learn to trade in sync with them using strategic Fibonacci analysis. You'll wonder how you ever traded without it!
Pros and Cons of Using Fibonacci in Forex Trading
While Fibonacci retracements and extensions can be invaluable tools for Forex trading, they aren't magic bullets. Here are some key pros and cons to consider:
Advantages of incorporating Forex trading with Fibonacci:
-
Fibonacci levels identify potential support/resistance zones with a high probability of holding.
-
Fibonacci can make sense of complex market movements and wave patterns.
-
Retracements help time entry points in the trend direction. Extensions forecast possible price targets.
-
Fibonacci analysis works across all timeframes and financial markets.
Disadvantages and limitations of Fibonacci:
-
Levels are based on historical data and may not predict future moves with 100% accuracy.
-
Many traders watch Fibonacci levels, so the market can whipsaw around key zones.
-
It still requires skill and discipline to properly incorporate Fibonacci with other indicators.
-
Extensions should be used cautiously and require trend confirmation.
-
There is a lot of subjectivity in choosing the right swing highs and lows.
Effective Strategies Using Fibonacci in Forex Trading
Fibonacci retracement analysis can be enhanced when combined with other technical tools for high-probability setups. Here are some effective Fibonacci forex trading strategies:
-
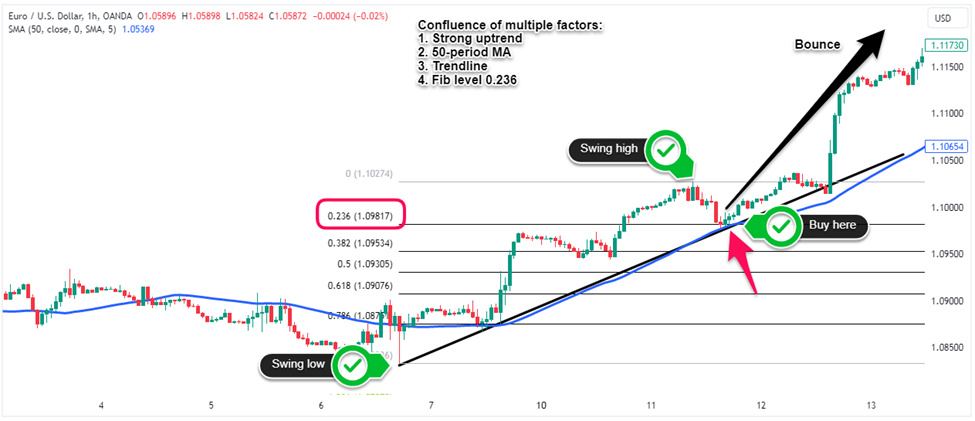
Draw trendlines connecting major swing points and look for retracements to trendlines near Fibonacci levels Forex – this confluence creates solid entry levels.
-
Identify Fibonacci confluence zones where retracement levels align with horizontal support/resistance. The more confluence, the higher the probability of reaction at key Fibonacci levels.
-
Fibonacci Fan lines apply for retracements and extensions across price action to forecast potential reversals. Look for price to reject from fan lines at Fib ratios.
-
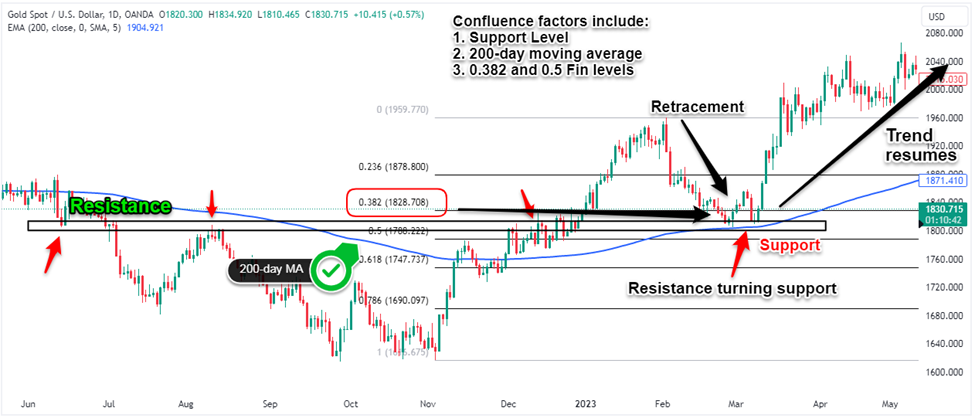
The 50% retracement or the 0.382 Fib level combined with the 200 period moving average is a popular Fibonacci forex trading strategy for dynamic support in uptrends.
-
For trend confirmation, use the RSI oscillator to identify oversold/overbought readings aligning with Fibonacci zones.
By combining Fibonacci with trendlines, simple moving averages, oscillators, and confluence, traders can pinpoint high-probability setups.
The key is confirmation – never rely solely on static Fib levels.
Risk Management and Fibonacci Trading
While Fibonacci retracements can identify opportune market turning points, they aren't a crystal ball. Proper risk management is still essential when applying Fibonacci retracement Forex strategies. Here are some guidelines:
-
Don't trust any single Fibonacci level unconditionally – momentum or volatility can cause prices to overshoot key zones, especially during strong trends.
-
Using Fibonacci requires broader confirmation through price action and other indicators. Blindly buying or selling at Fib levels without context is risky.
-
Use stop losses to contain potential losses if the price fails to react at a Fibonacci level as expected.
-
Focus on high probability retracement ratios between 38.2% and 61.8%. Extreme ratios like 23.6% or 78.6% have a lower probability.
-
Be cautious trading Fibonacci extension levels beyond 161.8% as targets – markets can trend further than expected.
-
Combine Fibonacci with supporting technical indicators like moving averages for added confirmation.
-
Scale position sizes appropriately according to your risk tolerance – never risk too much capital on a single setup.
-
Beware of confirmation bias – don't force trades just because Fibonacci levels align with your bullish or bearish bias on a currency pair.
Markets evolve and change over time which is why static Fibonacci levels based on past price moves may not predict future turning points accurately in shifting conditions.
While important Fibonacci ratios pinpoint high-probability reversal zones, they aren't foolproof.
The key point is that Fibonacci analysis requires confluence, robust risk management, and adaptive trading skills so it should be just one piece of a well-rounded trading approach, not the core strategy. Combine it smartly with other tools for the best results.
Case Studies and Examples
To illustrate how to effectively apply Fibonacci Forex analysis, let's walk through a trading case study:
Failed Case
While Fibonacci analysis can identify high-probability setups, it's important to also examine cases where it fails.
For example, in mid-2022, GBP/USD was trending lower, falling from 1.4190 down to 1.0360. In January 2023, it bounced up to the 50% retracement level around 1.2305.
The price dropped by 1.2305 and began moving lower. We went short on GBP/USD, anticipating further downside, and a stop loss was placed above 1.2400.
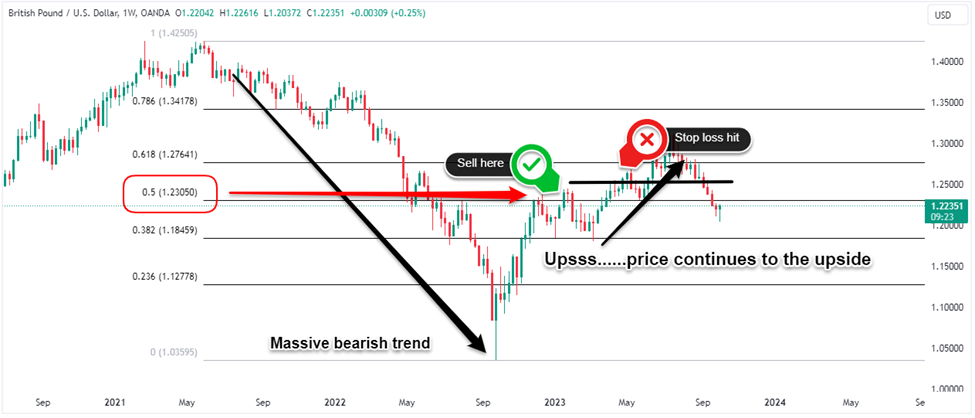
However, this trade did not work out as planned. Even though 1.2305 was a key Fibonacci zone, GBP/USD was unable to sustain the bearish momentum. It bottomed out at around 1.1900 before reversing back up through the stop loss at 1.2400.
Analyzing this failed trade, we can extract some lessons:
-
Do not force trades just because the price hits a Fib level – look for confirming price action.
-
Use tighter stops when trading failed breakouts, as false moves are common at Fib zones.
-
Retracements high up near 61.8% have a lower probability of holding compared to 38.2% or 50%.
Final Thoughts
Mastering Forex trading with Fibonacci can provide a true edge for Forex traders but requires practice and adherence to sound trading principles. Start by learning:
-
How to plot basic retracements and extensions tied to swings highs and lows.
-
Identify confluence zones where Fibonacci levels align with other technical indicators.
-
Locate high-probability setups where a confirmation signal coincides with a key Fib level.
Always employ prudent risk management using stops and proper position sizing. Losses are part of trading – learn from them rather than being discouraged.
Is Fibonacci a magic shortcut to forex profits?
No tool provides easy answers but applied prudently, Fibonacci can provide a missing piece of the puzzle. Master it as part of a complete, disciplined approach to technical trading.
To compare the best Forex brokers, check out this up-to-date Forex Brokers Comparison Table. Evaluate factors like regulation, commissions, spreads, trading platforms, and currency pairs offered. Selecting the right brokerage is key to maximizing your success when trading forex using Fibonacci techniques.