 Alpari
 XM
XMForex trading can be daunting for those traders just starting out. With so many trading strategies and time frames to choose from, it's hard to know where to begin. For beginner traders looking to dip their toes into the Forex market, the 4 hour trading strategy Forex offers an accessible entry point.
Unlike the lower timeframes (like the 1-minute or 5-minute time frame) which can be noisy and erratic, the 4 hour chart provides a clearer picture of overall market trends. The extended time frame allows traders to identify support and resistance levels as well as establish a sense of market direction.
At the same time, 4 hour trading is active enough for traders to make moves throughout the day without being glued to their screens.
The key benefits of Forex trading the 4 hour chart include:
-
Ability to trade around the clock – With a 4 hour time frame, trades can be placed at all hours of the day or night. This flexibility suits those Forex traders with busy daytime schedules.
-
Balance of intraday action and big picture – The 4 hour chart captures short-term price swings and oscillations as well as larger moves and trends, which provides helpful context for planning trades.
-
Less stress – Compared to lower time frames, 4 hour trading doesn't require constant monitoring. Traders can check in periodically without obsessively watching every pip.
For beginner traders ready to try their hand at Forex trading, the 4 hour Forex trading strategy offers a sensible middle ground. Trades can be placed judiciously based on identifiable technical levels and patterns, manage risk and position sizing can be kept modest until greater experience is gained.
Most importantly, traders can implement the 4 hour trading strategy while minimizing time and anxiety. Slow, steady, and consistent is the name of the game.
What is the 4 hour timeframe in forex?
A 4 hour time frame means each candlestick encapsulates 4 hours of market price action from open to close.
When reviewing Forex charts, the time frame refers to the length of each candlestick on the chart. The default time frames supported by the most popular trading platforms also include the 4-hour chart and:
-
1-Minutes
-
5-Minutes
-
15-Minutes
-
1-hour
-
4-hours
-
Daily chart
-
Weekly chart
-
Monthly chart
The 4 hour charts are considered intraday charts, falling in between the broad perspective offered by the daily chart and the detailed minute-by-minute view of the hour charts.

Source: TradingView EURUSD Chart
What does the 4 hour chart show?
Each 4 hour candlestick begins at either 00:00, 04:00, 08:00, 12:00, 16:00, or 20:00 GMT time, capturing trading for the subsequent 4 hour period. Once a candle is completed, a new one forms, providing an ongoing visual record of where the market has traveled within each 4 hour block.
Traders favor the 4 hour timeframe because it delivers an informative balance:
-
It reveals intraday swings in price action that are hidden on wider daily charts or weekly charts.
-
It filters out much of the market "noise" prevalent on narrow hour charts or 15 minute charts.
-
There are 6 candlesticks per day, allowing active intraday trading while avoiding excessive gluing to the screen.
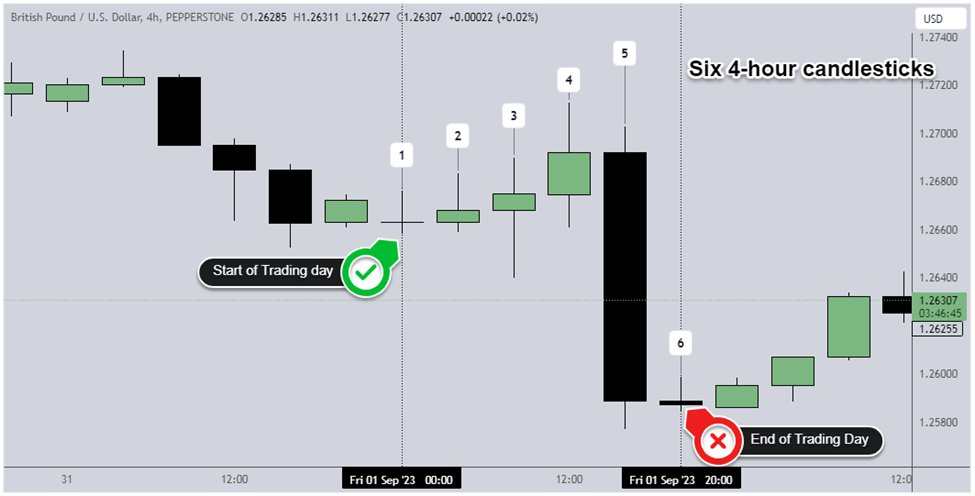
Source: TradingView GBPUSD 4-hour Chart
In summary, the 4 hour chart timeframe provides Forex traders with a flexible and nuanced view of market conditions over the course of each trading day. For beginning traders, 4 hour charts are a useful starting point before delving into day trading or scalping which involves taking more trades.
Why trade the 4 hour timeframe?
Unlike the stock market which trades for 8-9 hours per day, the Forex market runs 24 hours a day during weekdays, which makes the 4 hour time frames uniquely well-suited for Forex trading. In different markets, the 4 hour chart only shows just 2 candlesticks per day because there isn't enough intraday price activity for short term technical analysis.
Stock traders therefore gravitate to the daily chart for core analysis.
But in Forex, there are 6 full 4 hour candles each trading day which aligns neatly with major Forex trading sessions – Each 4 hour candlestick encompasses a half session of active trading in Sydney, Tokyo, London, and New York. This makes it easy to identify trading session breakout opportunities.
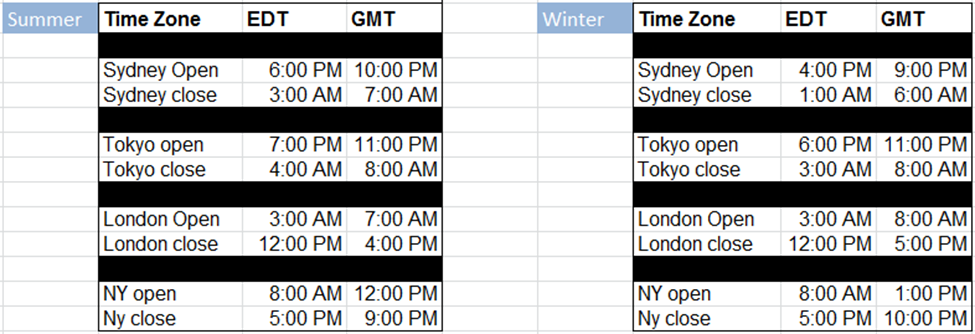
Forex Trading Session Times
This provides ample trading opportunities and intraday price action trading for traders to identify trends, support and resistance levels, and execute trades based on chart patterns.
Is 4 hour chart good for swing trading?
The 4 hour time frame is commonly used in swing trading. The swing trading strategy aims to capture gains from intermediate trend moves lasting anywhere from a few hours to several days, which makes the 4 hour chart an ideal compromise between long-term and short-term trading.
Here are some additional factors to consider when deciding if swing trading is the right Forex strategy for you:
-
Time commitment – Swing trading takes more time than long-term investing but typically less time than day trading. Expect to spend 1-3 hours per day analyzing charts and looking for setups.
-
Trading style – Swing trading involves both technical analysis and fundamental analysis. If you prefer fast-paced technical trading, it may suit you better than long-term buy-and-hold Forex strategy.
-
Temperament – Swing trading requires patience to hold through normal pullbacks. If you tend to panic easily, position trading may be better suited.
-
Capital – Swing trading often utilizes leverage to maximize profit potential. Make sure you have enough trading capital to manage risks.
-
Risk tolerance – Swing trading has more risk compared to investing but less risk versus day trading, so make sure to consider your appetite for risk.
-
Market conditions – Swing trading thrives in volatile, trending markets but low volatility ranges can lead to false breakouts.
Check that your personality, skills, and resources align with the swing trading strategy.
How to trade 4-hour charts in forex?
It's important to configure your 4-hour chart correctly using the New York trading session close.
Since forex is traded 24/5, brokers operate in different time zones. This affects when a 4-hour candlestick closes and prints a new one. Using the universal New York close time creates chart consistency.
With the New York close, each 4-hour candlestick finishes at:
-
5:00 PM EST
-
9:00 PM EST
-
1:00 AM EST
-
5:00 AM EST
-
9:00 AM EST
-
1:00 PM EST
Adjust for your time zone: If you use Central time, shift each close back one hour (4:00 PM, 8:00 PM, 12:00 AM, 4:00 AM, 8:00 AM, and 12:00 PM) and for Pacific Time, shift back three hours (2:00 PM, 6:00 PM, 10:00 PM, 2:00 AM, 6:00 AM, and 10:00 AM).
How do you trade on a 4 hour chart?
Having the standardized 4-hour close creates identical charts as professional traders use. This provides more accurate price action and trading setups compared to random Forex broker closing times.
While it may seem trivial, setting your 4-hour chart to the New York close can make a real difference in your technical analysis as it's an easy way to gain a trading edge over the charts produced by your Forex broker's default settings.
The New York close creates consistency and puts you in sync with smart money traders.
What is the 4 hour trading strategy?
As the name suggests, the 4 hour trading strategy Forex is a trading strategy that uses the 4 hour chart to execute long and short positions on the Foreign exchange market. In essence, this Forex trading strategy is a trend trading strategy because the 4 hour chart displays larger price movements.
If you want to trade with this trading strategy, traders can use different approaches:
-
4 hour trading strategy using price action
-
4 hour trading strategy using moving averages
-
4 hour trading strategy using the RSI indicator
-
Etc.
What is the best indicator for the 4 hour chart?
Some of the most popular and helpful indicators for the 4 hour time frame include:
-
Moving Averages
-
MACD (Moving Average Convergence Divergence)
-
RSI (Relative Strength Index)
-
Bollinger Bands
There are many indicators traders can experiment with on the 4-hour chart. The ones mentioned above are commonly used – moving averages in particular help new traders follow the long term trend on the 4 hour chart. Apply technical indicators sparingly and use them to confirm trading decisions in any market – not replace – price action analysis.
What is the best 4 hour Forex strategy?
Many traders swear by the old adage “Price Action is king!”
So, naturally, the best trading strategy using the 4 hour time frame is the price action trading strategy.
Price action trading involves analyzing the movement of candlesticks and chart patterns to determine market trends and potential trade entries and profit levels. This strategy uses price action on the 4-hour chart to identify and trade with the prevailing strong trend.
First, identify if the market is trending higher or lower using the 4-hour chart. An uptrend will show progressively higher highs and higher lows, while a downtrend will show lower lows and lower highs.
For this example, we used the USDJPY currency pair.
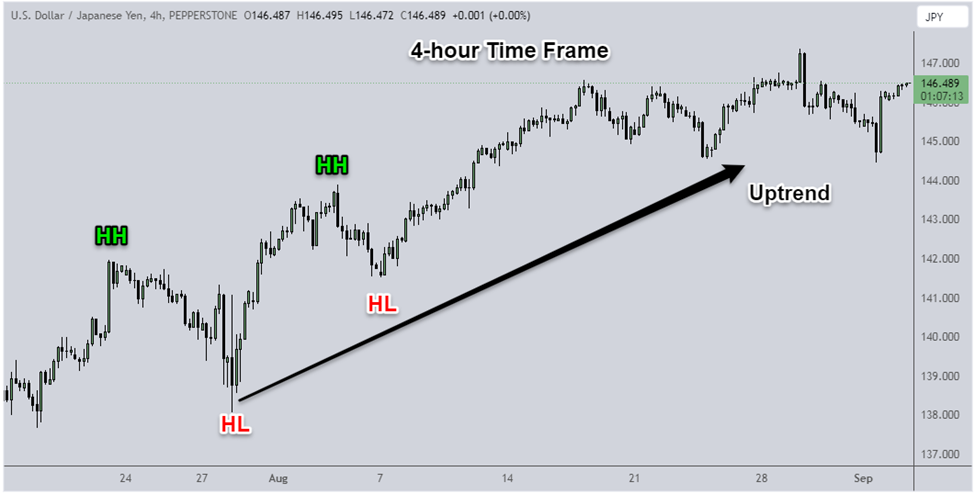
Source: TradingView USDJPY 4H Chart
Once the trend is determined, look to enter trades in the same direction of the trend. For an uptrend, find opportunities to buy near support levels where the price is relatively "cheap" and for downtrends, look to sell at resistance when the price is "expensive".
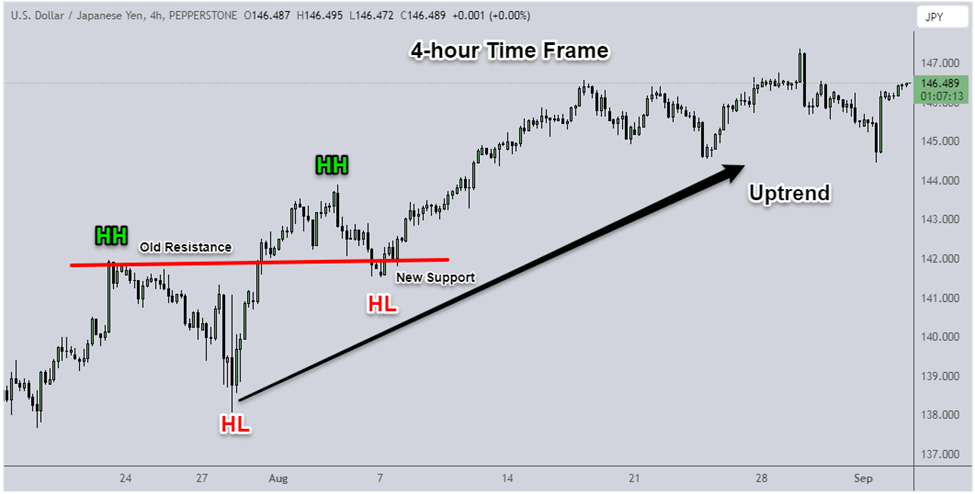
Source: TradingView USDJPY 4H Chart
Focus on candlestick formations at support and resistance to time entries:
-
Bullish engulfing patterns, pin bars, and doji candles can signal upside breakouts.
-
Bearish engulfing candles, shooting star, and hanging man patterns can precede breakdowns.

Source: TradingView USDJPY 4H Chart
Use other price action clues like swing points and moving averages to add additional confirmation before making any trading decisions. Always utilize stop losses and sound risk management to limit the downside, which will give you a complete trading plan.
If you are a trader who wants to trade with a Forex trading strategy using technical indicators, moving averages can help you hold trades until a reversal happens.
See below how:
4 Hour Trading Strategy Using Moving Averages
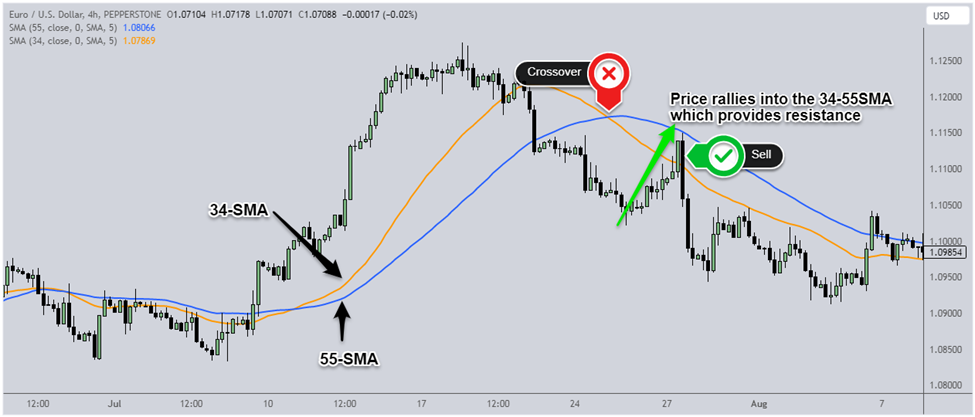
The crux of this trading strategy lies in assessing the alignment of these MA lines with price action to determine the viability of a trading opportunity. This strategy utilizes two simple moving averages on the 4 hour chart to assess the dominant trend – a 34 period and a 55 period SMA:
-
When the 34 SMA is trading above the 55 SMA, and both SMAs are angled upwards, an uptrend is confirmed. Traders would look for trade opportunities to buy on pullbacks, with stop loss placed below the 55 period SMA.
-
If the 34 SMA crosses below the 55 SMA, and both moving average lines tilt downwards, a downtrend is signaled. The trading strategy would be to sell on rallies, placing stop loss orders above the 55 period SMA.
Source: TradingView EURUSD 4 Hour Chart
The profit target can be established when the price closes above/below the 2 moving averages.
4 Hour Trading Strategy using RSI
The Relative Strength Index (RSI) is a useful momentum indicator that can confirm trend signals on the 4 hour chart by drawing trendlines on the RSI and anticipating potential breakouts.
When the RSI is trending higher and making successive higher highs, draw an uptrend line connecting the RSI lows. When the RSI trendline is broken below look to sell expecting the 4 hour price action to follow the same direction.
In downtrends, draw a descending trendline on the RSI connecting the highs as it falls and buy once the RSI trendline is broken. Whether the trade working in your favor or not make sure you use proper risk management.
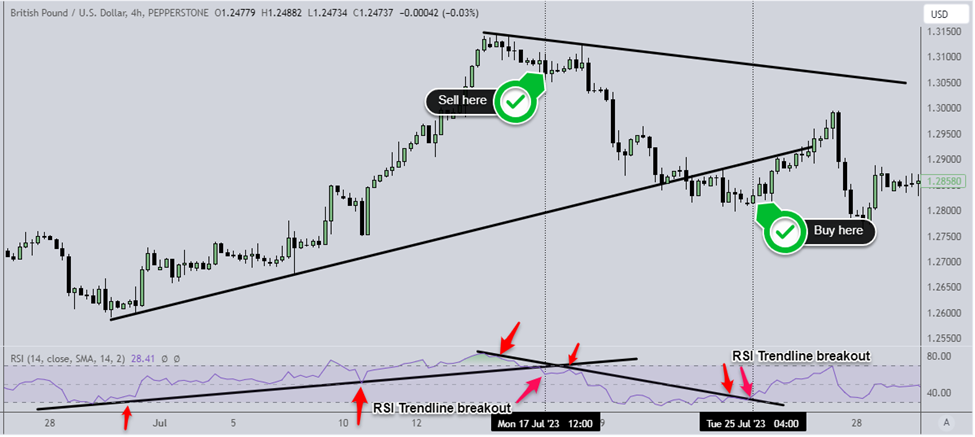
Source: TradingView GBPUSD 4-hour TF
Final Thoughts
Here are some final tips for beginner traders on using the 4 hour trading strategy Forex:
The 4-hour time frame can be a sweet spot for new Forex traders because it moves faster than the daily chart to provide more trading opportunities, but slower than the hour chart to filter out market noise.
When starting out:
-
Stick to the major currency pairs like EUR/USD and USD/JPY when analyzing the 4-hour chart.
-
Examine the key support and resistance levels and trends.
-
Utilize moving averages to define the overall market bias.
-
Enter trades in the direction of the trend by buying dips in uptrends and selling rallies in downtrends.
-
Candlestick patterns can provide additional confirmation around support/resistance.
-
Use stop losses on every trade.
Becoming profitable Forex trading requires a commitment beyond just chart analysis. Develop routines for researching markets, journaling trades, reviewing results, trade management techniques and continually improving. Aim for steady progress by mastering basics before adding complexity.
Be patient and let trades play out over hours or days, not minutes.
Our experts have compiled a detailed comparison of the best Forex brokers – analyzing their platforms, tools, spreads, and execution quality. If you're ready to unleash the potential of 4 hour trading, finding the right broker is your crucial next step.