3 Forex Candle Patterns to Increase Your Profits in 2024
The candlestick pattern analysis method has evolved to become one of the most popular technical analysis tools in the Forex market. Traders in stocks and other financial markets also use candlesticks as a great visual aid to know what a particular price has done within a given time period.
Japanese candlestick patterns are essential and top-notch tools in forex trading. Understanding them allows traders to interpret the changes that occur in the market and make decisions based on that information.
In this article from our Forex Blog, we will show you the three most important candle patterns to increase your profits in the Forex market in 2024.
What is Japanese candlestick chart?
Candlestick charts in trading are price charts that show trends and reversals, in which prices are indicated by candles. Candlestick charts are easy to read and are one of the oldest studies in technical analysis. They originated in Japan more than 100 years before bar and point-and-figure charts were developed in Western markets.
Candlesticks are formed by showing a candle “body,” a solid area between the opening and closing price, and “wicks,” which represent the high and low. Sometimes a solid candle can form when the open was the low and the close was the high, and thin candles with less solid body can form when a price is volatile and varies a lot during the day.
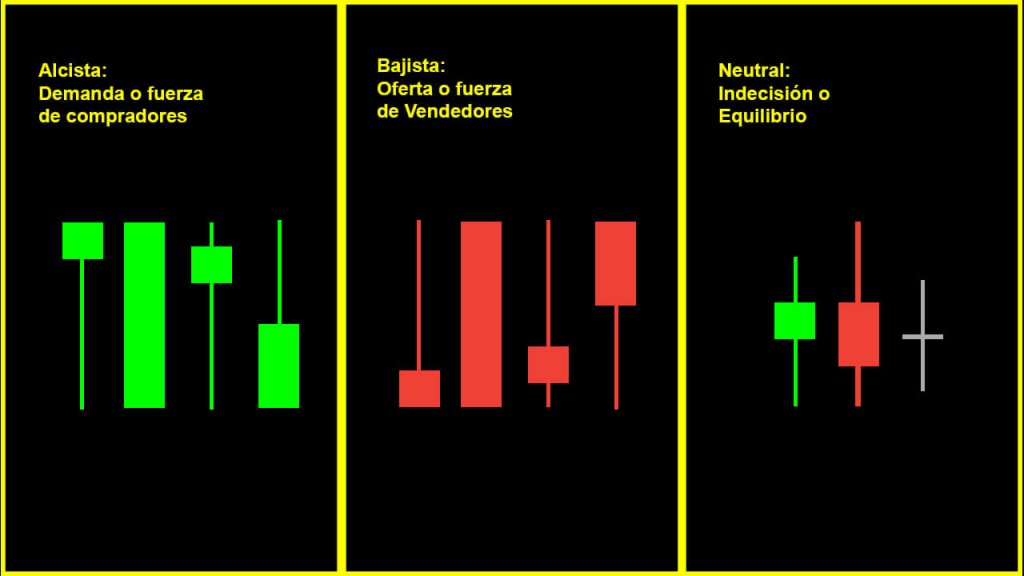
Candlestick charts capture not only the link between price and supply and demand, but also the emotions of traders. Investor excitement is highlighted by visually representing the size of price movements with different colors. A green candle is considered bullish because during that period the buyers are in control, while a red candle is considered bearish because during that period the bears or sellers are in control.
Candle Patterns
The foreign exchange market, or Forex, offers numerous opportunities for traders to take advantage of price movements. A key aspect of Forex trading is the ability to analyze and interpret price charts. A popular approach in chart analysis is the use of candlestick patterns, which provide visual signals that can help traders make informed decisions.
In this article we will present three of the best Forex candle patterns from a backtest of candle patterns spanning several decades and which have proven to be effective in recognizing potential trading opportunities and will give very good opportunities to enter on the market in 2024.
By mastering these powerful candlestick patterns, traders can greatly improve their ability to make well-informed trading decisions and improve their overall performance in the Forex market.
Top 3 Forex Candlestick Patterns
Traditional advice on candlestick trading is often completely wrong when trading the markets. The reason for this is that each market behaves differently.
For example, the stock market has a bullish bias, which causes candlestick patterns to act differently than the forex or commodity market. See for yourself by opening a stock market chart and comparing it to a commodity index or an index from another market; It’s completely different.
This difference in behavior is the reason why candlestick pattern trading strategies are not applicable in all markets. You need to understand how these patterns work in your market; Now we will look at the three best Forex candle patterns ordered by their effectiveness and profit potential.
This potential represents how much money a Forex trader would have historically made trading the patterns in the manner described. For example, the stalled pattern has an edge of 1.80, meaning they would have earned $1.80 for every dollar risked.
Stalled Pattern
-
Advantage: 1.80
-
Profit percentage: 47%
-
Risk-Reward: 1:5
The stalled pattern is traditionally considered a reversal pattern that indicates a possible end of an uptrend. It will be represented in the trading Japanese candlestick charts as follows:
-
Three consecutive bullish candles closing higher consecutively.
-
The first candle is bullish and long.
-
The second candle is bullish and long, with little to no upper shadow opening within or near the previous real body.
-
A third candle is small, bullish and rests on the shoulder, moving around the close of the previous one.
-
The stalled pattern must occur in an uptrend.
The stalled pattern has high profitability in the forex market.
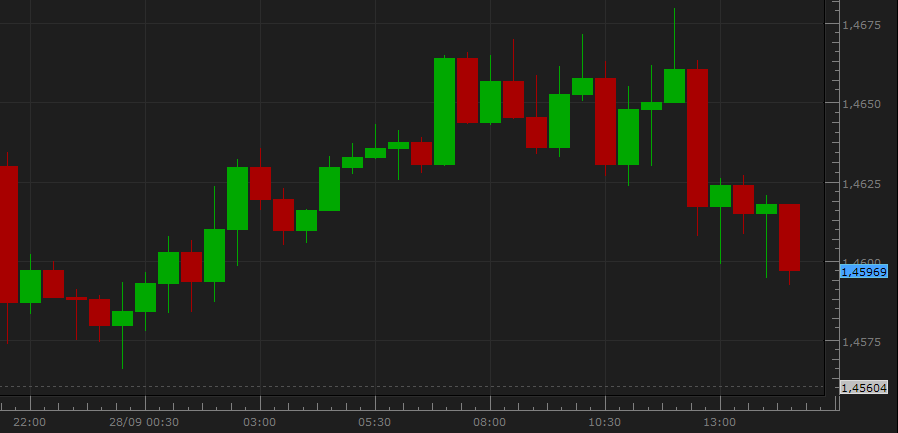
forex traders should go short on the break of the low of the third candle and set a stop loss above the high of the same candle. Let’s see how such a situation develops in the following image:
In the example above, we see that prices move down after breaking the low, leading to a profitable trade. Based on the average after 5,836 trades, the movement persists and smart traders should take profits with a risk-reward ratio of 1:5.
Bearish Belt Hold Pattern
-
Edge: 1.27
-
Profit percentage: 38%
-
Risk-Reward: 1:5
The bearish Belt Hold pattern consists of a candle with a long real body with little or no upper shadow in an uptrend.
-
The candle should be bearish with a long real body.
-
There should be little or no top shadow.
-
The pattern must occur during an uptrend.
The data shows that smart traders should do the opposite of conventional wisdom (or what most people do) and use this pullback to go long.
The best setup to use this candlestick pattern is to go long (buy) on the closing break with a stop loss below the minimum, hoping to earn $1.27 for every $1 risked.
Bullish Belt Hold Pattern
-
Edge: 1.29
-
Profit percentage: 38%
-
Risk-Reward: 1:5
The bullish Belt Hold pattern is the opposite of the bearish Belt Hold pattern. It consists of a bearish candle with a long real body with little or no lower shadow that occurs in a downtrend.
-
The candle should be bullish with a long real body.
-
There should be little or no bottom shadow.
-
There should be a top shadow.
-
The bullish Belt Hold candlestick pattern should occur during a downtrend.
When the pattern is identified, data-driven Forex traders who short (sell) the belt hold breakout place their stop loss above the high. The signal usually appears within the next three days. It is a very good candle pattern in favor of the trend.
This optimal setup yields 29 cents for every dollar risked.
Importance of wicks and bodies
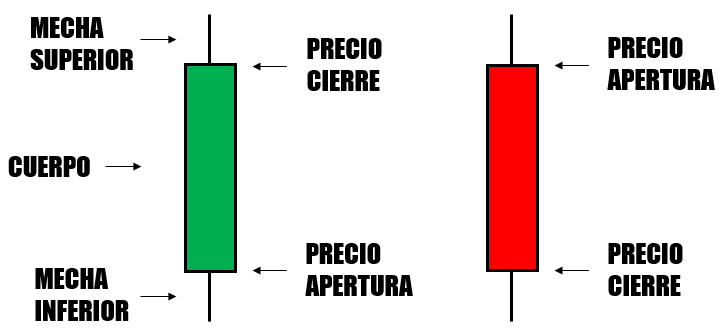
In the world of Forex trading, understanding candlestick patterns is essential to making well-informed decisions. A crucial aspect of these patterns are the wicks and bodies of the candles. The body of a candle represents the difference between the opening and closing price of a particular time period, while the wicks, also known as shadows, indicate the highest and lowest prices during that time.
Candlesticks with a long green body indicate strong bullish sentiment, as the closing price is significantly higher than the opening price. In contrast, a long red body demonstrates strong bearish sentiment, with the closing price considerably lower than the opening price. Short bodies, whether green or red, show more neutral sentiment as the price difference between the open and close is significantly smaller.
The upper and lower wicks provide more information about market behavior. A long low wick indicates that the price has fallen during the forex chart time period, but has managed to recover at the end. Typically, this suggests a possible reversal from a downtrend to an uptrend. On the other hand, a long upper wick shows that the price has increased over the time period but has fallen again, indicating a possible reversal from an uptrend to a downtrend.
A small green body with a long lower wick can be particularly significant as it demonstrates buying pressure in the market even though the closing price remains close to the opening price. On the contrary, a long red candle with a long upper wick indicates strong selling pressure despite the minimal difference between the opening and closing prices.
In conclusion, understanding the importance of wicks and bodies in candlestick patterns is essential for traders to make well-informed decisions. These elements provide valuable insight into market dynamics and can help identify potential reversals or continuation patterns. A safe, informed and clear analysis of candlestick patterns, including wicks and bodies, can greatly benefit Forex traders in their decision-making process this year 2024.
Reversal Patterns and Continuation
Reversal and continuation patterns are essential tools for Forex traders as they help identify potential trend reversals and continuation of existing trends. Both types of patterns can be found in bullish and bearish market conditions, making them versatile for different trading situations.
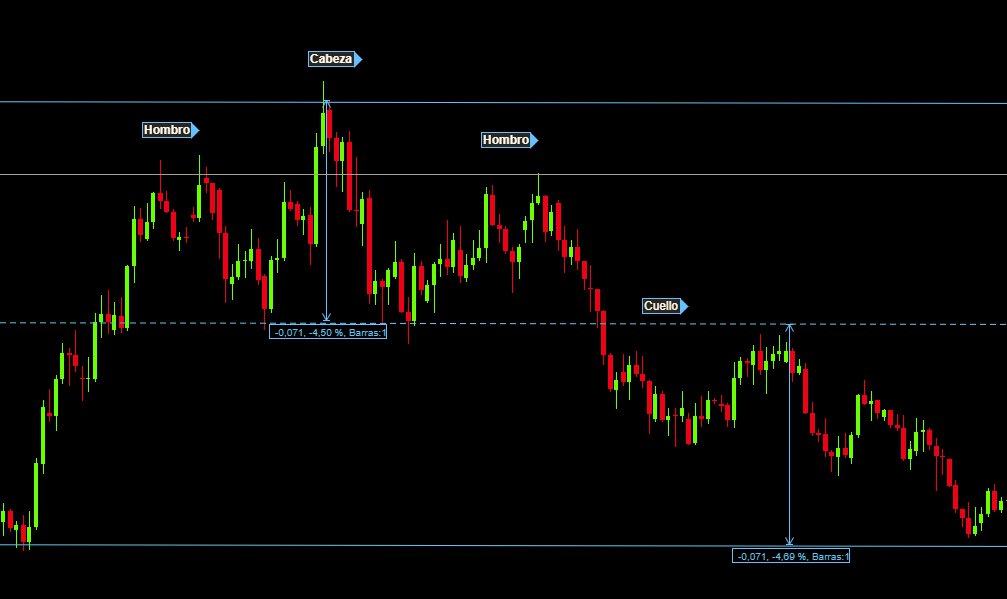
Reversal patterns signify a potential change in the current trend, either from bullish to bearish or from bearish to bullish. These patterns occur when buying or selling pressure changes significantly, indicating a change in market sentiment. Common reversal patterns include the Shoulder-Head-Shoulder pattern, double top, and double bottom. These patterns often form nearby support and resistance levels, as traders tend to place their orders around these strategic price points.
On the other hand, continuation patterns suggest that the prevailing trend will likely persist. These patterns indicate a pause or consolidation in the current trend before it resumes its initial direction. Examples of continuation patterns are triangles, wedges, and flags. These patterns usually form when traders take a breather and evaluate the market before adding more positions in the direction of the trend.
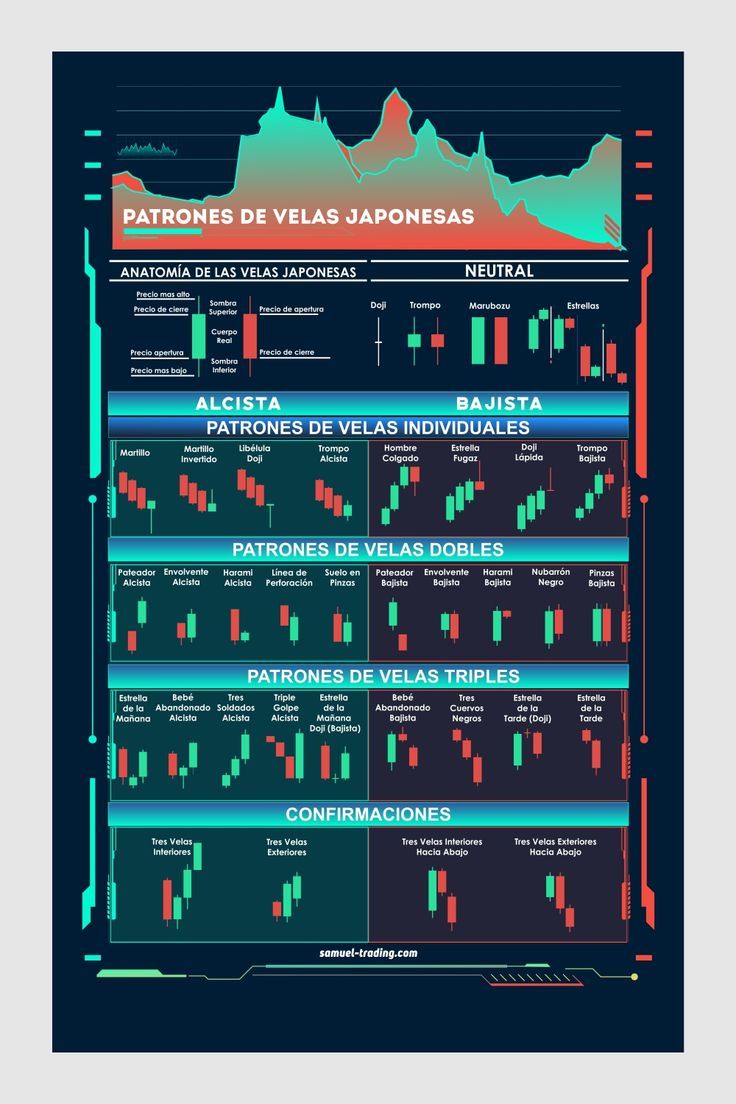
Bullish candle patterns indicate the possibility of an increase in price, while bearish candle patterns indicate the possibility of a downward movement. Some examples of bullish patterns include the Hammer and Morning Star formations, while bearish patterns often feature formations such as Shooting Star and Evening Star. These patterns can provide traders with valuable information about the direction of the market, allowing them to make well-informed decisions in your trading strategies.
In conclusion, understanding reversal and continuation patterns, as well as bullish and bearish candlestick formations, is essential for Forex traders. By becoming familiar with these patterns, traders can more accurately assess market sentiment, effectively manage risk, and make better-informed trading decisions.
Conclusion
All in all, these three candlestick patterns, when correctly identified, can be extremely useful for investors. Although many believe that patterns are starting to lose their accuracy in the modern forex market, several patterns are still reliable for predicting price movements. This is why understanding candlestick patterns remains important for Forex traders.
Let’s end this article with this: If Forex charts told the story of every currency pair, candles would be the words and candle patterns would be the sentences
FAQ
What are the most reliable candle patterns for Forex trading?
There are numerous candlestick patterns that traders use when trading the forex market, but some of the most reliable include the morning star and evening star patterns. , which indicate trend changes. Other reliable patterns include the hammer and inverted hammer, the engulfing pattern, and the harami pattern.
How do candle patterns help when making trading decisions?
Candlestick patterns provide visual representations of market psychology and can help traders understand the balance between supply and demand forces. These patterns allow traders to make informed decisions by identifying potential trend reversals, support and resistance levels, and entry or exit points.
Which patterns are best for identifying trend changes?
Some of the best patterns for identifying trend changes are the morning star and the evening star, which indicate potential changes in the overall trend. The three black crows and three white soldiers patterns are also effective in detecting trend reversals as they indicate strong bearish and bullish momentum shifts, respectively.
What are the main candlestick patterns used in day trading?
In day trading, traders usually focus on shorter time frames and therefore rely on certain candle patterns that work well in these scenarios. Some of the main patterns used in day trading include the doji, spinning top, engulfing patterns, and harami patterns. These patterns can help traders identify market volatility, potential trend reversals, and breakout opportunities.
How can I combine candlestick patterns with other technical analysis tools?
Traders can combine candle patterns with various technical analysis tools to gain additional confirmation of trading signals and improve their overall trading strategy.
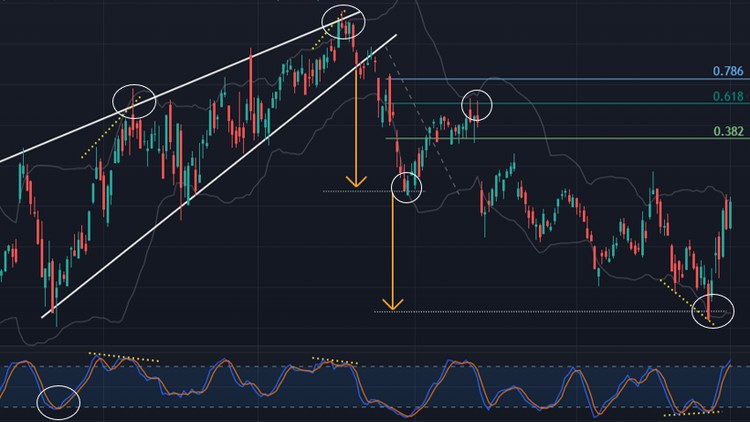
For example, they can use moving averages, trend lines, and support and resistance levels to validate or refute the signals generated by candlestick patterns. Additionally, incorporating oscillators such as the Relative Strength Index (RSI) can complement candlestick analysis by revealing overbought or oversold market conditions.
What are some simple techniques to improve my understanding of candlestick patterns?
To improve your understanding of Japanese candlestick patterns, you can follow several simple techniques. First, focus on mastering a few essential patterns before expanding to more complex ones. Second, practice identifying these patterns on historical charts to become familiar with their appearance and behavior. Finally, consider using a demo account to implement these patterns into your Forex strategy, allowing you to gain hands-on experience without risking real capital.
 GermanyUS