Analysis & Forecast
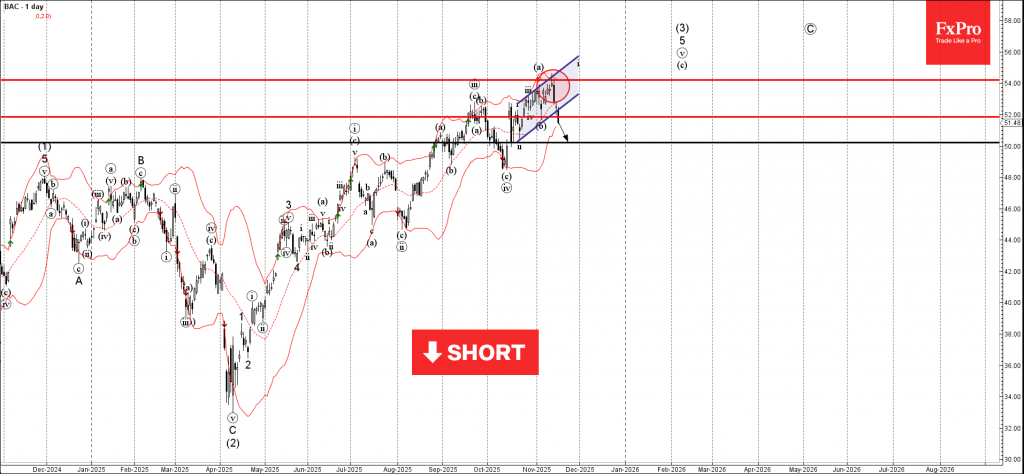
Bank of America: ⬇️ Sell– Bank of America broke support zone– Likely to fall to support level 50.00Bank of America recently broke the support zone between the key support level 52.00 (which stopped earlier wave (b)) and the support tr...
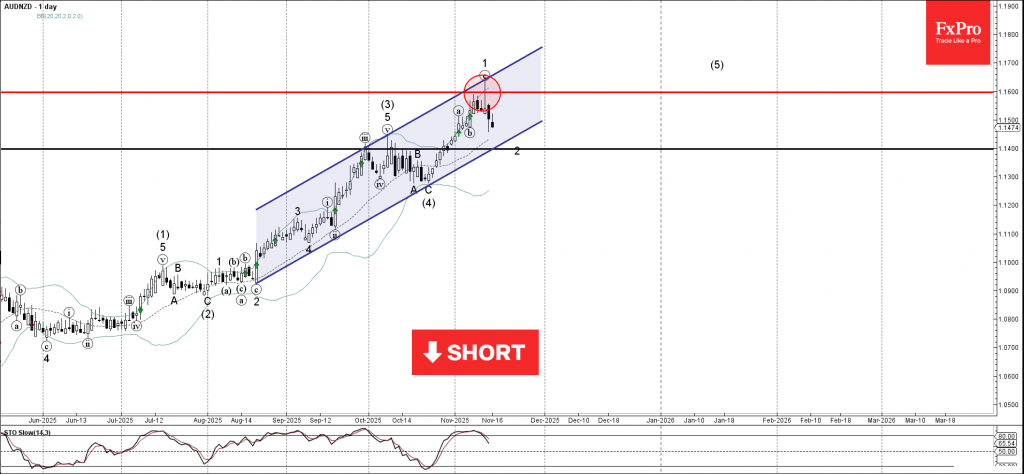
AUDNZD: ⬇️ Sell– AUDNZD reversed from resistance level 1.1600– Likely to fall to support level 1.1400AUDNZD currency pair recently reversed down from the key resistance level 1.1600, coinciding with the upper daily Bollinger Band and ...
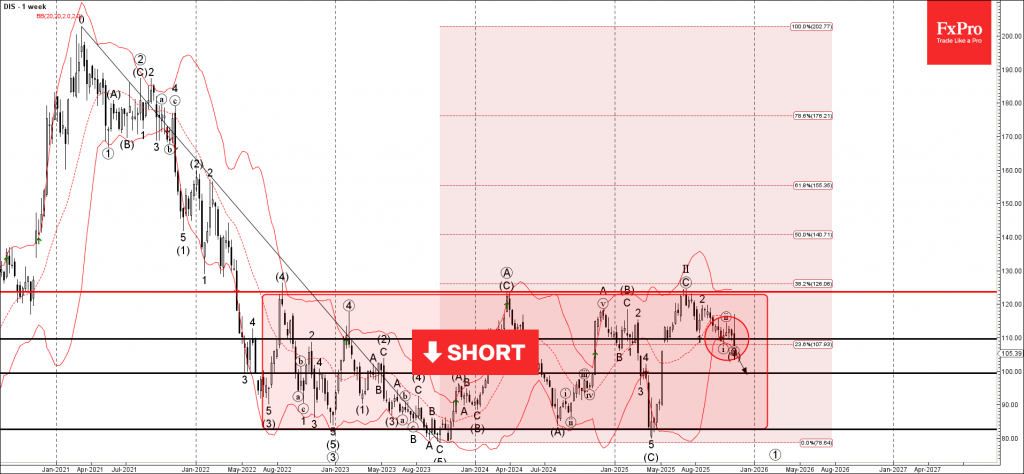
Disney: ⬇️ Sell– Disney falling inside impulse wave (1)– Likely to fall to support level 100.00Disney continues to fall inside the wide weekly sideways price range from the middle of 2022, as can be seen from the weekly Disney chart b...
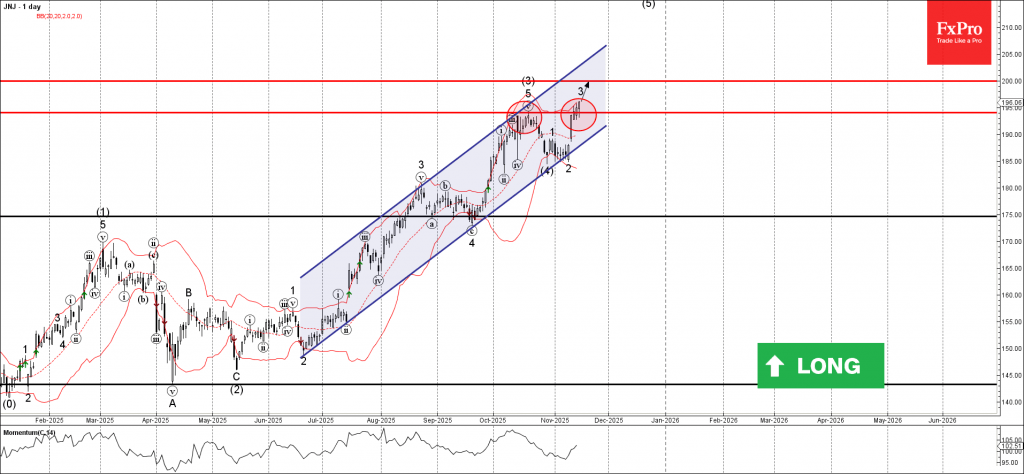
Johnson & Johnson: ⬆️ Buy– Johnson & Johnson broke pivotal resistance level 194.00– Likely to rise to resistance level 200.00Johnson & Johnson recently broke above the pivotal resistance level 194.00, which stopped the pre...
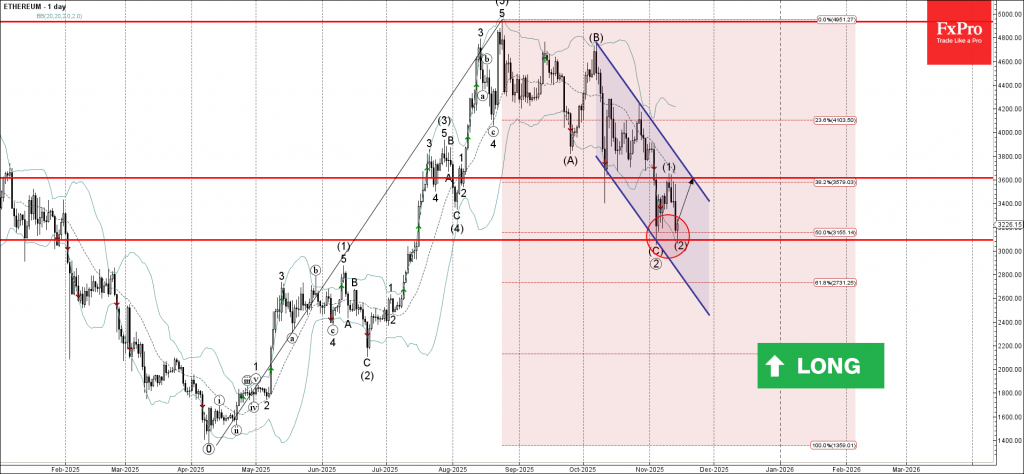
Ethereum: ⬆️ Buy– Ethereum reversed from support zone– Likely to rise to resistance level 3600.00Ethereum cryptocurrency recently reversed from the support area between the support level 3090.00 (which stopped the previous impulse wav...
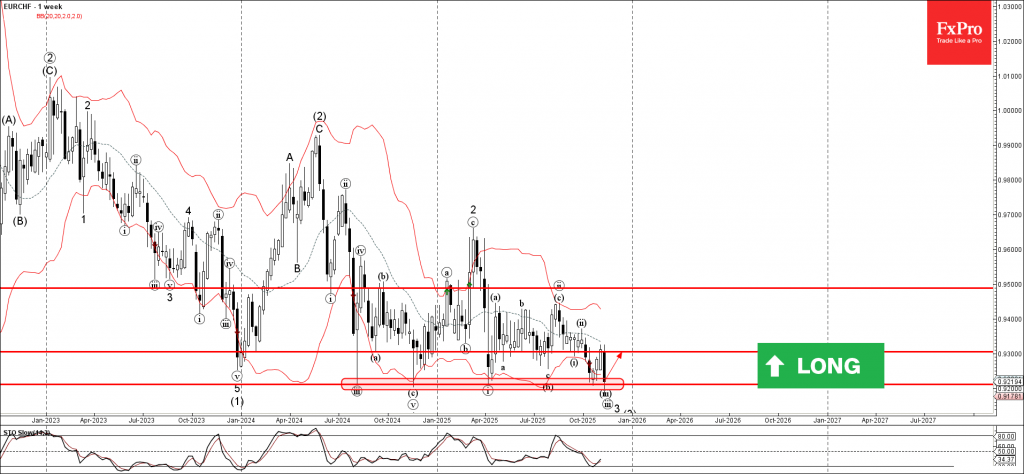
EURCHF: ⬆️ Buy– EURCHF reversed from support zone– Likely to rise to resistance level 0.9300EURCHF currency pair recently reversed from the support zone between the long-term support level 0.9210 (which has been reversing the price fr...

Tesla: ⬇️ Sell– Tesla broke support zone– Likely to fall to support level 380.00,Tesla recently broke the support zone between the support level 415.00 (which has been reversing the price from September) and the 38.2% Fibonacci correc...

Silver: ⬇️ Sell– Silver reversed from resistance zone– Likely to fall to support level 50.00Silver recently reversed from the resistance zone between the strong resistance level 54.00 (stopped the previous sharp impulse wave (5) in Oc...
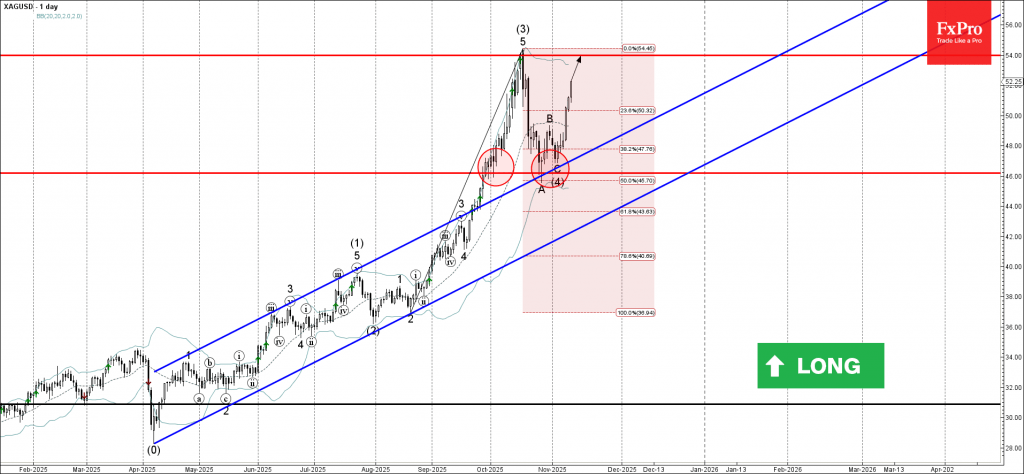
Silver: ⬆️ Buy– Silver broke round resistance level 50.00– Likely to reach resistance level 54.00Silver continues to rise inside the intermediate impulse wave (5), which started earlier from the support zone between the support level ...
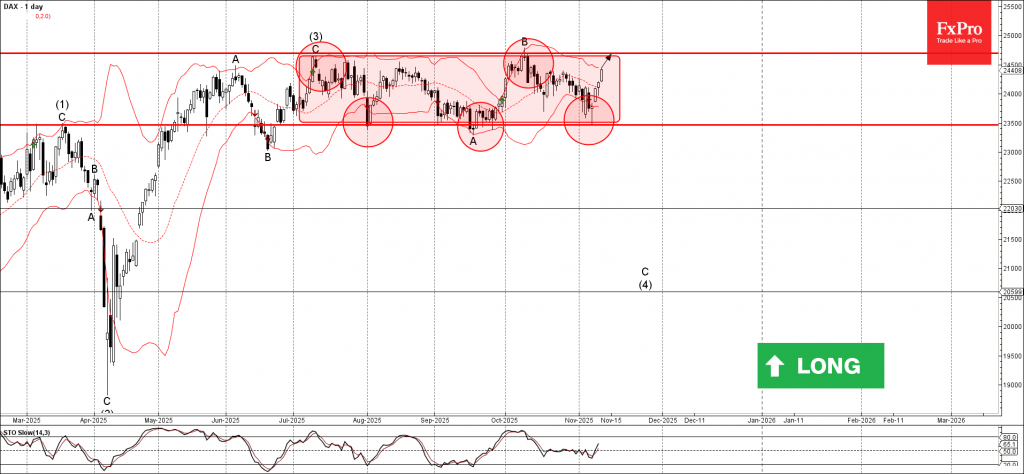
DAX index: ⬆️ Buy– DAX index reversed from support level 23500.00– Likely to rise to resistance level 24695.00DAX index recently reversed with the daily Hammer from the support level 23500.00 (lower border of the sidewa...

 روبوفوريكس
 إكسنس
إكسنس فكسرو
فكسرو ألفا فوركس
 ليبيرتكس
 FxGlory
 XM
XM أسواق آي سي
