Analysis & Forecast
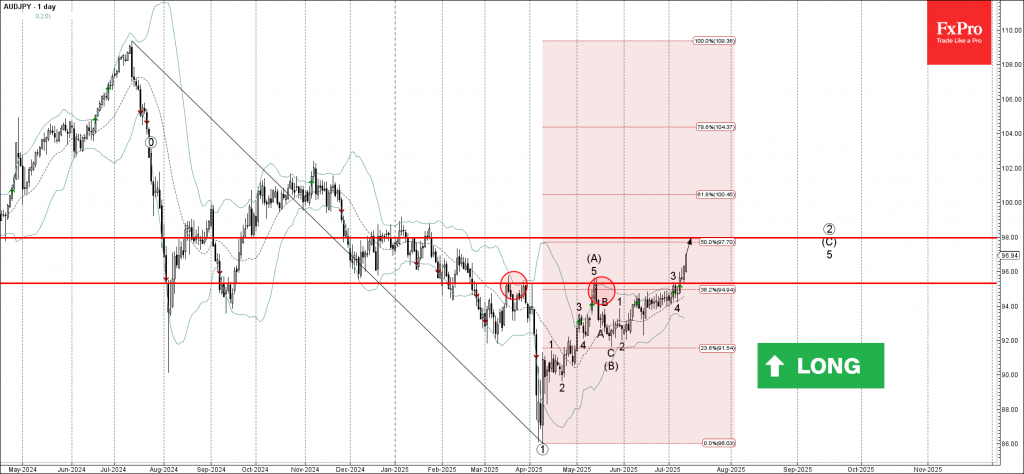
AUDJPY: ⬆️ Buy– AUDJPY broke resistance zone– Likely to rise to resistance level 98.00AUDJPY currency pair recently broke the resistance zone between the resistance level 95.30 (which has been reversing the price from March) and the 3...
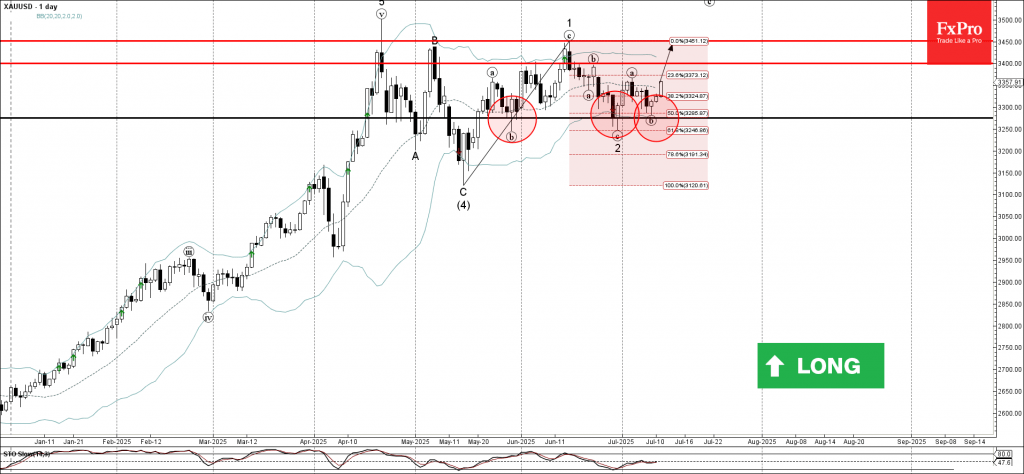
Gold: ⬆️ Buy– Gold reversed from support zone– Likely to rise to resistance levels 3400.00 and 3450.00Gold recently reversed up from the support zone between the strong support level 3275.50 (which has been reversing the price from Ma...
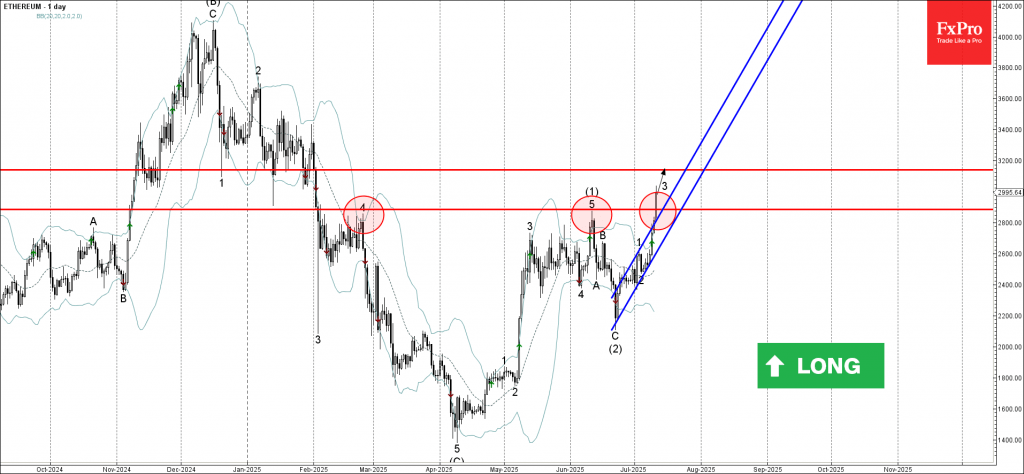
Ethereum: ⬆️ Buy– Ethereum broke resistance zone– Likely to rise to resistance level 3140.00Ethereum cryptocurrency recently broke the resistance area lying at the intersection of the key resistance level 2885.00 (which has been rever...
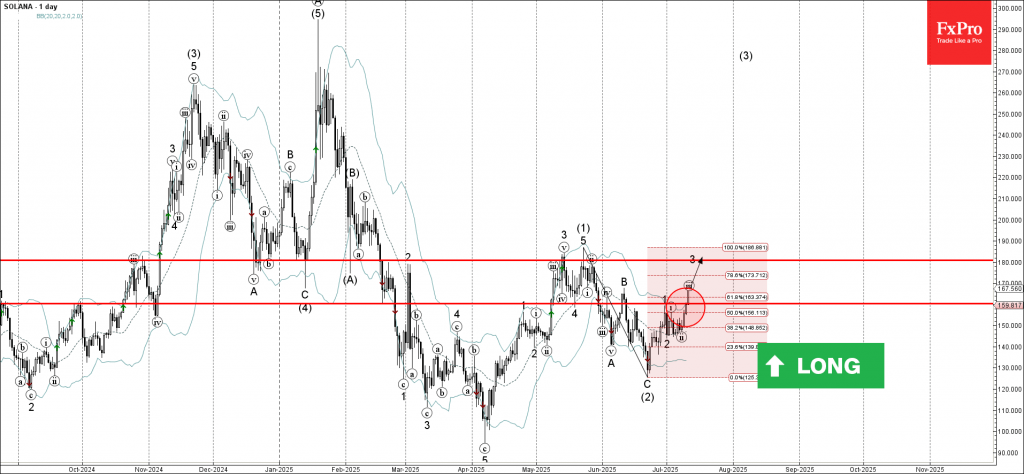
Solana: ⬆️ Buy– Solana broke resistance zone– Likely to rise to resistance level 180.00Solana cryptocurrency recently broke the resistance zone between the resistance level 159.80 (which has been reversing the price from the start of ...
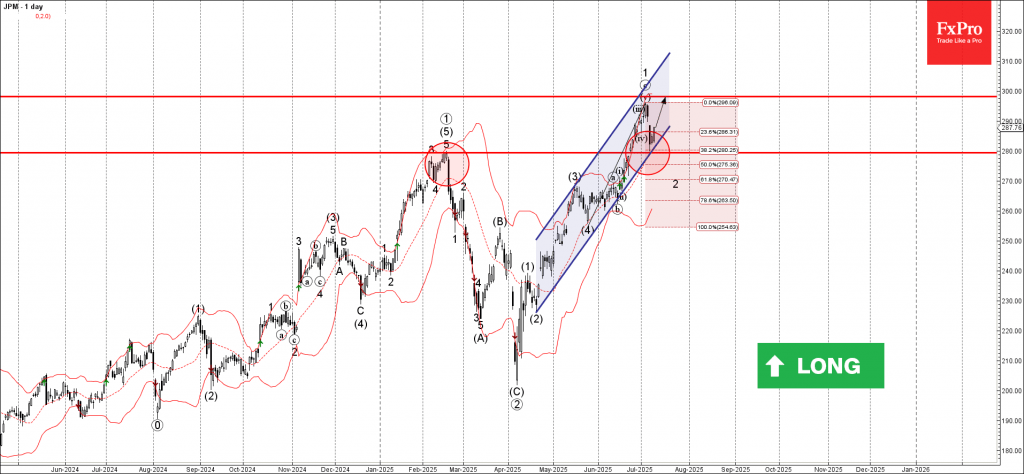
JPMorgan Chase: ⬆️ Buy– JPMorgan Chase reversed from support zone– Likely to rise to resistance level 296.00JPMorgan Chase recently reversed up from the support zone between the support level 280.00 (former multi-month high from Janua...
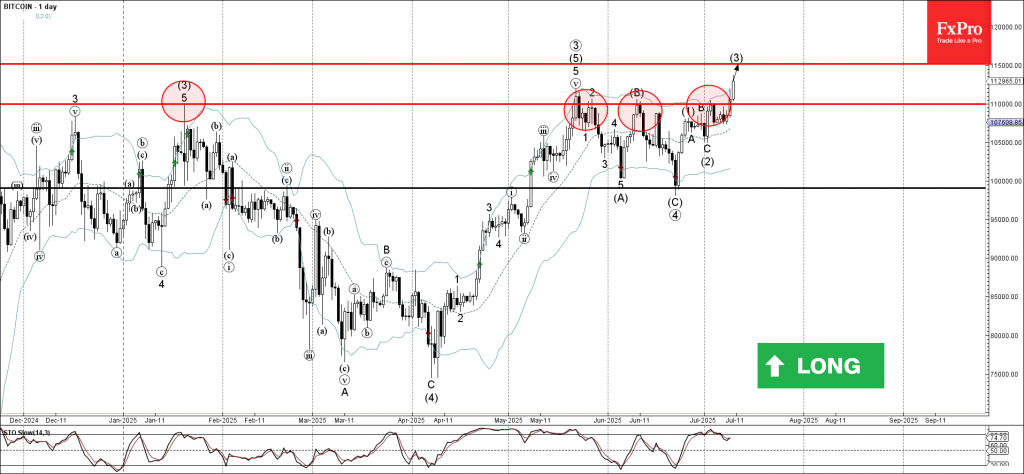
Bitcoin: ⬆️ Buy– Bitcoin broke round resistance level 110000.00– Likely to rise to resistance level 115000.00Bitcoin cryptocurrency recently broke the round resistance level 110000.00 (which stopped multiple upward impulse waves ...
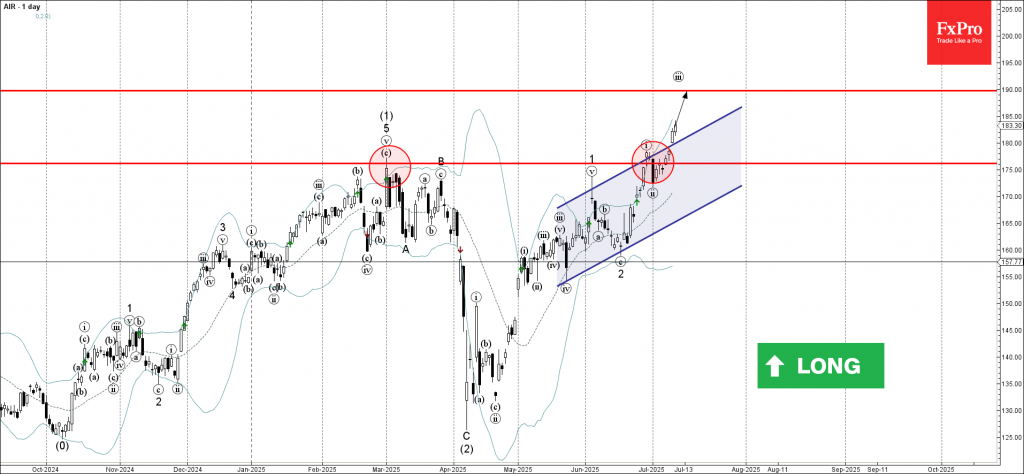
Airbus: ⬆️ Buy– Airbus broke resistance zone– Likely to rise to resistance level 190.00Airbus recently broke the resistance zone lying between the resistance level 175.00 (which started the earlier sharp downward correction ...
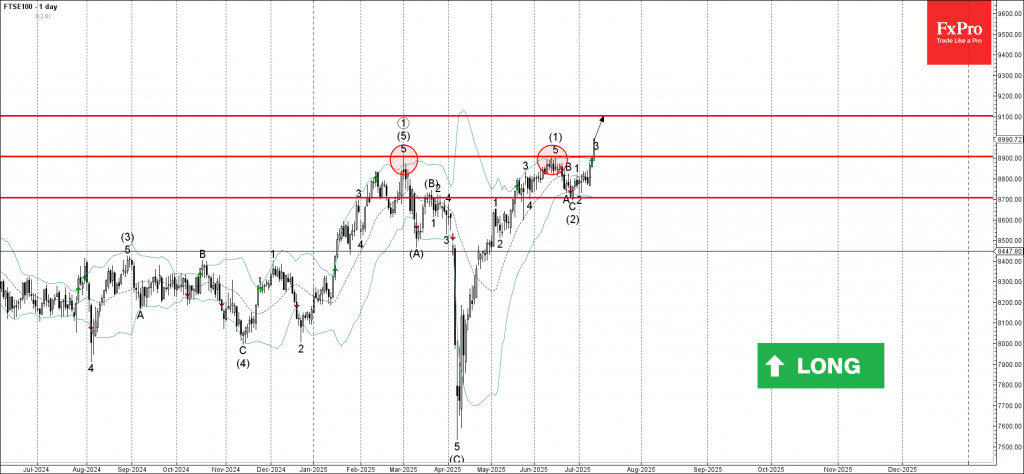
FTSE 100: ⬆️ Buy– FTSE 100 broke key resistance level 8900.00– Likely to rise to resistance level 9100.00FTSE 100 index recently broke above the key resistance level 8900.00 (which has been reversing the price from March, as can be se...
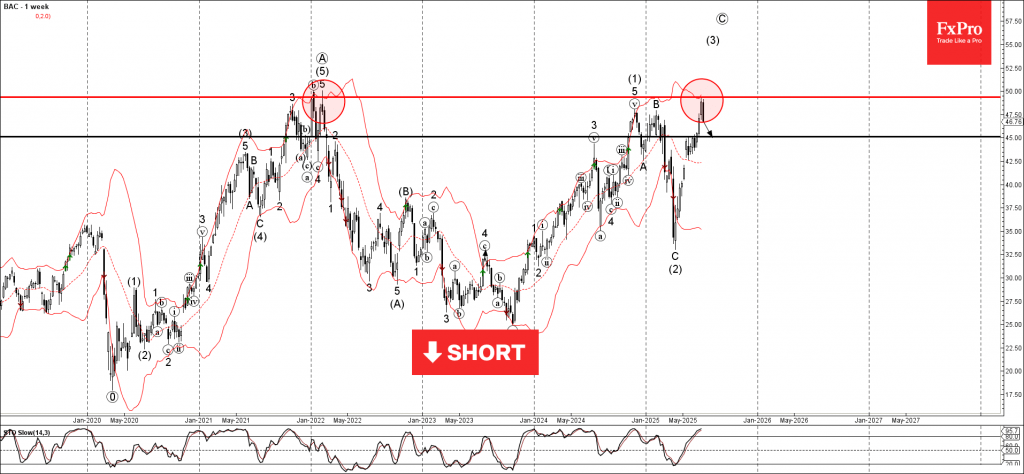
Bank of America: ⬇️ Sell– Bank of America reversed from resistance area– Likely to fall to support level 45.00Bank of America recently reversed down from the resistance area located between the long-term resistance level 50.00 (which ...
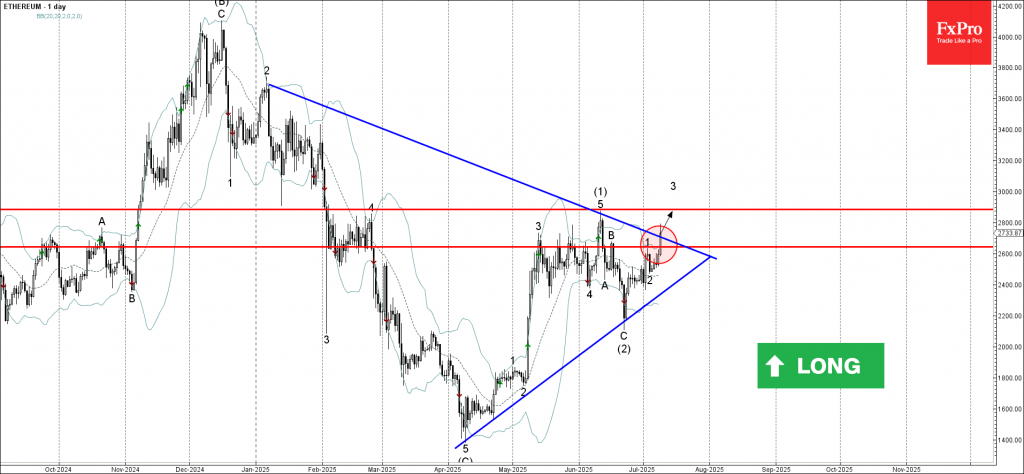
Ethereum: ⬆️ Buy– Ethereum broke the resistance area– Likely to rise to resistance level 2885.00Ethereum cryptocurrency recently broke the resistance area located between the resistance level 2645.00 (which stopped wave 1 at the start...

