 AXITrader
Headline inflation climbs 0.1%, while the core rate rises 0.3% month-on-month
The seasonally-adjusted consumer price index for all urban consumers (CPI-U) rose 0.1% in November, from 0 the month earlier, the Bureau of Labor Statistics said on Tuesday. Economists expected consumer prices to remain unchanged month-on-month. The headline price index rose 3.1% for the year, slightly below October’s 3.2% mark, in line with Street estimates. Meanwhile, setting aside the volatile food and energy prices, the so-called core consumer inflation rose 0.3% in November and 4.0% year-on-year, the Labor Department said.
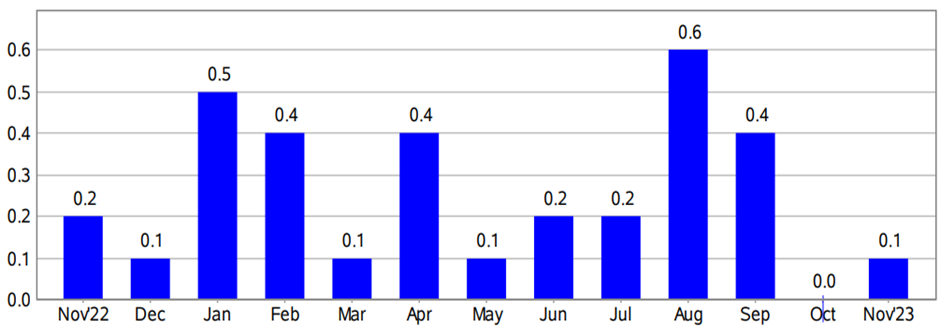
Source: US Bureau of Labor Statistics
The surprise increase in consumer prices came despite a drop in the cost of gasoline, which was offset by the higher cost of rentals. In addition, the uptick in the consumer price index comes after Friday’s higher-than-expected payroll figures and a firmer unemployment rate, all indicating that inflation is not falling quickly enough for the Fed to pivot to interest rate cuts as early as March next year, as some analysts predicted.
Fed officials are meeting for the last time this year and are expected to leave policy rates unchanged at 5.25%-5.50% on Wednesday, and although most economists believe that the Fed has reached the end of its tightening cycle, they have also deferred the timing of the interest rate cut next year. According to the CME Group’s FedWatch Tool, traders have pushed back the expectations of a rate cut from March to May following the consumer inflation report.
Key highlights of the consumer price index report
The November CPI report released by the Bureau of Labor Statistics showed the energy index fell 2.3% month-on-month amid a 6.0% plunge in the gasoline index, which more than offset the surge in other energy component indexes. On the other hand, the food index rose 0.2% from a 0.3% gain in October, led by a 0.4% increase in the index for food away from home. In addition, the shelter index, which accounts for a third of the weightage in the consumer index, climbed 0.4% last month from 0.3% in October, led by a 0.5% increase in the index for rent. The index jumped 6.5% over the previous 12-months, accounting for about 70% of the total gains in the core consumer price index. The other indexes that rose over the past 12 months include motor vehicle insurance (19.2%), personal care (5.2%), recreation (2.5%), and new vehicles (1.3%).
Among the decliners in November, the index for apparel was down 1.3%, the index for household furnishings and operations dropped 0.4%, and the index for communication fell 0.6%. The other indexes include recreation, airline fares, and new vehicles.
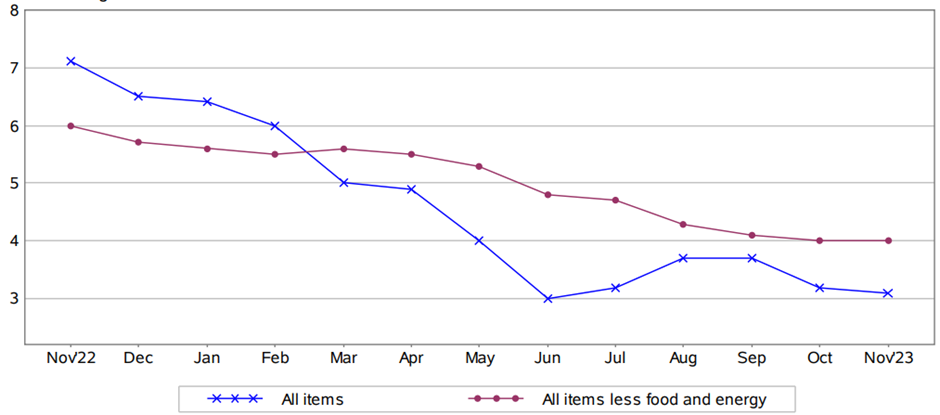
Source: US Bureau of Labor Statistics
Economists’ review of the November CPI data
Michael Pierce, the lead US economist at Oxford Economics, believes core inflation is very high and will not prompt the Fed to pivot to rate cuts anytime soon.
Lisa Sturtevant, the chief economist at Bright MLS, thinks falling inflation does not reflect a drop in prices since the cost of almost everything is still higher than during the pandemic period. She believes housing costs, in particular, are impacting individuals and families.
Kurt Rankin, the senior economist at PNC Financial, is of the view that housing prices and their influence on inflation should be taken into account while considering expectations of monetary policy easing. He does not expect the Fed to cut rates until inflation drivers are under control.
Market reaction to the consumer price index news
US stock benchmarks wavered after the release of the November CPI report before ending Tuesday’s session with gains. The Dow Jones Industrial Average rose 0.48% to 36,577.94, the S&P 500 added 0.46% to close at 4,643.70, and the Nasdaq 100 surged 0.82% to settle at 16354.25. All three indices closed at fresh 2023 highs as investors await the Federal Reserve’s interest rate announcement on Wednesday afternoon on the back of higher-than-expected November nonfarm payrolls and CPI data.
Inflation remains above the Federal Reserve’s target of 2%, but the US central bank is widely expected to leave borrowing costs unchanged at more than two-decade highs of 5.25%-5.50%.
Investors firmly believe that central bank policymakers are done raising rates this cycle but will be keenly watching Fed Chair Jerome Powell’s press conference, waiting to hear if he talks about a conceivable timeline for the Fed to start cutting rates, which should help drive the markets sharply one way or the other.
Treasury yields fell on Tuesday as investors analyzed the latest consumer inflation report and awaited the outcome of the Federal Reserve’s last monetary meeting this year and Chair Jerome Powell’s press conference. The 2-year T-note closed at 4.735%, down 2.9 basis points, while the yields on the 10-year T-note and 30-year T-bond slid 3.2 basis points to 4.204% and 1.6 basis points to 4.312%.
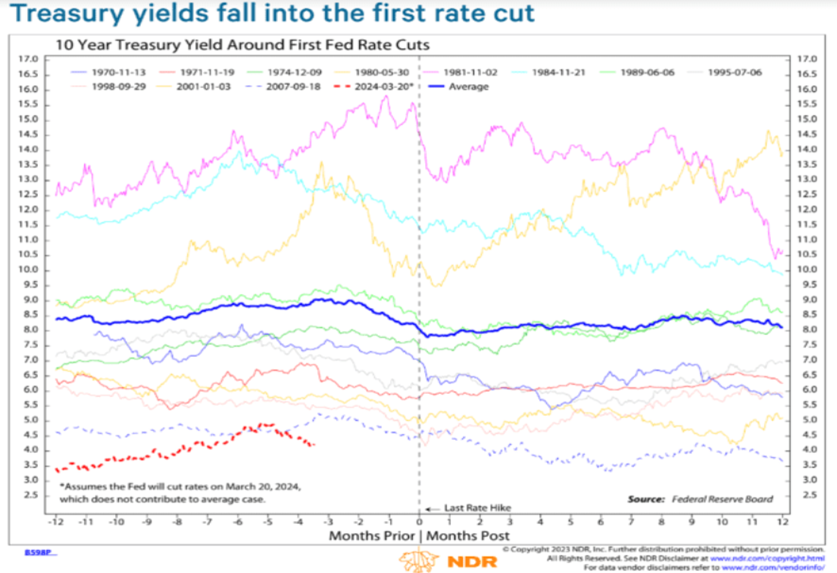
According to the chief global macro strategist at Ned Davis Research, Joseph Kalish, 10-year Treasury yields have dropped in the months leading to a Fed pivot toward interest rate cuts. He tracked the path of the benchmark rate during the previous easing cycles and found that yields tend to pull back about three months before the Fed pivots to rate cuts. His research goes as far as the 1970s.
The 10-year Treasury yield is the most widely tracked government debt security, with its yield often used as a benchmark to determine interest rates on corporate loans, mortgage loans, and other debt instruments.
Source: MarketWatch
The US dollar slipped against its counterparts in the dollar index on Tuesday amid expectations that the increase in nonfarm payrolls and the uptick in consumer inflation will not push the Fed to lift interest rates on Wednesday. The US dollar index, a trade-weighted average comprising a basket of six currencies pitted against the greenback, retreated 0.22% to 103.86 on Tuesday after two successive winning sessions.
The pullback in the index comes on the back of a moderate uptick in the US CPI figures for November, which has reinforced market expectations that the massive rate hikes by the Federal Reserve is gradually driving inflation lower. However, the near-medium-term outlook for the dollar’s trajectory will depend on today’s policy statement and Fed Chair Jerome Powell’s projection of the monetary policy path.
Technical View
Broadcom Inc (AVGO)
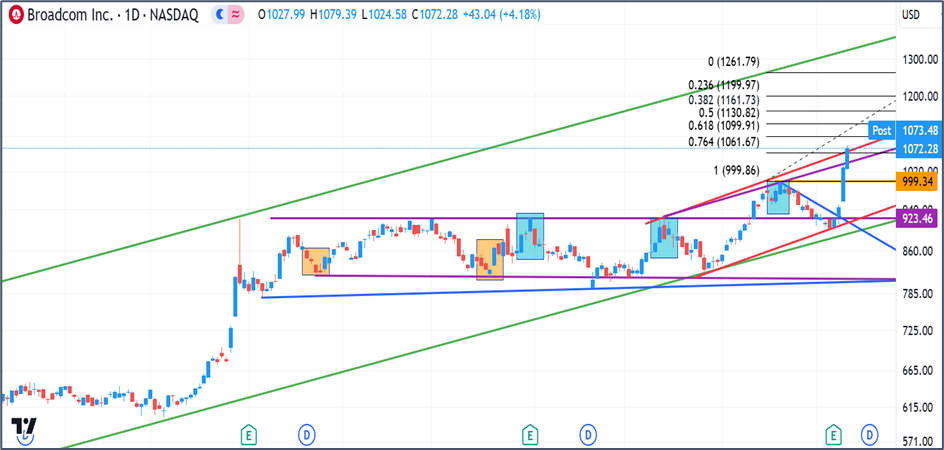
Broadcom extended last week’s rally to close at $1072.28 on Tuesday, up 4.18% for the day. Shares of the global tech giant jumped about 19% in the last four trading sessions to register fresh all-time highs over the previous two trading sessions, driven by a host of rating upgrades after the company’s fourth quarter and fiscal year results beat Street expectations. In addition, Broadcom forecasts revenue of $50 billion in fiscal 2024, sharply higher than the $35.819 billion it delivered in the current fiscal.
On charts, the semiconductor giant has broken through a series of resistances, and if the stock holds on to the recent gains, the rally could extend to $1330-$1350 over the next few weeks. The near-term resistance is placed in the $1100-$1130 band (Fibonacci levels), with the medium to long-term target at $1340-$1350. The immediate support is in the $1050-$1075 range, and a close below could push the stock back to the recent breakout level of $1000.
Buy the stock in the $1050-$1075 range, with a stop loss at $1030 for a profit target of $1130. Medium to long-term investors can hold the stock until it hits the primary bullish channel at $1340-$1350.
Broadcom Inc- Daily chart
Click the link to view the chart- TradingView — Track All Markets
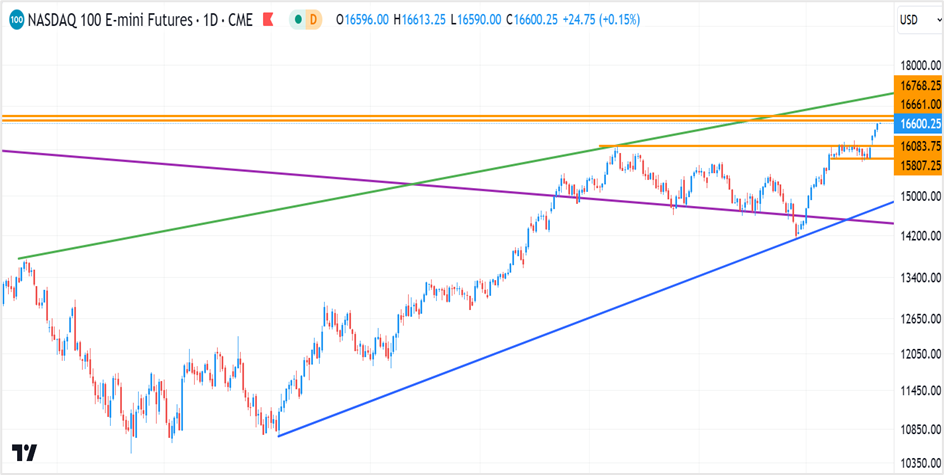
Nasdaq 100 e-mini March 2024 futures (NQH24)
Nasdaq futures closed at 16575.50 on Tuesday, up 0.76% for the day. The index futures is on track to register the seventh consecutive weekly gain, the first since March 2021, and is closing toward the all-time high of 16767.50 seen on November 22nd, 2021.
The near-term resistance is in the 16660-16770 range, and a close above the higher end of the band could see the index futures rally to 17300 very quickly. On the downside, the support is placed in the 15800-16100 range, which should hold for now.
Go long if the Nasdaq futures close above 16770 or break 16820. Place a stop loss at 16600 for a target of 17250-17300. Long positions can also be initiated if the index futures slip to 15800-16100. Place a stop loss at 15750 and exit as the index futures approach 16600.
Nasdaq 100 e-mini March 2024 futures- Daily chart
Click the link to view the chart- TradingView — Track All Markets