 Alpari
 XM
XMEquities plunge, bond yields and the greenback rise as rate cut hopes fade
The consumer price index in the US, a measure of prices paid by urban consumers for a basket of goods and services, rose 0.3% month-on-month in January, unchanged from the previous month amid higher shelter costs, the US Bureau of Labor Statistics reported on Tuesday. For the year, inflation slipped slightly from 3.4% in December to 3.1% last month. Economists forecast headline inflation to rise by 0.2% month-on-month and 2.9% annually.
Meanwhile, core inflation, a gauge of consumer inflation less food and energy prices, climbed 0.4% in January, up from 0.3% a month earlier and 3.9% annually, unchanged from the previous month, again beating economists forecasts of a 0.3% and 3.7% increase, respectively.
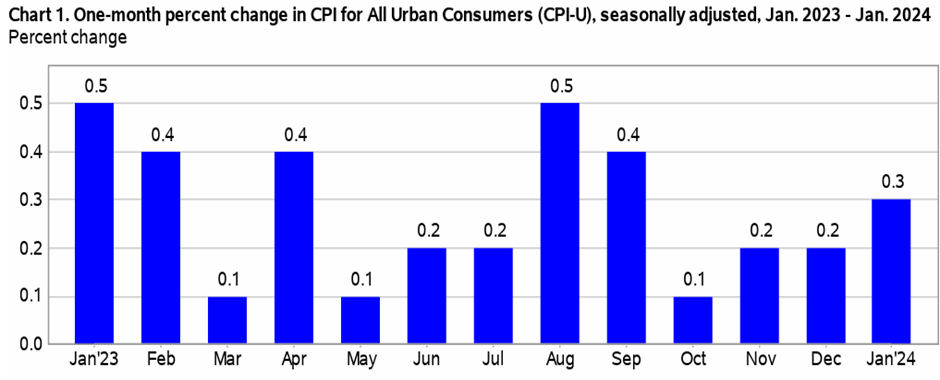
Source: US Bureau of Labor Statistics website
The consumer price index registered its sharpest increase in four months in January, primarily from a surge in shelter costs, which account for two-thirds of all items in the headline figure. The index advanced at the fastest pace since September 2023 amid a strong labor market and a resilient economy, denting hopes of an interest rate cut by the Federal Reserve anytime soon.
According to the CME FedWatch Tool, 62% of traders expect the Fed to maintain the status quo on rates in May after Tuesday’s consumer price report from 39.3% just a day earlier. Meanwhile, about 51% anticipate the US central bank to lower the benchmark interest rates in June.
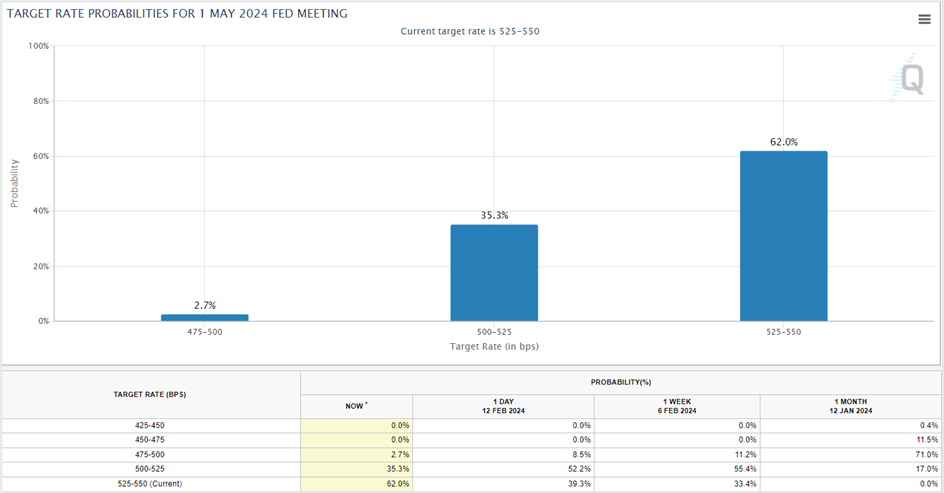
Source: cmegroup website
Key highlights of the Consumer Price Index report
The primary components of headline inflation, the shelter index, jumped 0.6% month-on-month in January, while the food index rose 0.4% and the energy index fell 0.9%. Over the past 12 months, the shelter index spiked by 6.0%, the food index surged by 2.6%, and the energy index fell by 4.6%.
Among the components of the shelter index, which accounts for two-thirds of the headline inflation figures, rent of primary residence contributed to a 0.4% increase in January, while owners’ equivalent rent of residences rose 0.6%.
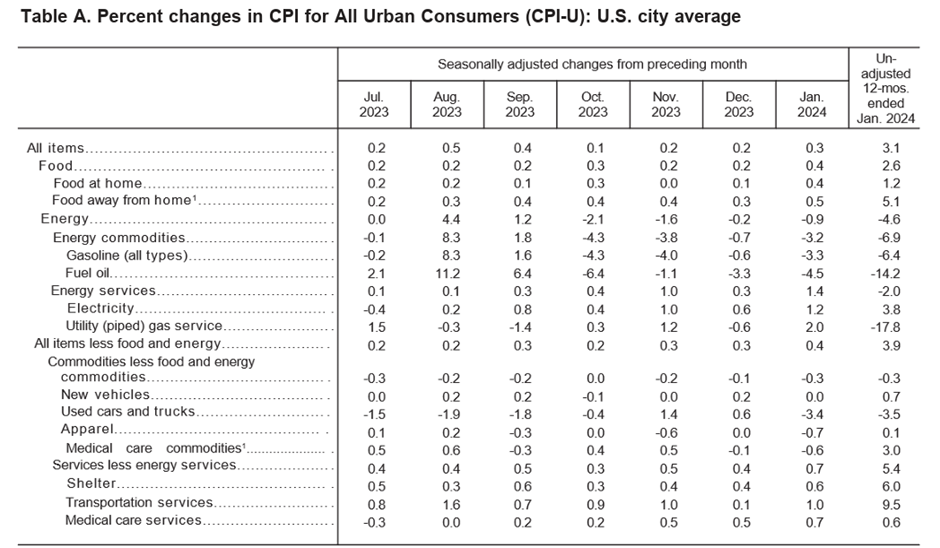
Source: US Bureau of Labor Statistics website
Economists review of the consumer inflation data
Seema Shah, the chief global strategist at Principal Asset Management, believes that the consumer inflation report by the Bureau of Labor Statistics is not something the markets or the Fed would have liked, but she cautions against jumping to the conclusion that inflation has re-emerged. In her view, a March rate cut is off the table, but if economic activity slows down from the past interest rate hikes, we still have a chance of the Fed pivoting in May.
Art Hogan, the chief market strategist at B. Riley Financial, said the hotter-than-expected consumer inflation was an excuse for investors to book profits from an overheated market. While the consumer price index data was slightly higher, there is enough proof that inflation is heading lower.
Kevin Gordon, the senior investment strategist with Charles Schwab, thinks the markets were in frothy territory, leading to the release of the January consumer price index data. He believes that the sticky portions keeping inflation high, such as shelter costs and the healthy labor market, will prompt Fed officials to hold on to higher interest rates for longer. He urges investors to believe policymakers when they say they will not resort to rate cuts until inflation moves toward their annual target of 2%.
Market reaction to the January consumer price index data
The US equities markets fell on Tuesday after the January consumer inflation figures quelled any hopes of a rate cut in March, even as most investors remained skeptical of the Fed pivoting to lower rates in May. The three major stock indices fell more than a percent, with the Dow Jones Industrial Average registering its biggest one-day percentage drop in nearly eleven months. The 30-share index closed at 38,272.75, down by 1.35%, while the benchmark S&P 500 settled 1.37% lower at 4,953.17, and the Nasdaq 100 fell by 1.58% to end Tuesday’s session at 17,600.42.
The higher-than-expected inflation figures have lowered the expectations of a rate cut in May and May, with most traders now anticipating the Fed to act in June. However, the stunning rebound in US equities on Tuesday is perplexing, with some analysts speculating that the US economy might be indicating that it does not need lower interest rates.
According to analysts from Goldman Sachs, the stock market rally has primarily been fired up by the Magnificent Seven tech giants- Apple (AAPL), Microsoft (MSFT), Meta Platforms (META), Alphabet (GOOG), Amazon (AMZN), Nvidia (NVDA), and Tesla (TSLA). These seven stocks together generated returns of about 76% last year, while the remaining 493 stocks in the S&P 500 returned a meager 14%. So far this year, the Magnificent Seven are up 8% compared to the 3% gains in the other S&P 500 stocks.
US Treasury yields climbed on Tuesday, with the yield on the 10-year Note surging to a two-and-a-half-month high. In contrast, the policy-sensitive 2-year Note rose to nine-month highs after the higher-than-expected consumer inflation reading pushed rate cut forecasts further this year. Traders now expect the Fed to lower rates in June than previous estimates of a 25-basis point cut in March.
At 3 PM Eastern time on Tuesday, the yield on the 2-year Note jumped 18.7 basis points to 4,654%, while the yields on the 10-year Note and 30-year bond climbed 14.5 and 9.6 basis points to 4.315% and 4.466%, respectively.
According to FedWatch, the solid labor market report in the first week of February and Tuesday’s upside surprise in consumer inflation have sharply lowered the rate cut expectations for 2024 from 160 basis points to below 90 basis points. This has impacted the interest rate decisions by central banks globally, with traders now expecting the Reserve Bank of Australia (RBA) to cut only once this year. Also, there is minimal scope for central banks from emerging economies to ease ahead of the Federal Reserve as it could lead to a sharp fall in the domestic currency against the US dollar.
The US dollar rallied to three-month highs against its counterparts in the dollar index (DXY) after the hot inflation data pushed back rate cut bets to June this year, driving demand for the greenback. The US dollar index closed at 104.96, up by 0.76% on Tuesday, with the greenback gaining 0.59% against the euro, 0.29% versus the sterling, and 0.96% vs. the Japanese yen. The US currency rose above 150 yen for the first time in nearly three months, spurring calls for an intervention in the event of a rapid, speculative decline in the Asian currency.
Meanwhile, Fed Funds Futures traders are pricing in a lower than 50% chance that the US central bank will pivot to lower interest rates in May and will continue monitoring comments from US central bank officials on their interpretation of the inflation report.
According to Kristoffer Kjaer Lomholt, the director for FX and rates strategy at Danske Bank, the greenback will remain strong in the near term due to the relatively higher interest rates in the US, and any correction in the risk assets will further add to dollar demand. He further said the bank holds long positions in the US currency against the euro, pound sterling, and the Norwegian krona.
Technical View
Dow Jones Industrial Average March futures (YMH24)
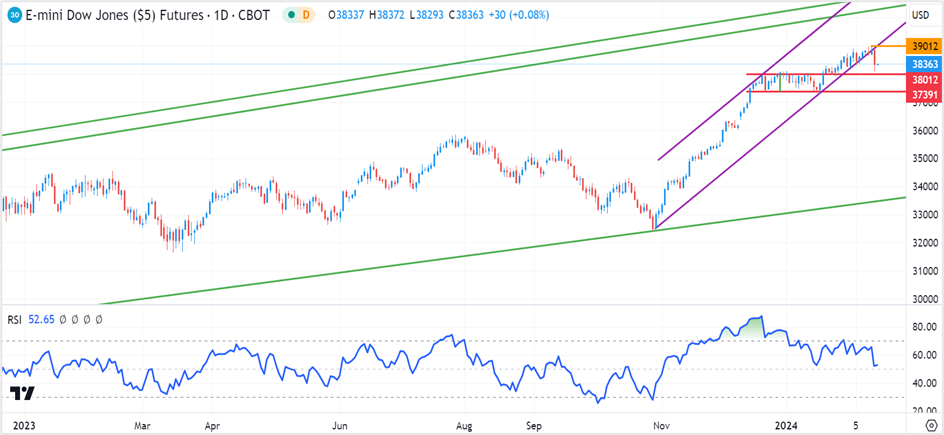
The 30-stock Dow Jones Industrial Average (DJIA) futures fell 1.42% on Tuesday to 38,333, closing at nearly a one-and-a-half-month low after the higher-than-expected consumer inflation data led to a selloff on Wall Street, with stocks falling across the board.
The index futures opened below the short-term trendline support and dived more than 1.5% toward the January 19th breakout level in the morning session before reversing some losses to end at nearly two-week lows.
The near-term support is at 38,012, and a close below the level could push the index futures back to the consolidation zone of 37,390-38,010. On the upside, the index futures should close above the recent all-time high of 39,012 to regain momentum, which would drive it all the way to 40,300-40,800.
Strategy:
Go long on Dow futures at 38,010, with a stop and reverse at 37,800 for a profit target of 39,000. If the stops are triggered, hold on to the short positions, with a stop loss at 38,100, and exit as the index futures approach 37,400.
You can also initiate long positions if Dow futures close above 39,012 or break 39,150. Maintain a stop loss at 38800 and exit as the index futures approach 40,300.
Markets will likely remain volatile over the next few weeks. So, ensure to trail your profits.
Dow Jones Industrial Average March futures- Daily chart
Click the link to view the chart- TradingView — Track All Markets
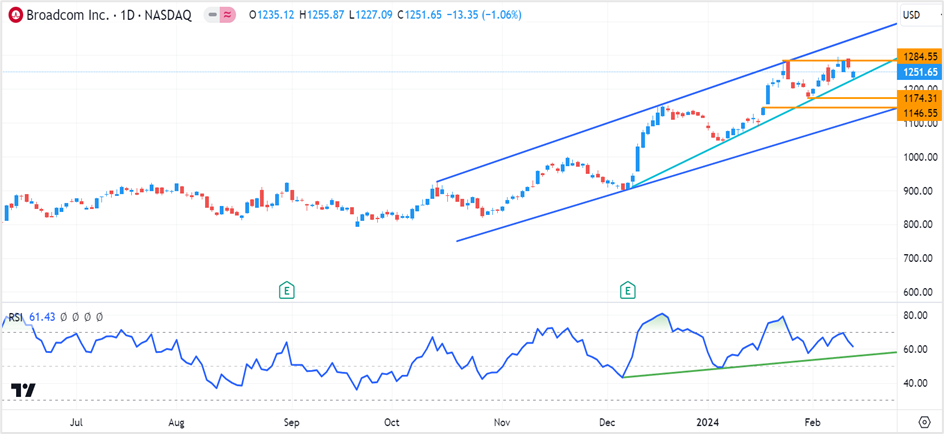
Broadcom Inc (AVGO)
Broadcom rebounded after testing trendline support at $1230.00 to end Tuesday’s session at $1251.65, down by 1.06%. The chip giant surged more than 12% year-to-date and rallied 6% in February as the Artificial Intelligence (AI) frenzy has led to massive buying in semiconductor stocks like Broadcom, Nvidia Corp (NVDA), and Advanced Micro Devices (AMD)/
The near-term support for the stock now comes at $1240.00, and a close below the level could push prices further toward the January lows of $1174.00. On the upside, the resistance zone is at the recent all-time highs of $1285.00-$1295.00. A close above this zone clearly indicates that the bulls aren’t done yet, and the rally will likely extend to the next trendline resistance at $1355.00-$1360.00.
Strategy:
Go long at $1240.00 with a stop and reverse (SAR) at $1225.00 for a profit target of $1290.00. If prices break $1225.00, hold on to the shorts with a stop loss at $1250.00 for a profit target of $1175.00. You can also initiate long trades if Broadcom closes above $1295.00. Place a stop loss at $1275.00 and exit as the stock approaches $1350.00.
Markets will likely remain volatile over the next few weeks. So, ensure to trail your profits.
Broadcom Inc- Daily chart
Click the link to view the chart- TradingView — Track All Markets