Alpari
 XM
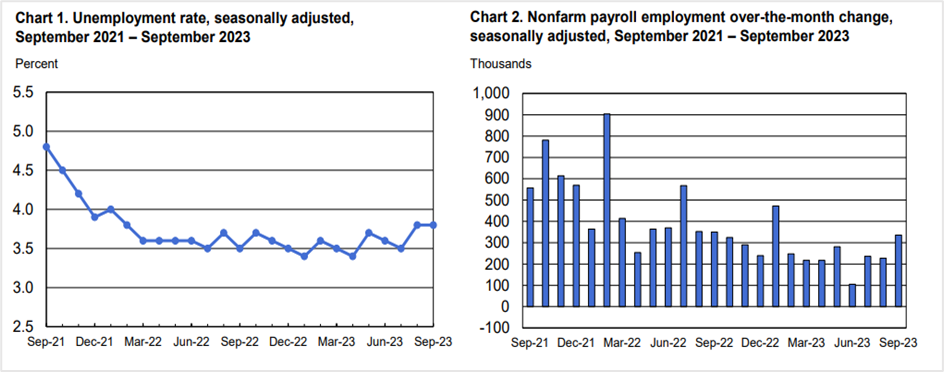
XMUnemployment rate unchanged at 3.8%, while wage growth slows
US nonfarm payroll employment spiked by 336,000 in September from an upwardly revised 227,000 the previous month, the US Bureau of Labor Statistics (BLS) reported on Friday. The robust payroll numbers almost doubled from the 170,000 expected in a poll of economists by the Wall Street Journal and sharply higher from August’s preliminary reading of 187,000. Meanwhile, the unemployment rate was steady at 3.8%, broadly in line with economists’ forecasts. However, in some good news for the markets, the average hourly earnings rose by a tiny 0.2% in September, the least in 18 months, slowing to 4.2% from a 4.3% increase last year.
US Nonfarm Payrolls- October 2022- September 2023
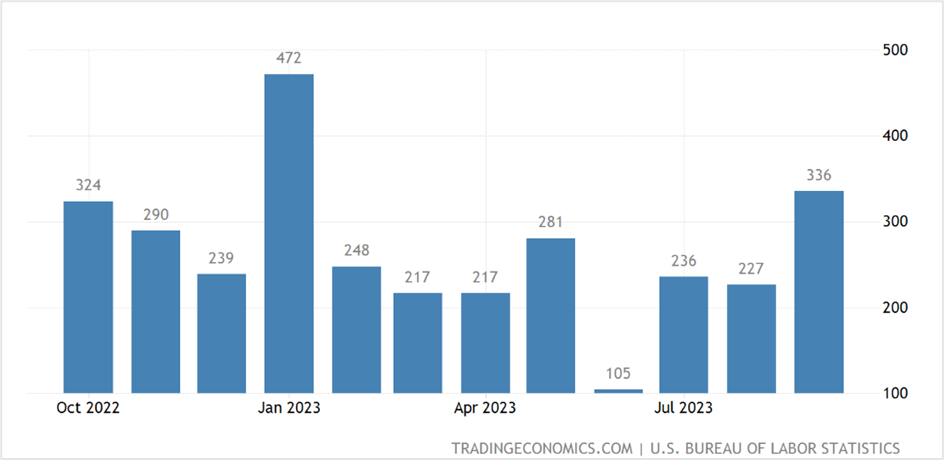
September’s nonfarm payrolls registered the sharpest jump since January, even as the US economy added more jobs in July and August than previously estimated, indicating the resilience of the labor market and the broader economy. The job growth in August was revised from 187,000 to 227,000, and the July employment numbers were raised from 157,000 to 236,000.
The solid labor market report comes 18 months after the US Central Bank began lifting interest rates to cool demand, and while policymakers ponder the future course of action for the remainder of the year, the surprise increase in hiring could complicate the Federal Reserve’s decision on when it should stop raising rates. According to Fed Funds futures data, the shock increase in the payroll numbers raised the likelihood of a 25-basis points rate hike on November 1st.
The other highlights of the US nonfarm payrolls data-
The labor statistics come from two monthly surveys- The household and the establishment surveys. The first survey measures the status of the labor force, including unemployment by demographic characteristics, and the latter measures nonfarm employment, hours, and industrywise earnings. Let’s look at them separately-
The household survey disclosed the number of unemployed individuals at 6.4 million, the same as the previous month. Of this, those unemployed over the long term or without a job for 27 weeks or more were at 1.2 million in September, accounting for 19.1% of the total unemployed. In addition, the number of individuals employed part-time was at 4.1 million, almost flat month-on-month. These people would have preferred full-time jobs but worked part-time because their hours had been reduced or they could not find full-time employment.
Among the major worker groups, the unemployment rates for adult men stood at 3.8%, adult women at 3.1%, teenagers at 11.6%, whites at 3.4%, blacks at 5.7%, Asians at 2.8%, and Hispanics at 4.6%. The labor force participation rate was 62.8%, and the employment-population ratio was 60.4%, unchanged month-on-month.
The establishment survey showed payrolls increasing by 336,000 in September, above the 12-month average of 267,000. Job gains were seen in leisure and hospitality, government, healthcare, technical services, social assistance, and other fields. On the other hand, employment in transportation and warehousing was little changed from the previous month.
The average hourly earnings for employees on private nonfarm payrolls increased by 7 cents, or 0.2%, to $33.88, recording an annual average hourly earnings rate of 4.2%. Lastly, the average workweek for all private sector employees was unchanged at 34.4 hours in September.
Economists’ response to the US nonfarm payroll data
Brian Coulton, the chief economist of Fitch Ratings, believes the labor market will not cool from continuing job market growth, keeping upward pressure on wages and driving the Fed to keep raising interest rates.
Robert Frick, the chief corporate economist at Navy Federal Credit Union, predicted a sharp increase in the September employment numbers. His analysis was based on the third-quarter gross domestic product (GDP) figures and the number of individuals entering the workforce drawn by higher wages.
According to Kathy Bostjancic, the chief economist at Nationwide, bond yields are soaring, the dollar remains strong, and the equity markets are volatile, an indication of tightening financial conditions. Although it does some of the work for the Fed, she believes the rate hikes will continue.
Market reaction to the private-sector payroll news
The US stock markets reversed the Friday morning declines to stage a surprise rally. Stocks initially sold off after the robust jobs report amid fears that the Fed will continue raising interest rates and wreck the economy but rebounded intraday on short covering. The Dow Jones Industrial Average closed 0.87% higher at 33,407.58, a four-day high; the S&P 500 rose 1.18% to 4,308.50, registering the highest weekly close, and the Nasdaq 100 jumped 1.7% to end Friday’s session at 14,973.24, the best closing since September 19th. Some analysts think the rally could be seasonal after a rough September and amid optimism that the corporate earnings recession could be behind us.
US Treasury yields rose on Friday after the better-than-expected employment report drove investors to sell government bonds amid expectations that interest rates will continue to climb. The yield on the 2-year Treasury was up 6-basis points to 5.085%, while the yield on the benchmark 10-year note surged 8-basis points to 4.799%, pulling back from 16-year highs of 4.887%. Meanwhile, the 30-year bond yield rose 8.1 basis points to 4.974%.
The US Treasury and the broader US bond markets will remain closed on October 9th for Columbus Day and Indigenous Peoples Day.
CME FedWatch Tool
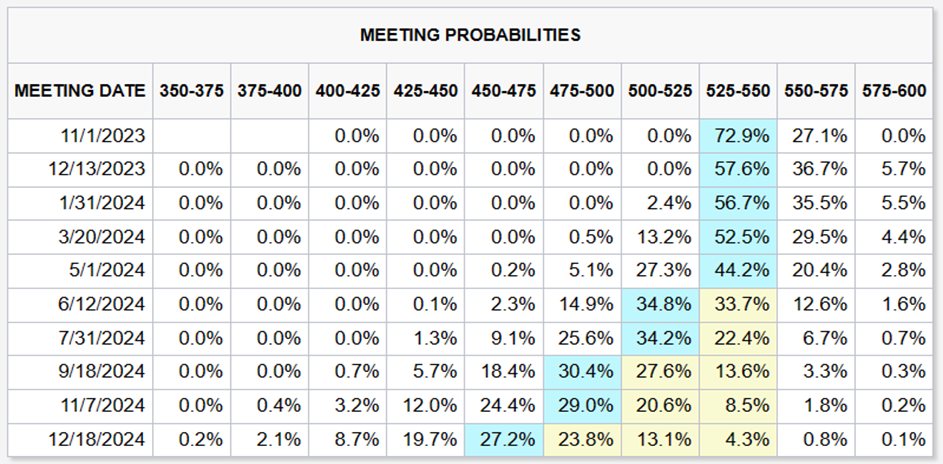
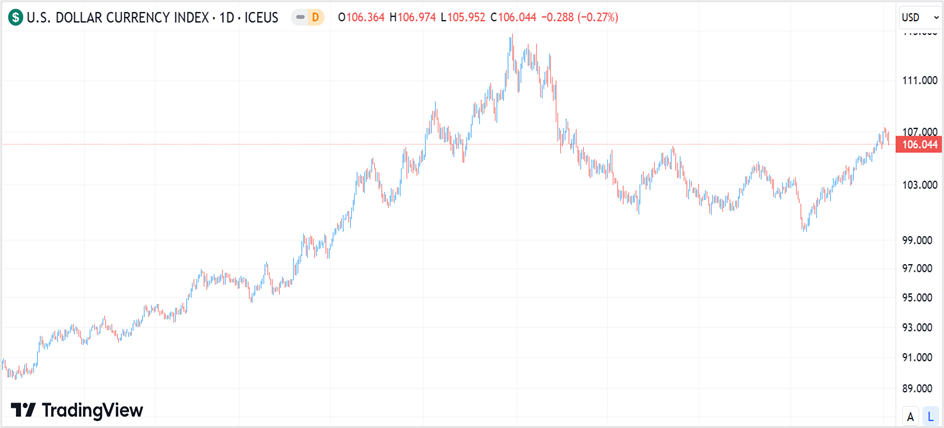
The US dollar slid against its six major counterparts after the blowout US jobs report surprised market participants. The payroll data raised expectations of a rate hike this year and pushed the first rate cut expectations further into late 2024. The greenback declined for the third successive day, with the ICE-traded dollar index futures (DXY) ending Friday’s session at 106.04, the lowest close since September 25th, after climbing as high as 106.98 earlier in the day.
In the spot markets, the US currency fell 0.36% versus the euro to close at 1.05844 and 0.37% against the pound sterling to settle at 1.22356, while the USDJPY pair rose 0.49% to 149.23, to register the highest weekly close.
US Dollar Index- daily chart
Technical View
S&P 500 December futures
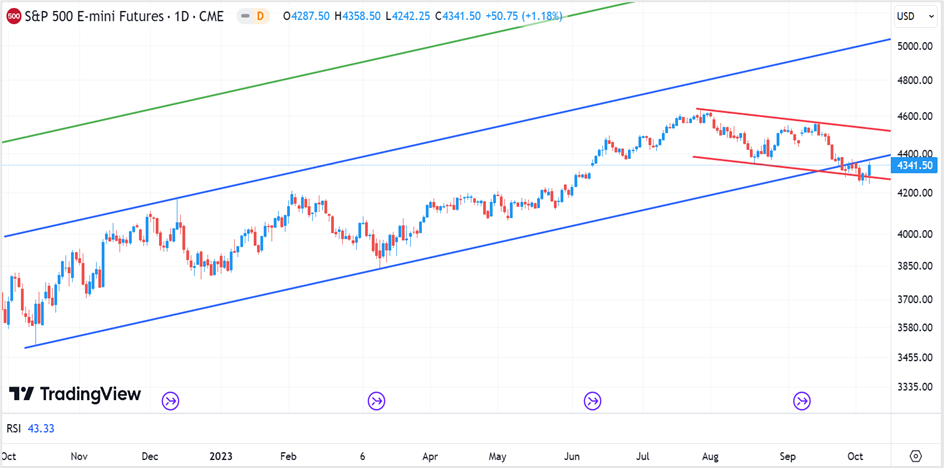
The S&P 500 December futures are trying to rebound into the primary uptrend after sliding into bearish territory in the last week of September. While Friday’s rally is a start, the benchmark index closed slightly below 4375-4385, the long-term uptrend support (lower blue trendline). For the index to regain the primary bullish trend, it should close above 4385 for the rest of the week, a tall ask, considering the release of the US CPI data on Thursday. Simply put, this week could determine if US stocks bounce back and continue surging to probably test newer highs or if Friday’s rebound was only due to profit booking and short-term bargain hunting.
The trading strategy will be to go short on the S&P 500 December futures at 4385, with a stop loss at 4425 for a price target of 4275-4300. On the other hand, if the index futures close above 4400 on Thursday, go long with a stop at 4360 for a target of 4500-4550.
S&P 500 E-mini futures- daily chart
Gold December futures
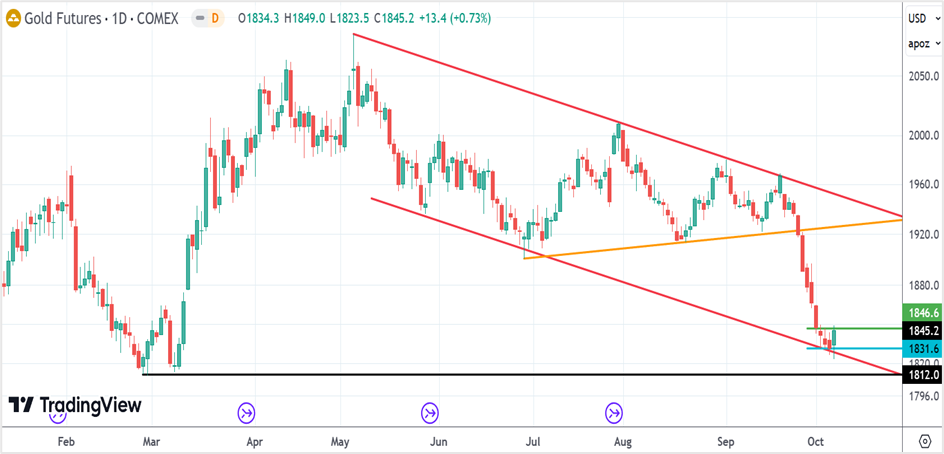
Gold December futures reversed a nine successive losing streak to settle at $1845.20 a troy ounce on Friday, up 0.73% for the day. The precious metal has been in a long-term downtrend, illustrated by the downward-sloping red trendlines, with the support zone at $1825.00-$1830.00 (blue horizontal line) and near-term resistance at $1846.00 (green horizontal line). A close above this resistance level will be bullish for gold, with prices likely to surge to the previous lows at $1925.00-$1930.00 (orange trendline) and possibly test the upper end of the long-term downward channel at $1950.00 (upper red trendline). On the contrary, a close below $1825.00 will signal further bearishness, with prices likely to fall to $1812.00 (black horizontal line).
The trading strategy will be to buy the precious metal if prices dip to $1825.00-$1830.00, with a stop loss at $1800.00 for a profit target of $1925.00. You can also go long on Gold December futures if prices close above $1846.00 or break $1855.00. Place a stop loss at $1830 and exit as prices approach $1925.00.
Gold December futures- daily chart