
USDCAD: ⬆️ Buy
– USDCAD broke resistance zone
– Likely rise to resistance level 1.3900
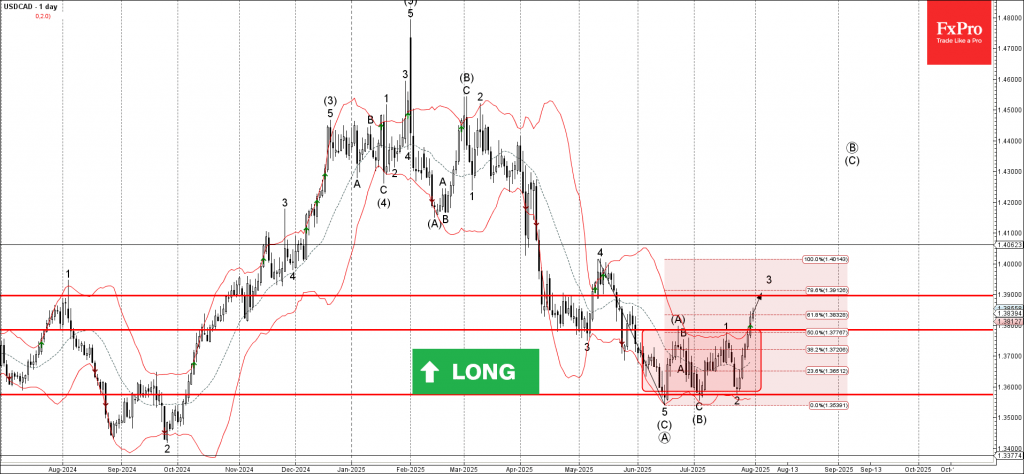
USDCAD currency pair recently broke the resistance zone located between the resistance level 1.3785 (upper border of the sideways price range from the start of June) and the 50% Fibonacci correction of the downward impulse from May.
The breakout of this resistance zone accelerated the active impulse wave 3, which belongs to medium-term impulse wave (B) from the start of July.

USDCAD currency pair can be expected to rise further to the next resistance level 1.3900 (target price for the completion of the active impulse wave 3).
Source: https://fxpro.news