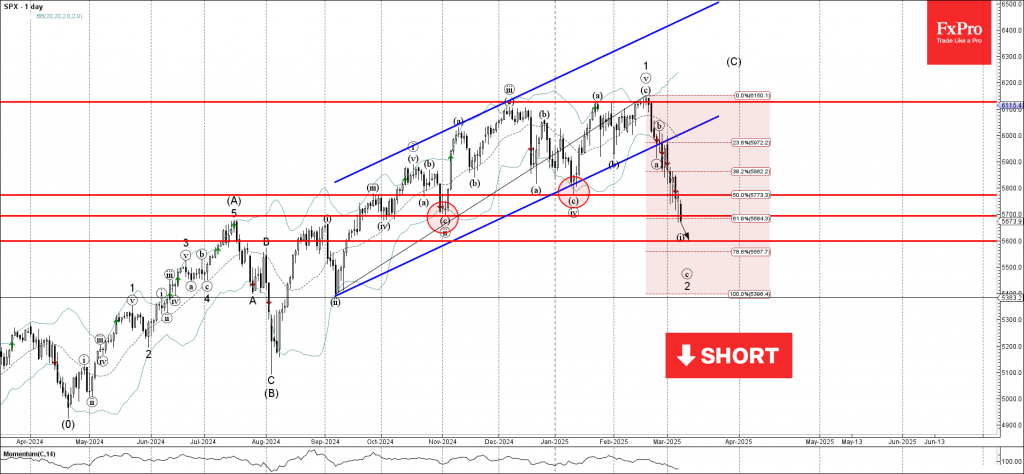
Skip to content
Country Flag US
Select Country
Country selection We will display only brokers and information that is relevant to your country.
Currently selected country
Select a different country
Language See the content translated in your language.

S&P 500 Wave Analysis – 10 March 2025

S&P 500: ⬇️ Sell– S&P 500 index broke support zone– Likely to fall to support level 5600.00S&P 500 index recently broke the support zone between the support levels 5775.00 (monthly low from January) and 5690.00 (strong support from October and November).These support levels c…

UpdatedMar 11, 2025
1 mins read

S&P 500: ⬇️ Sell

– S&P 500 index broke support zone

– Likely to fall to support level 5600.00

S&P 500 index recently broke the support zone between the support levels 5775.00 (monthly low from January) and 5690.00 (strong support from October and November).

These support levels coincided with the 50% and 61.8% Fibonacci retracement levels of the earlier upward impulse from September.

S&P 500 index can be expected to fall to the next support level 5600.00 (target price for the completion of the active short-term impulse wave (i)).

Source: https://fxpro.news

Table of contents