 AXITrader
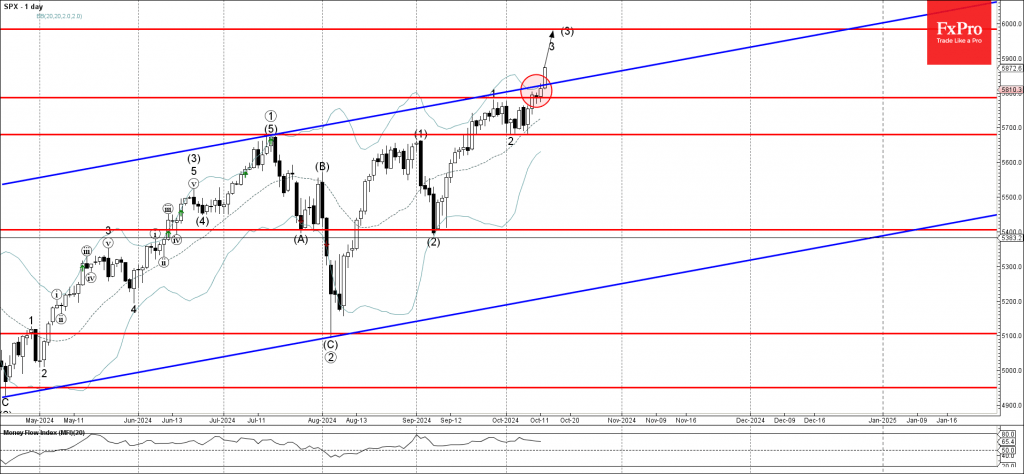
– S&P 500 index broke resistance level 5785.00
– Likely to rise to resistance level 5985.00
S&P 500 index under the bullish pressure after the price broke resistance zone located between the pivotal resistance level 5785.00 (which stopped wave 1 last month) and the resistance trendline of the daily up channel from last year.
The breakout of this resistance zone accelerated the active short-term impulse wave 3 of the higher extended impulse wave (3) from the start of September.
Given the clear daily uptrend, S&P 500 index can be expected to rise further to the next resistance level 5985.00 (target for the completion of the active impulse wave (3)).

Source: https://fxpro.news