 AXITrader
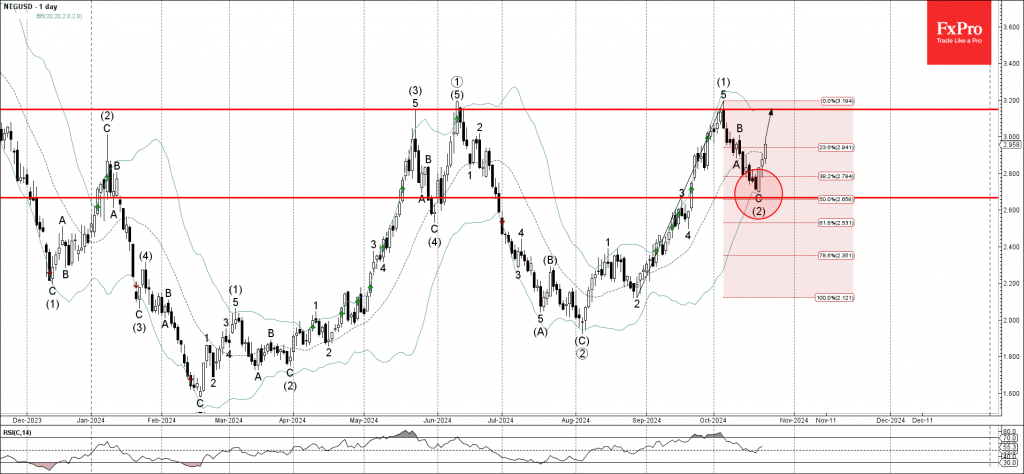
– Natural gas reversed from support zone
– Likely to rise to resistance level 3.150
Natural gas recently reversed up from the support zone between the support level 2.665 (former minor resistance from September) intersecting with the lower daily Bollinger Band and the 50% Fibonacci correction of the upward impulse from August.
The upward reversal from this support zone started the active medium-term impulse wave (3) – which belongs to the longer-term impulse wave 3.
Natural gas can be expected to rise toward the next resistance level 3.150 (which stopped the three earlier impulse waves (3), (5) and (1)).

Source: https://fxpro.news