 AXITrader
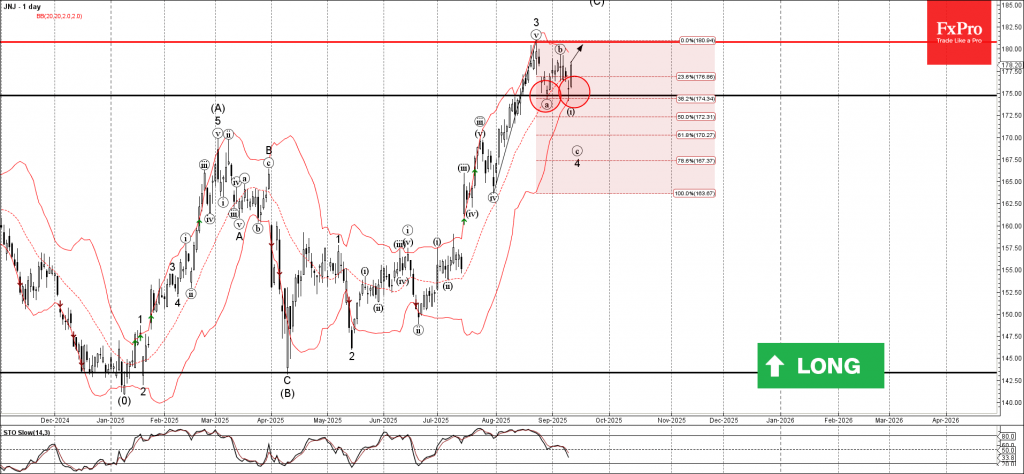
Johnson & Johnson: ⬆️ Buy
– Johnson & Johnson reversed from the support area
– Likely to rise to next resistance level 180.8
Johnson & Johnson recently reversed from the support area between the pivotal support level 175.00 (which stopped the earlier correction a) and the lower daily Bollinger Band.
The upward reversal from this support area created the daily Japanese candlesticks reversal pattern Morning Star Doji.

Given the clear daily uptrend, Johnson & Johnson can be expected to rise to the next resistance level 180.8 (former top of wave 3).
Source: https://fxpro.news