Analysis & Forecast
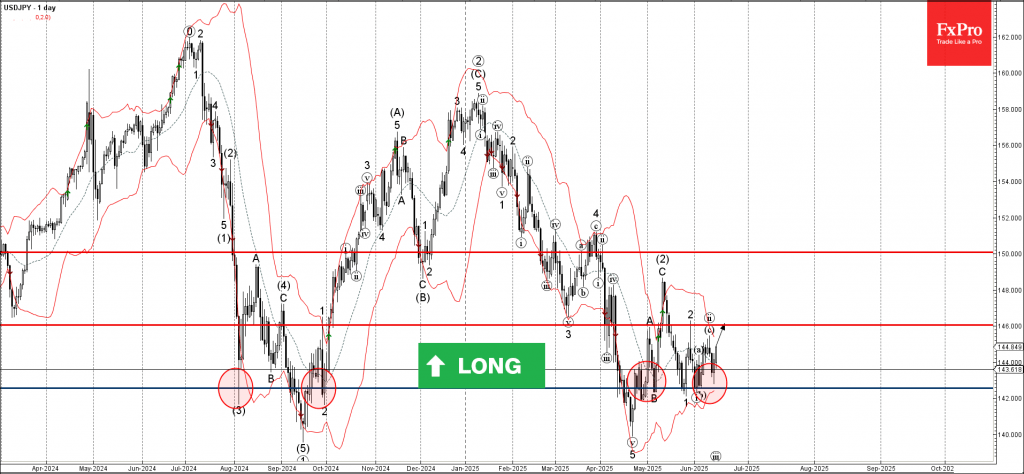
USDJPY: ⬆️ Buy– USDJPY reversed from the support zone– Likely to rise to the resistance level 146.00USDJPY currency pair recently reversed from the support zone surrounding the pivotal support level 142.50, which has been reversing th...
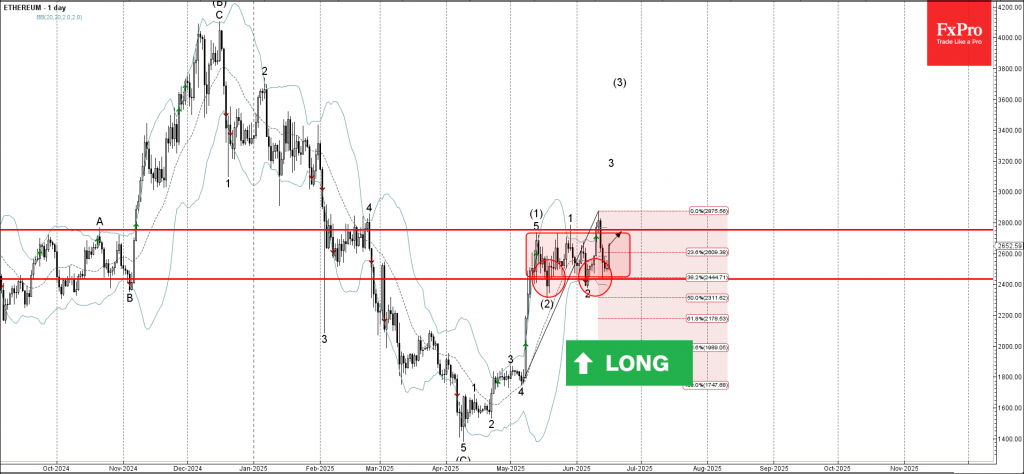
Ethereum: ⬆️ Buy– Ethereum moving inside sideways price range– Likely to rise to the resistance level 2754.00Ethereum cryptocurrency recently reversed up from the support zone between the support level 2435,00 (lower border of the act...
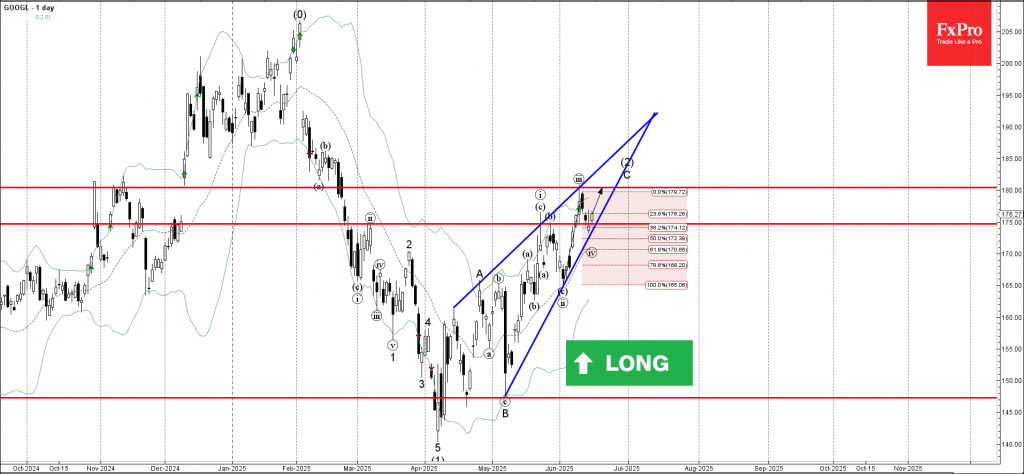
Google: ⬆️ Buy– Google reversed from support level 175.00– Likely to rise to the resistance level 180.00Google recently reversed up from the support zone between the support level 175.00 (former Double Top from May) and the 38.2% Fibo...
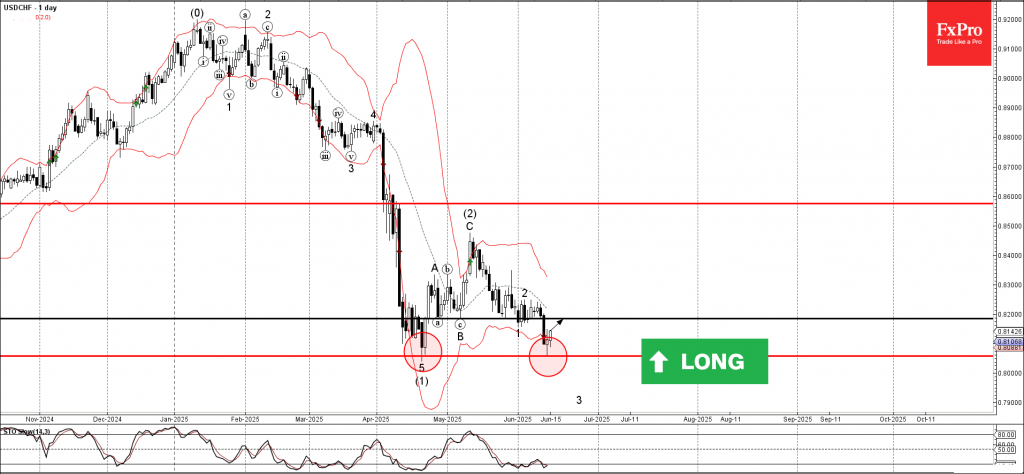
USDCHF: ⬆️ Buy– USDCHF reversed from key support level 0.8055– Likely to rise to resistance level 0.8185USDCHF currency pair recently reversed up from the key support level 0.8055, which stopped the previous impulse wave (1) at the en...
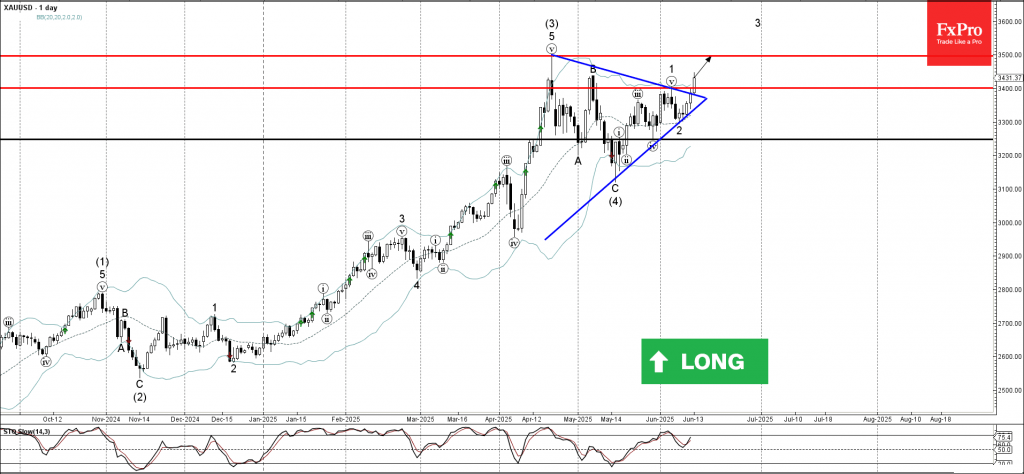
Gold: ⬆️ Buy– Gold recently broke resistance level 3400.00– Likely to rise to resistance level 3500.00Gold recently broke the resistance level 3400.00 coinciding with the resistance trendline of the daily Triangle from April.The break...
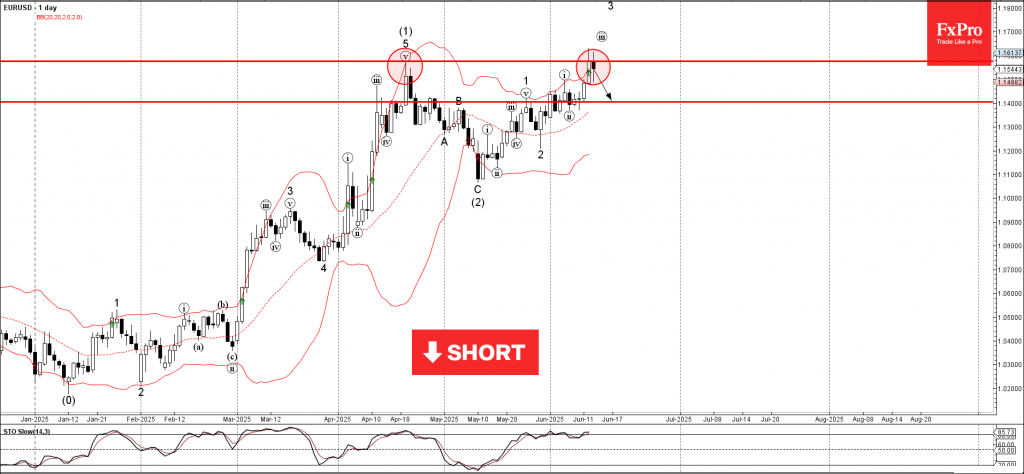
EURUSD: ⬇️ Sell– EURUSD reversed from the resistance level 1.1575– Likely to fall to support level 1.1400EURUSD currency pair recently reversed down from the resistance level 1.1575, which stopped the previous sharp impulse wave (1) i...
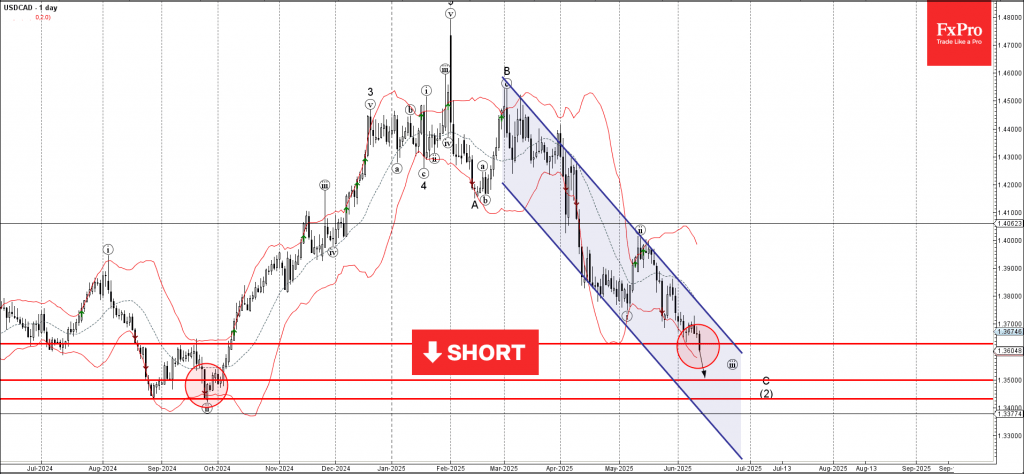
USDCAD: ⬇️ Sell– USDCAD broke key support level 1.3630– Likely to fall to support level 1.3500USDCAD currency pair recently broke the key support level 1.3630, which previously formed the daily Hammer reversal pattern at the start of ...
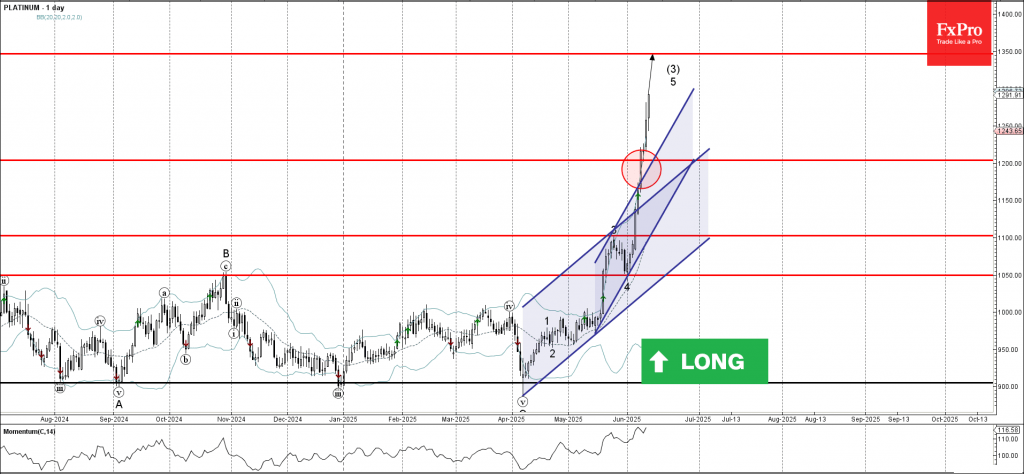
Platinum: ⬆️ Buy– Platinum broke resistance zone– Platinum to rise to resistance level 1350.00Platinum continues to rise strongly after the recent breakout of the resistance zone between the key resistance level 1200.00 and the resist...
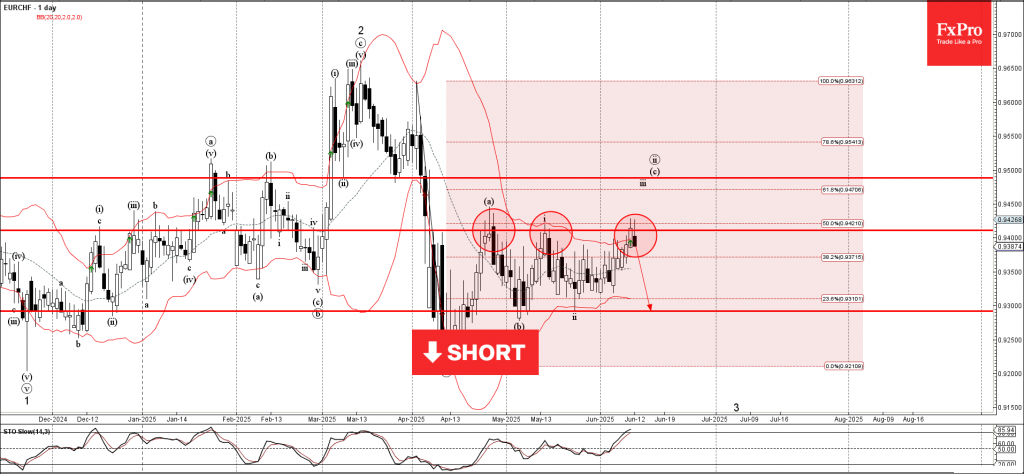
EURCHF: ⬇️ Sell– EURCHF reversed from the resistance zone– Likely to fall to support level 0.9300EURCHF currency pair recently reversed down from the resistance zone between the key resistance level 0.9410 (which has been reversing th...
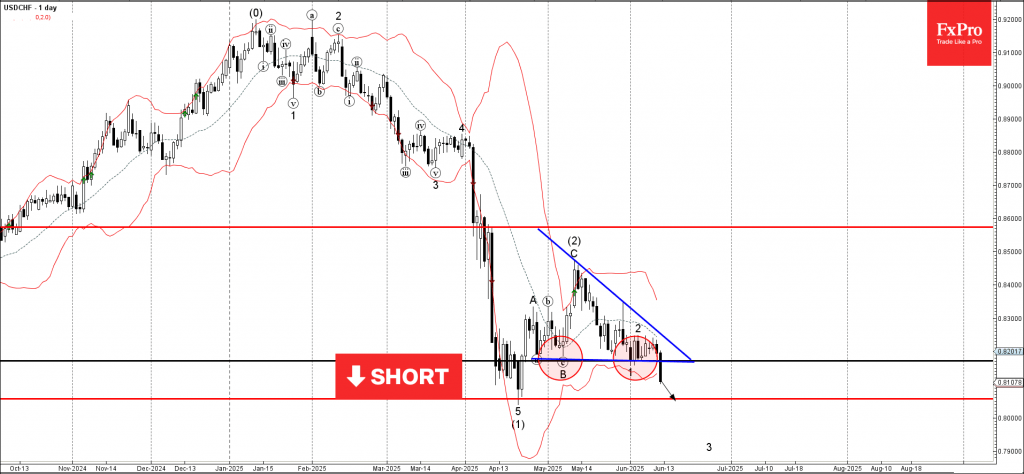
USDCHF: ⬇️ Sell– USDCHF broke support level 0.8170– Likely to fall to support level 0.8050USDCHF currency pair recently broke the key support level 0.8170, which stopped the previous waves B and 1, as can be seen below.The breakout of...

