
– Gold broke daily Triangle
– Likely to rise to resistance level 2750.00
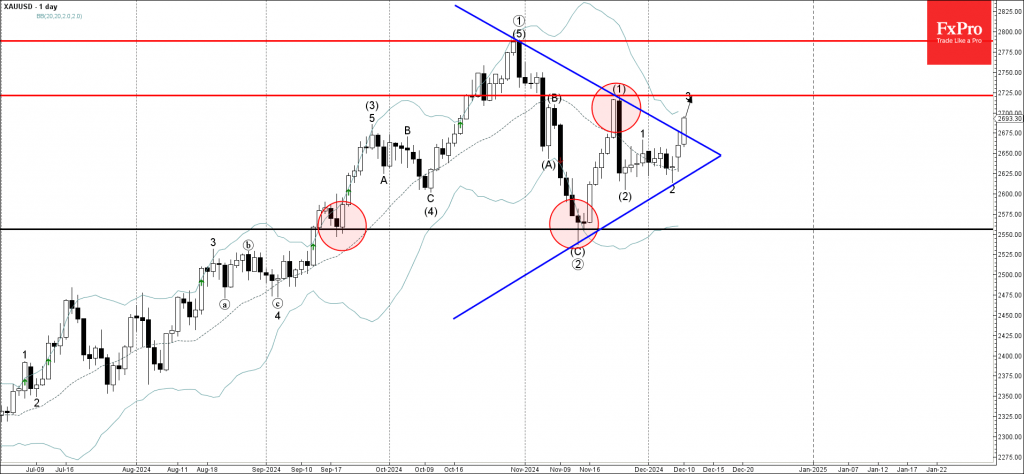
Gold recently broke the resistance trendline of the daily Triangle, inside which it has been moving from the middle of October, as can be seen from the daily Gold chart below.
The breakout of this Triangle accelerated the active short-term impulse wave 3 – which belongs to the intermediate impulse wave (3) of the primary impulse wave 3 from last month.
Given the strong multi-month uptrend, Gold can be expected to rise to the next resistance level 2750.00, top of the previous impulse wave (1) from November and the forecast price for the completion of the active impulse wave 3.

Source: https://fxpro.news