Analysis & Forecast
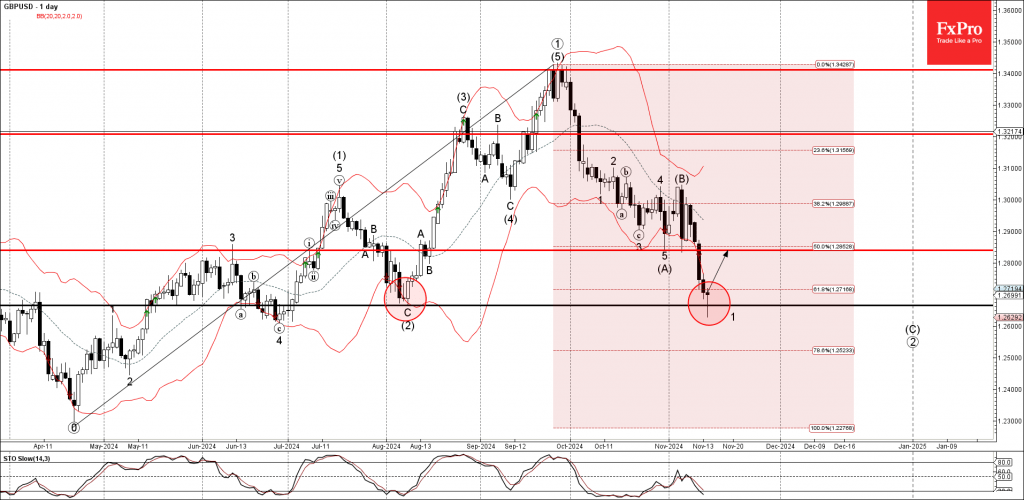
– GBPUSD reversed from strong support level 1.2665– Likely to rise to resistance level 1.2840GBPUSD currency pair recently reversed up from the strong support level 1.2665 (former monthly low from August), standing close to the lower dail...

– USDCAD broke resistance level 1.3950– Likely to rise to resistance level 1.4050USDCAD currency pair rising strongly after the earlier breakout of the resistance level 1.3950 (former multi-month high from August).The breakout of the resi...

– USDJPY broke key resistance level 154.70– Likely to rise to resistance level 157.20USDJPY currency pair recently broke the key resistance level 154.70 (former stern support from June, which has been reversing the price from the end of J...

– USDJPY broke key resistance level 154.70– Likely to rise to resistance level 157.20USDJPY currency pair recently broke the key resistance level 154.70 (former stern support from June, which has been reversing the price from the end of J...
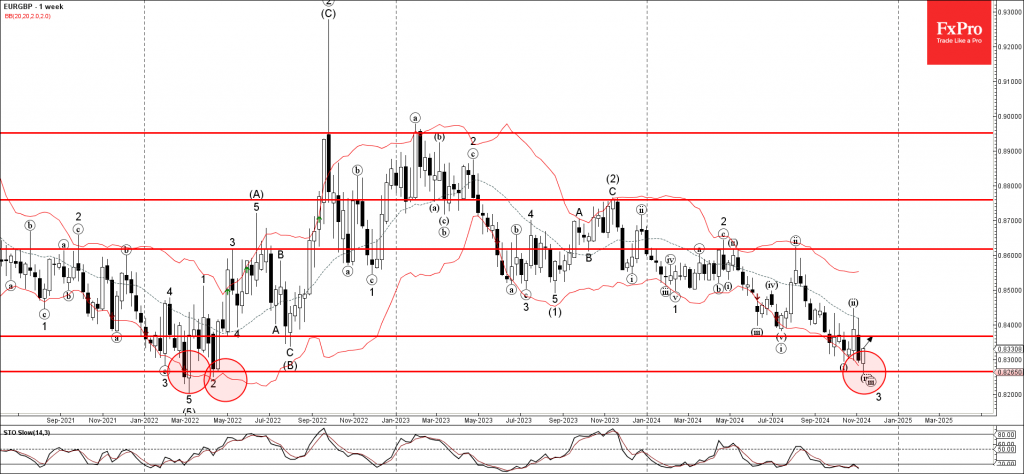
– EURGBP reversed from long-term support level 0.8265– Likely to rise to resistance level 0.8365EURGBP currency pair previously reversed up from the long-term support level 0.8265 (former powerful support from the start of 2022) coincidin...
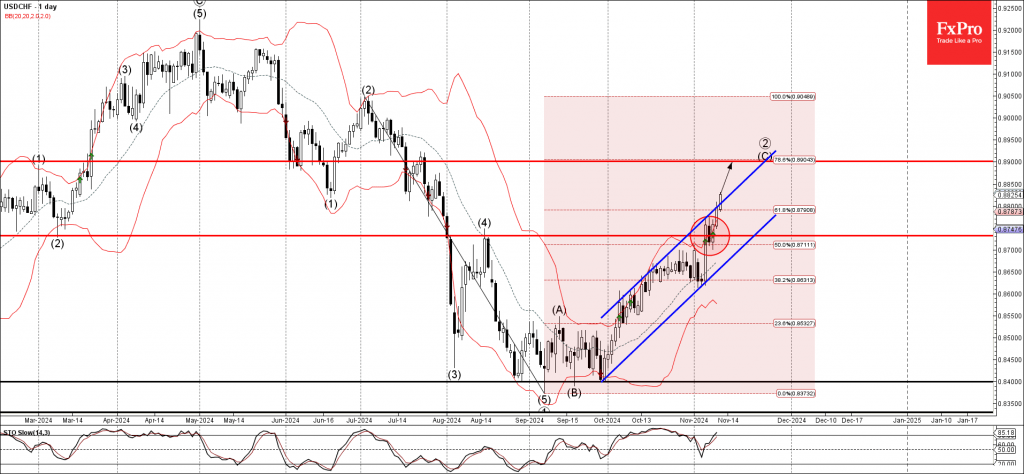
– USDCHF rising inside impulse wave (C)– Likely to reach resistance level 0.8900USDCHF currency pair continues to rise inside the medium-term impulse wave (C), which previously broke the resistance level 0.8730 coinciding with the 50% Fib...
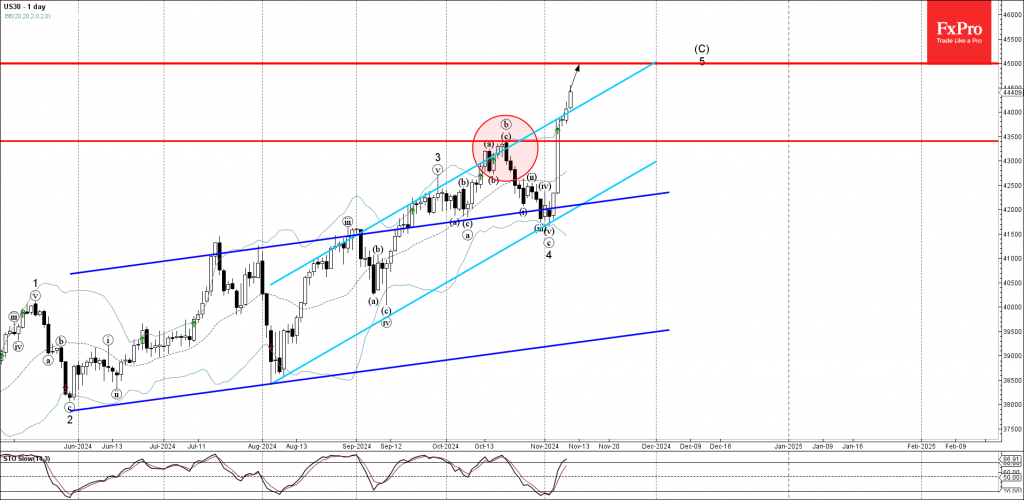
– Dow Jones rising inside impulse wave 5– Likely to reach resistance level 45000.00Dow Jones index continues to rise inside the minor impulse wave 5, which previously broke the key resistance level 43500.00 and the resistance trendline of...

– EURUSD under bearish pressure– Likely to fall to support level 1.0600EURUSD currency pair is under bearish pressure after the earlier breakout of the key support level 1.0685, which has been reversing the price from the middle of June.T...
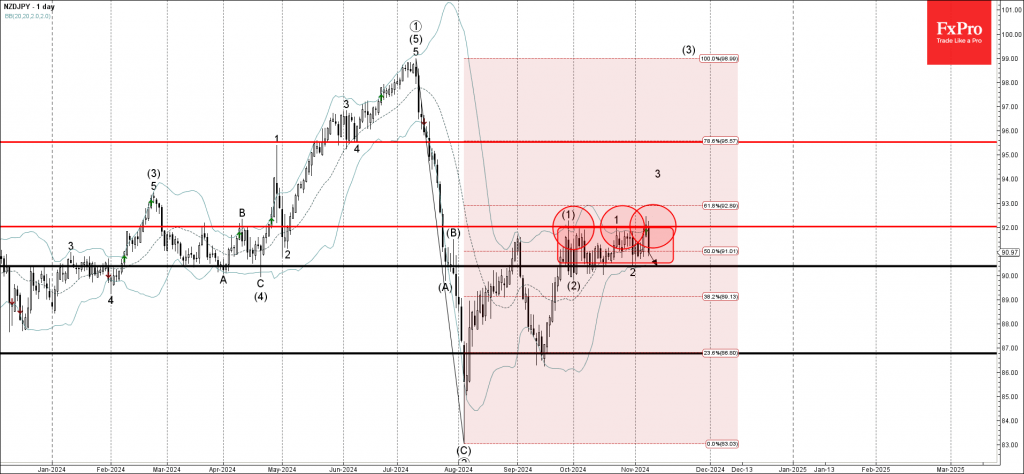
– NZDJPY reversed from resistance level 92.00– Likely to fall to support level 90.40NZDJPY currency pair recently reversed down from the resistance level 92.00, which is the upper boundary of the narrow sideways price range inside which t...
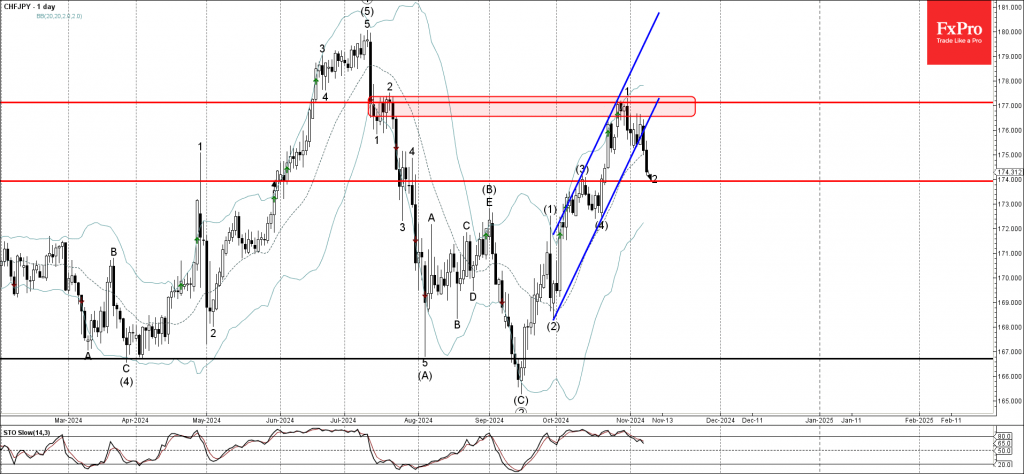
– CHFJPY broke daily up channel– Likely to fall to support level 174.00CHFJPY currency pair under bearish pressure after the earlier breakout of the support trendline of the sharp daily up channel from the end of September.The breakout of...