Core prices cool, but simmering inflation remains a concern for the US economy
The US producer price index (PPI) for final demand, which measures the cost of finished goods paid by producers, rose 0.5% month-on-month in September, more than the 0.3% forecast by economists, data released by the US Bureau of Labor Statistics showed. However, the increase was the lowest in three months and followed a 0.7% surge in August.
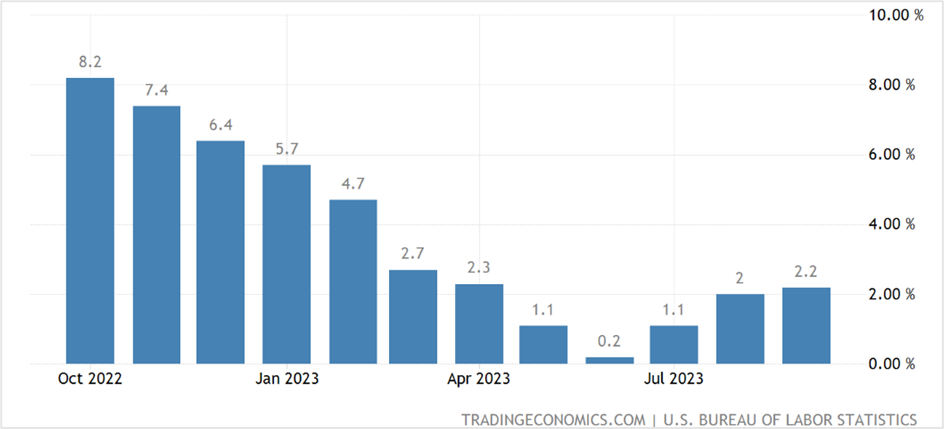
The index measuring the prices of final demand goods jumped 0.9%, led by gasoline, while the cost of services rose 0.3%. For the year, headline producer prices climbed 2.2% in September, registering the largest increase since April and from 2.0% in August.
Meanwhile, core PPI inflation, which excludes energy, food, and trade services, rose 0.2% in September from 0.3% the previous month and at an annual pace of 2.8%, slightly below the 2.9% recorded in August. The PPI is a leading inflation indicator, measuring a wide variety of costs used in consumer products and, along with the CPI data, feeds into policy decisions of the Federal Reserve.
US September producer price inflation (year-on-year)

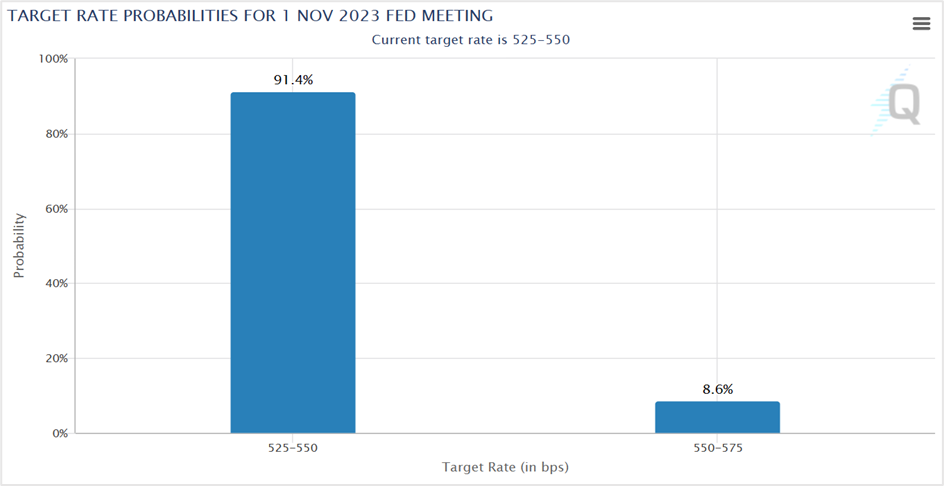
According to the CME Group’s FedWatch Tool, traders are widely anticipating the Federal Reserve to leave rates unchanged following its October 31st – November 1st policy meeting. Since March 2022, the US central bank has lifted its benchmark Fed Funds rate by 525 points to the present 5.25%-5.50% range. This follows comments from top Fed officials that the rising yields on the long-term US government bonds will push the central bank from lifting rates further. Also, the minutes of the FOMC’s September 19th-20th meeting released on Wednesday showed that policymakers were convinced that inflation is heading back to 2%, although there was no clear consensus on whether they should hike one more time this year.
Alex McGrath, the chief investment officer at NorthEnd Private Wealth in Greenville, South Carolina, thinks that while this is a significant shift by the Fed, markets could be misreading the statements.

Key takeaways from the September producer price index data
The index for final demand goods rose for the third consecutive month in September, with about a third of the increase coming from a 3.3% gain in the prices for final demand energy. Of this, a 5.4% jump in the index for gasoline contributed to around 40% of the price increase in the final demand goods. Meanwhile, jet fuel prices, electric power, diesel fuel, and meats also advanced. On the contrary, the index measuring fresh and dry vegetables plunged 13.9 percent, while wood pulp and utility natural gas prices also slid. In summary, the indexes measuring final demand food and final demand goods less food and energy moved up 0.9% and 0.1%, respectively.
On the other hand, about 60% of the September increase in the index for final demand services was attributed to a 0.3% increase in the prices for final demand services, less trade, transportation, and warehousing. The advance was led by a 13.9% jump in the index for deposit services (partial). Meanwhile, the index gauging the final demand for trade services climbed 0.5%.
12-month percent changes in PPI final demand price indexes, not seasonally adjusted

Economists’ response to the producer price index news
Christopher Rupkey, the chief economist at GFWDBONDS, said Fed policymakers have not completed the job of toppling inflation. If anything, they have their task cut out since most of the inflation in producer prices is from food and energy, which monetary policy doesn’t impact much.
Will Compernolle, a macro strategist at FHN Financial, believes that while cooling goods prices is essential from the Fed’s perspective, it does not necessarily guarantee price stability. He is confident that much of consumer inflation is in the core services, which are weakly connected with the producer price index.
Mike Loewngart from Morgan Stanley’s Global Investment Office says we have not witnessed the end of high inflation and interest rates. He said bringing inflation down from last year’s peaks was one challenge, but getting it down to the Fed’s 2% target is another.
Market reaction following the release of the US PPI data
US equity markets have been on a roll since the release of the nonfarm payroll data last week. After wavering at the open, the three widely watched stock indices rebounded to end another session in positive territory. The Dow Jones Industrial Average closed 0.19% higher at 33,804.87. Likewise, the benchmark S&P 500 settled at 4,376.95, up 0.43% for the day, while the Nasdaq 100 ended with gains of 0.72% at 15,241.1. The Dow advanced for the sixth straight day, while the S&P 500 and the Nasdaq 100 registered four successive winning sessions.
While the market-friendly statements from central bank officials concerning no further rate hikes might have contributed to the sharp recovery in equities, the September consumer price index data due later today could change that view.
US Treasurys were mixed on Wednesday, with the yield on the rate-sensitive 2-year Note climbing 2.9 basis points to close at 5.003%, pulling back slightly after advancing as much as 4.3 basis points following the release of the PPI data. The yield captures expectations of how far the Federal Reserve will hike rates over that period. Meanwhile, the yields on the 10-year Note fell 10 basis points to 4.564%, and the 30-year T-bond tumbled 13.7 basis points to end the session at 4.697%.
In the currency markets, the US dollar was flat against its key counterparts on Wednesday. However, the US currency has pulled back quite a bit after testing the November peak earlier this month. The US dollar index futures (DXY), a measure of the US currency against six others, closed at 105.82, unchanged for the day but is down more than one and a half percent from the October highs of 107.34.
The US dollar index had fallen for six successive days before Wednesday’s flat close after several Fed officials, including Governor Christopher Waller, suggested that the central bank might hold back from further tightening. While analysts debate if the strong pullback in the greenback has finally ended its rally, the index is holding near key support ahead of the September CPI reading later today.
Technical View
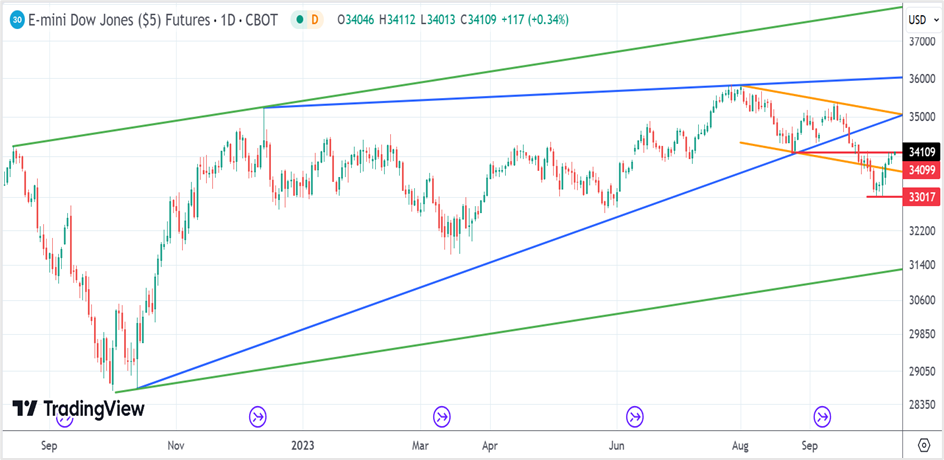
E-mini Dow Jones December futures
Dow Jones December futures advanced for six successive sessions to settle at 33992 on Wednesday. The index is in a secondary downtrend, making lower highs and lower lows since hitting a 19-month peak in August. However, the long-term trend remains bullish, with support at 31,360 (lower green trendline). Ahead of the September CPI data on Thursday, the futures is holding near key resistance at 34,100 (top red horizontal line), a close above which could drive the index toward immediate resistance at 35,000, followed by the 35,800-36,000 (upper blue trendline). On the downside, if the index futures break 33,640, it could slide back below the recent lows of 33,030.
Strategy: Buy E-mini Dow Jones December futures if it closes above 34,100, with a stop loss at 33,000 for a profit target of 35,000. On the contrary, if the index futures break 33,500, short with a stop loss at 33,700 for a profit target of 33,050.

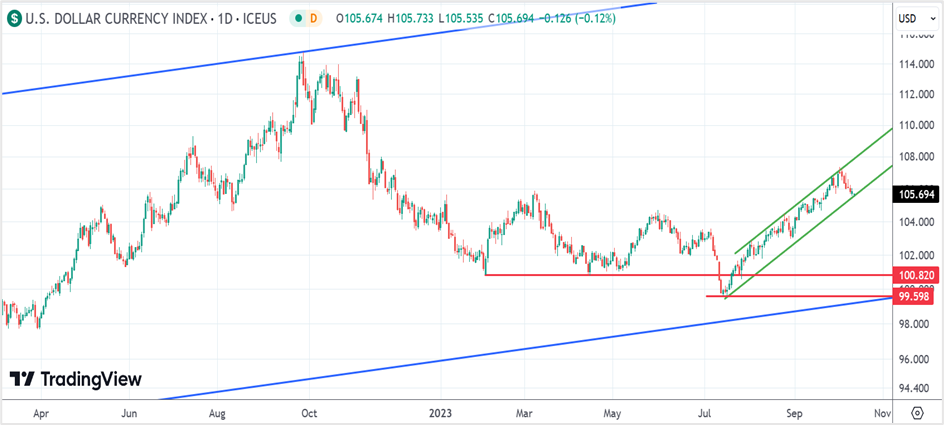
US dollar index futures (DXY)
The US dollar index futures has dropped around 1.5% since its highest close this month, and although the near-term and long-term trends remain bullish, it is holding near crucial short-term support at 105.50. A close below the support or a break below 105.00 could push the index further toward 99.60-100.80 (the two red horizontal lines). However, if the support holds, the index futures will likely test the October highs of 107.35 again.
Strategy: Buy the dollar index futures at 105.50 with a stop and reverse at 104.75 for a target of 107.50. If the index futures hit the stop, continue holding the short position until the dollar index approaches 102.00, with a tight stop loss at 106.00.


 日本US
日本US